Transcription
FINAL PROJECTREPORT #00042134-04-103AVolume IGRANT: DTRT13-G-UTC45Project Period: 10/1/2015 –6/1/16FRP Reinforcement forConcrete: PerformanceAssessment and NewConstructionVolume I: Sierrita De La Cruz CreekBridgeParticipating Consortium Member:University of MiamiMissouri University of Science and TechnologyAuthors:Omid GooranorimiTimothy BradberryEdward DauerJohn MyersAntonio NanniRE-CAST: Research on Concrete ApplicationsFor Sustainable Transportation
Tier 1 University Transportation CenterDISCLAIMERThe contents of this report reflect the views of the authors, who are responsible for the facts andthe accuracy of the information presented herein. This document is disseminated under thesponsorship of the U.S. Department of Transportation's University Transportation CentersProgram, in the interest of information exchange. The U.S. Government assumes no liability forthe contents or use thereof.
TECHNICAL REPORT DOCUMENTATION PAGEReport No. RECAST UTC #00042134-04-103A 2. Government 3. Recipient's Catalog No.Accession No.4. Title and Subtitle5. Report DateFRP Reinforcement for Concrete: Performance Assessment and July 1, 2016New Construction6. Performing Organization Code:Volume I: Sierrita De La Cruz Creek Bridge7. Author(s)8. Performing Organization Report No.O. Gooranorimi, T. Bradberry, E. Dauer, J. Myers, A. NanniProject #00042134-04-103A103(A)9. Performing Organization Name and Address10. Work Unit No.RE-CAST - University of Miami1251 Memorial Drive, Room 32511. Contract or Grant No.Coral Gables, FL 33146-0630USDOT: DTRT13-G-UTC4512. Sponsoring Agency Name and Address13. Type of Report and Period Covered:Office of the Assistant Secretary for Research and TechnologyFinal ReportU.S. Department of TransportationPeriod: 10/1/15 – 7/1/161200 New Jersey Avenue, SE14. Sponsoring Agency Code:Washington, DC 2059015. Supplementary NotesThe investigation was conducted in cooperation with the U. S. Department of Transportation.16. AbstractGlass fiber reinforced polymer (GFRP) composites are emerging as a feasible economical solution to eliminate thecorrosion problem of steel reinforcements in the concrete industry. Confirmation of GFRP long-term durability is crucialto extend its application in aggressive environments. The objective of this study is to investigate the performance ofGFRP materials exposed to the concrete alkalinity and ambient conditions after 15 years of service in a field application.“Sierrita de la Cruz Creek” Bridge (built in 2000, located 25 miles Northwest of Amarillo, Texas) was chosen as a casestudy since it was one of the first bridges that included GFRP as both primary and secondary top mat reinforcements inthe deck. In order to monitor possible changes in GFRP and concrete after fifteen years of service, samples were extractedfrom different locations on the bridge for various analyses. Carbonation depth and pH of the concrete surrounding theGFRP bars were measured. Scanning electron microscopy (SEM) imaging and energy dispersive X-Ray spectroscopy(EDS) were performed to monitor any microstructural degradation or change in the GFRP chemical compositions.Finally, GFRP interlaminar (horizontal) shear strength, glass transition temperature (Tg) and fiber content weredetermined and compared with the results of similar tests performed on control samples at the time of construction. SEMand EDS did not show any sign of GFRP microstructural deterioration or change of chemical composition. Inter-laminarshear strength results were inconclusive as the No. 5 showed a slight improvement, while the strength of No. 6 decreased.Tg and fiber content were comparable to pristine values. The results of this study represent an additional data point tovalidate the notion that GFRP bar properties are maintained during 15 years of service as concrete reinforcement in a fieldapplication.17. Key Words18. Distribution StatementGFRP, corrosion resistance, reinforcedNo restrictions. This document is available to the public.concrete, durability, SEM19. Security Classification (of this report) 20. Security Classification (of this page) 21. No of PagesUnclassifiedUnclassified36Form DOT F 1700.7 (8-72)Reproduction of form and completed page is authorized.
FRP REINFORCEMENT FOR CONCRETE: PERFORMANCE ASSESSMENT ANDNEW CONSTRUCTIONVOLUME I: SIERRITA DE LA CRUZ CREEK BRIDGEPREPARED FOR THEUNIVERSITY TRANSPORTATION CENTERIN COOPERATION WITH THEMISSOURI UNIVERSITY OF SCIENCE AND TECHNOLOGY ANDOWENS CORNINGWritten By:Omid Gooranorimi1, Tim Bradberry2, Edward Dauer3, John Myers4, Antonio Nanni51Ph.D. Candidate in Civil Engineering, University of MiamiEngineering Support Lead, Bridge Division, Texas Department of Transportation3Research Associate Professor of Biomedical Engineering, University of Miami4Professor of Civil, Arch. & Environ. Engineering, Missouri University of Science and Technology5Professor and Chair of Civil, Arch & Environ. Engineering, University of Miami2UNIVERSITY OF MIAMIRE-CASTSubmittedJune 2016II
FRP REINFORCEMENT FOR CONCRETE: PERFORMANCE ASSESSMENT ANDNEW CONSTRUCTIONVOLUME I: SIERRITA DE LA CRUZ CREEK BRIDGEEXECUTIVE SUMMARYConfirmation of long-term durability is perhaps the only barrier to widespread acceptance of glassfiber reinforced polymer (GFRP) in field applications. Accelerated laboratory tests are used to investigatethe GFRP durability in concrete structures by exposure to simulated concrete pore water solution at hightemperature. These tests are typically performed in an alkaline environment which is different from thatpresent in field structures while monitoring the performance of existing projects would give a realindication of GFRP durability. The main objective of this research is to monitor the performance of GFRPbars after 15 years of service as concrete reinforcement in a bridge deck.Sierrita de la Cruz Creek Bridge located 25 miles northwest of Amarillo, Texas was built in 2000 toreplace the original bridge that was structurally deficient, having extensive damage caused by thecorrosion of steel reinforcement. It was the first bridge in the state of Texas that implemented GFRP asprimary concrete reinforcement and operates under the following environmental conditions: thermalrange of 22 to 95 F (-6 to 35 C), wet and dry cycles, freeze-thaw cycles and exposure to de-icing salt.GFRP reinforcement was implemented at the top mat in two spans of the concrete deck. Technicalpersonnel performed the extraction of concrete cores in May 2015.The pH and carbonation depth measurements were conducted on concrete cores to characterize theconcrete environment. Microscopic examination and mechanical tests including scanning electronmicroscopy (SEM), energy dispersive X-ray spectroscopy (EDS), inter-laminar shear, glass transitiontemperature (Tg) and fiber content were performed on GFRP coupons to monitor possible changes inmicrostructure and mechanical properties. The results of the inter-laminar shear test and fiber contentmeasurement were compared with results of similar tests performed in 2000 at the time of construction.Since no historic data was available for EDS and Tg analysis, these tests were performed on GFRP barsproduced in 2015 from the same manufacturer to serve as a benchmark for comparison.This study confirms that GFRP materials maintained their microstructural integrity and mechanicalproperties after 15 years of service in field application. Microscopic examination did not show any GFRPdegradation. Fibers did not lose any cross-sectional areas, the matrix was intact and no damage wasobserved at fiber-matrix interface. Additionally, concrete-GFRP interface was maintained properly and nointerfacial bond loss was observed.III
ACKNOWLEDGMENTSThe authors gratefully acknowledge: a) the University Transportation Center “Research onConcrete; Applications for Sustainable Transportation (RE-CAST)” under grant US DOT,DTRT13-G-UTC45; b) the National Science Foundation (NSF) and its industrial members forthe support provided to the Industry/University Center for Integration of Composites intoInfrastructure (CICI) under grant NSF IIP-1439543; c) Hughes Brothers Inc. for their opennessin describing past and present production processes, resin formulations and assistance in fieldextraction; and, d) the Texas Department of Transportation Amarillo District for allowing theextraction of samples from their bridge and for providing the traffic control that kept thetechnicians safe during the coring operations.Findings and opinions expressed herein, however, are those of the authors alone and do notnecessarily reflect the views of the sponsors.IV
TABLE OF CONTENTSTABLE OF CONTENTS . VLIST OF FIGURES . VILIST OF TABLES . VII1 INTRODUCTION . 12 FIELD STRUCTURE . 23 SAMPLE EXTRACTION . 44 GFRP SAMPLE PREPARATION AT UM . 65 CONCRETE TEST RESULTS . 75.1pH.75.2Carbonation Depth .86 GFRP TEST RESULTS . 86.1Scanning Electron Microscopy (SEM) .86.2Energy Dispersive X-Ray Spectroscopy (EDS) .106.3Interlaminar Shear Strength .136.4Glass Transition Temperature (Tg) .156.5Fiber Content .167 CONCLUSIONS. 178 RECOMMENDATION FOR FUTURE WORKS . 179 REFERENCES . 18APPENDIX 1 . 20APPENDIX 2 . 23APPENDIX 3 . 25APPENDIX 4 . 26V
LIST OF FIGURESFigure 1: Sierrita de la Cruz Creek Bridge, Amarillo, Texas . 2Figure 2: Sierrita de la Cruz Creek Bridge drawings . 3Figure 3: A set of three GFRP witness bars in an overhang [7] . 4Figure 4: Concrete core extraction from the bridge deck . 5Figure 5: GFRP bars viewed from a cored section (left) and a close-up view of the GFRP barimplemented in transverse direction (right) . 5Figure 6: Five extracted concrete cores with the GFRP bars. 6Figure 7: GFRP extraction from the concrete cores . 6Figure 8: Prepared samples prior to SEM analysis: GFRP (left) and concrete-GFRP (right) . 7Figure 9: Concrete pH measurement: ground concrete from extracted cores (left) and pHevaluation using the pH strip (right) . 7Figure 10: Carbonation depth measurement of the concrete cores . 8Figure 11: SEM images of the fibers at magnification levels of 300x (left) and 1400x (right) . 9Figure 12: Crack at the edge of the bar at magnification levels of 40x (left) and 850x (right) . 9Figure 13: SEM image of a single glass fiber at magnification of 3500x . 9Figure 14: SEM images of the concrete-GFRP interface at magnification levels of 27x (left) and50x (right) . 10Figure 15: Result of the EDS analysis performed on GFRP bars after 15-years of service . 10Figure 16: Result of the EDS analysis performed on control GFRP samples . 11Figure 17: Elemental scatter in GFRP bars after 15 years of service at magnification level of300x: SEM image of GFRP (a) and elemental distributions of: Ca (b), Si (c), Al (d), C (e),and O (f) . 12Figure 18: Elemental scatter in GFRP bars after 15 years of service in magnification level of1800x: SEM image of GFRP (a) and elemental distributions of Ca (b), Si (c), Al (d), C (e),and O (f) . 13Figure 19: No. 6 (left) and No. 5 (right) GFRP bars tested for horizontal shear strength . 14Figure 20: Interlaminar horizontal shear test of GFRP coupons after 15 years of service: No. 5(left) and No. 6 (right) GFRP bars . 14VI
LIST OF TABLESTable 1: Constituents of GFRP bars produced in 2000 and 2015 [5] . 2Table 2: Results of the horizontal shear test on GFRP coupons . 15Table 3: Result of Tg measurement . 16Table 4: Result of fiber content measurement . 16VII
1INTRODUCTIONThe use of glass fiber reinforced polymer (GFRP) bars as flexural and shear reinforcements ofconcrete members is rapidly increasing due to corrosion resistance, electromagnetic transparencyand high strength to weight ratio offered by these composite materials [1]. While various aspectsof GFRP structural behavior are still investigated, confirmation of its long-term durability isperhaps the most critical barrier to widespread acceptance in field applications. Other barriersinclude: 1) resistance by practicing bridge engineers to accept new materials, especially nonductile reinforcement; 2) concern about how to widen or repair GFRP reinforced concrete bridgedecks; and, 3) initial cost when compared to steel reinforcement.Accelerated laboratory tests are used to investigate the GFRP durability in concrete structuresby exposure to simulated concrete pore water solution at high temperature. These tests aretypically performed in an alkaline environment which is different from that presents in fieldstructures [2]. Monitoring the performance of existing projects would give a real indication ofGFRP durability; however, there has been only a few studies of this type [3, 4]. In order tocontribute to existing literature, the main objective of this research is to monitor the performanceof GFRP bars after 15 years of service as concrete reinforcement in a bridge deck. First, pH andcarbonation depth measurements were conducted on concrete cores to characterize the concreteenvironment. Next, microscopic examination and mechanical tests including scanning electronmicroscopy (SEM), energy dispersive X-ray spectroscopy (EDS), inter-laminar shear, glasstransition temperature (Tg) and fiber content were performed on GFRP coupons to monitorpossible changes in microstructure and mechanical properties. The results of the inter-laminarshear test and fiber content measurement were compared with results of similar tests performedin 2000 at the time of construction. Since no historic data was available for EDS and Tg analysis,these tests were performed on GFRP bars produced in 2015 from the same manufacturer to serveas a benchmark for comparison.The bars in this evaluation were the Aslan 100 series manufactured by Hughes Brothers, Inc.of Seward NE. Hughes Brothers maintained thorough documentation of the original productionlot quality control testing and provided the details of the production process and formulationsfrom the time the bridge was constructed. In 2000, the bars were made of the E-glass fibers whileE-CR glass fibers were used in GFRP bars produced in 2015. Vinyl ester resin was used inGFRP bars produced both in 2000 and 2015. The resin formulation was slightly different forlarger bar diameter produced in 2000, to help mitigate plastic thermal cracking during fastcuring. Table 1 provides the fiber type, resin formulation and the detailed catalysts/additivesused in the production of GFRP bars.1
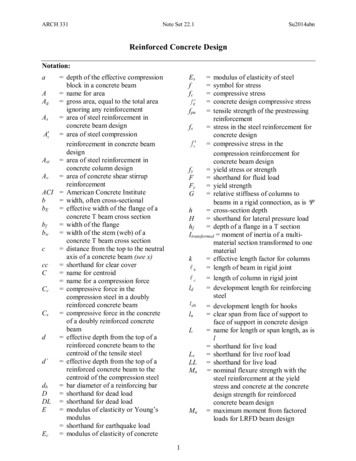
Diameter(in)Table 1: Constituents of GFRP bars produced in 2000 and 2015 [5]Year ofResinAdditive sterE- glass6/85/82015VinylEsterE-CRglassAshland Hetron 922(90%), 8722 (10%)Ashland Hetron 922(70%), 8722 (30%)VEX 10-962CoRezynCatalystStyrene,ASP 400,BYK A555 &Fumed silicaP16 &TBPBStyrene &ASP 400BPONote: 1 in 25.4 mm2FIELD STRUCTURESierrita de la Cruz Creek Bridge located 25 miles northwest of Amarillo, Texas (Figure 1)was built in 2000 to replace the original bridge that was structurally deficient, having extensivedamage caused by corrosion of the steel reinforcement. It was the first bridge in the state ofTexas that implemented GFRP as primary concrete reinforcement. This bridge consists of sevenspans, 24.079 m (79.0 ft.) long and 13.800 m (45.3 ft.) wide supported by six pre-stressed (PC)Texas type “C” concrete I-beams. A plan view of the bridge is shown in Figure 2-a.The bridge operates under the following environmental conditions: thermal range of 22 to 95 F (-6 to 35 C), wet and dry cycles, freeze-thaw cycles with the annual average frequency of30% [6] and exposure to de-icing salt. Appendix 1 provides photos of the bridge duringconstruction.Figure 1: Sierrita de la Cruz Creek Bridge, Amarillo, Texas2
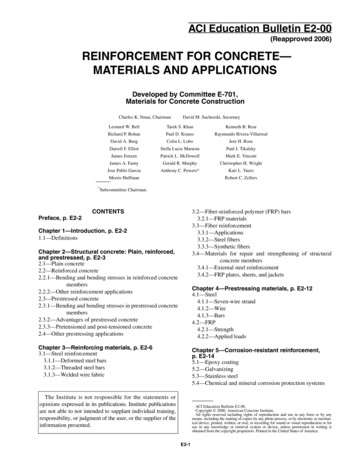
a) Plan view (All the dimensions are in meter) [7]b) GFRP bridge deck plans - transverse section (through slab overhang) [8]Figure 2: Sierrita de la Cruz Creek Bridge drawingsGFRP reinforcement was used in the top mat of two spans of the concrete deck (span 6 and 7)while prestressed precast concrete panels reinforced with epoxy coated steel (ECS) rebars, inaddition to the uncoated prestressing strands, constituted the bottom half of the concrete deck ofthese two spans. Furthermore, ECS rebars were used in the bottom of the full depth portion ofthe deck between construction phases and in the two deck overhangs. The other five spans werereinforced entirely with ECS rebars in the top mat and the same mix of panels and ECS rebar inthe bottom mat as spans 6 and 7. The GFRP-RC spans were reinforced with top mat GFRP barshaving nominal diameters of 5/8 in (16 mm) and 6/8 in (19 mm). GFRP bars were made of Eglass fibers and vinyl ester resin with the nominal fiber content of 70% by volume. The surfaceof the bars was sand coated and helically fiber wrapped to provide the additional mechanicalbond to surrounding concrete. No. 5 bars were placed in the longitudinal direction with thespacing of 225 mm (9 in) and No. 6 bars were placed in the transverse direction with the spacingof 140 mm (5.5 in). Figure 2-b shows a part transverse section illustrating the placement of theprecast concrete “sub-deck” panels, the ECS bars in the deck overhangs, the top GFRP bars and3
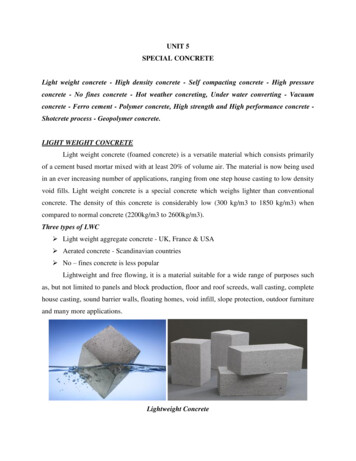
the ECS bars, designated “OM”, to be placed only at the Engineer’s direction. Bars OM wereprovided in the plans due to uncertainty regarding the performance of the GFRP reinforcedconcrete deck overhang in a vehicle impact event. The deck overhang was tested beforeconstruction of the bridge, by pendulum impact of a segment of bridge rail and deck overhang,and exhibited adequate performance to eliminate the need for bars OM.Additionally, during bridge deck construction, twelve sets of 2 ft. (609.6 mm) long witnessbars were installed at three different locations (overhang, mid-span and control joints) of fourspans (1, 2, 6, and 7). Each set included three samples, one of each rebar type (i.e., black steel,ECS, and GFRP). The bars were intended to be extracted at undefined intervals of time duringthe service life of the structure to monitor and compare the long-term performance of thesereinforcements. Fifteen years just happened to be the age when the cores for this project weretaken. Figure 3 shows a set of GFRP witness bars in the overhang of span 2 [7].Figure 3: A set of three GFRP witness bars in an overhang [7]3SAMPLE EXTRACTIONTechnical personnel performed the extraction of concrete cores in May 2015 (Figure 4). Atotal of nine 4 in (101.6 mm) diameter concrete cores were extracted from various locations onthe bridge deck to include GFRP (5 cores), ECS (3 cores) and black steel rebars (1 core). Theholes from sample extraction were repaired using a fast-curing cementitious grout.4
Figure 4: Concrete core extraction from the bridge deckA cored section that included GFRP bars in both longitudinal and transverse direction isshown in Figure 5.Figure 5: GFRP bars viewed from a cored section (left) and a close-up view of the GFRP bar implemented intransverse direction (right)The concrete cores were labeled and shipped to three different laboratories in University ofMiami (UM), Missouri University of Science and Technology (S&T) and Owens Corning (OC).In this report, only the results of the tests performed on extracted GFRP bars are presented.Figure 6 shows the five concrete cores that included GFRP bars. Additional images are providedin Appendix 1.5
Figure 6: Five extracted concrete cores with the GFRP bars4GFRP SAMPLE PREPARATION AT UMGFRP coupons were extracted from core C and D as presented in Figure 7 and were sliced toan approximate width of 0.27 in (7 mm) using a diamond saw for microscopic examination.Figure 7: GFRP extraction from the concrete coresThe specimen surface was prepared by sanding using different grit levels (i.e., 180, 300, 600and 1200) of sand paper and employing dedicated grinding and polishing equipment. Finepolishing completed the specimen preparation using a wet-polishing agent and polycrystallinediamond paste. Prior to imaging, specimens were placed in an oven at 140 F (60 C) for 24hours to remove moisture produced during polishing. Samples were properly cleaned using anair-blower which also saved the SEM chamber from being contaminated. Additionally, aconcrete sample was prepared following the mentioned procedure to monitor the concrete-GFRPinterface. Since GFRP is a non-conductive material, an ion sputtering device was used to coat thesamples with gold prior to SEM examination as shown in Figure 8. The specimens used in SEMimaging were also employed in EDS analysis.6
Figure 8: Prepared samples prior to SEM analysis: GFRP (left) and concrete-GFRP (right)Two GFRP coupons were used for the interlaminar shear test as extracted. Coupons were 3 in(76.2 mm) and 4 in (101.6 mm) long, respectively, for No. 5 and No. 6 GFRP bars. After theshear test, the coupons were cut in appropriate sizes for Tg measurements. Finally, the samesamples were used to determine the fiber content of the GFRP bars.5CONCRETE TEST RESULTS5.1 pHThe pH measurement was performed to provide a qualitative estimate of concrete alkalinity.In this study, the pH measurement approach proposed by Grubb and coworkers [9] was followedsince this method provides a more precise assessment compared to the method of ASTM F71011 [10] which typically underestimates the pH due to excessive wetting of the concrete surface.First, the concrete surface was ground using sand paper and diluted in distilled water with 1:1ratio. Then, the pH strip was used to evaluate the alkalinity of the solution (Figure 9). pH valuesbetween 11 and 12 were measured for the concrete cores which are in agreement with expectedvalues [9]. The procedure was performed in three different locations of the core and consistentresults were obtained.Figure 9: Concrete pH measurement: ground concrete from extracted cores (left) and pH evaluation usingthe pH strip (right)7
5.2Carbonation DepthAs a result of the carbonation, the initial high pH value of the cement paste drops to valuesbelow 9, forming a low pH layer of concrete at the surface. Different factors affect thecarbonation rate including the mix design, cement chemical composition, concrete porosity,temperature, CO2 concentration, relative humidity and existing cracks [11]. It is assumed that thecorrosion of carbon steel reinforcement starts when the carbonation depth equals the concretecover.The carbonation depth was measured by spraying the 1% solution of phenolphthalein in 70%ethyl alcohol on freshly fractured concrete surfaces [12]. The colorless solution turned topink/purple when the pH was higher than 9 and stayed colorless otherwise. Figure 10 showsextracted concrete samples where the concrete surface was chipped off at the edge and sprayedwith the phenolphthalein solution.Figure 10: Carbonation depth measurement of the concrete coresIrregular carbonation fronts were observed in all three tested samples with maximum depthbetween 1 to 1.25 in (25.4 to 31.8 mm). The carbonation depth was an approximate rangesufficient to start the corrosion in carbon steel rebars.6GFRP TEST RESULTS6.1Scanning Electron Microscopy (SEM)The full cross-sections of three samples were scanned at different levels of magnification andimages were taken at random locations (Figure 11 and 12). More attention was paid to the areasin the vicinity of the bar edges since possible degradation due to chemical attack starts at GFRPconcrete interface. The image of a single fiber is shown in Figure 13. Additional images areavailable in Appendix 2.8
Figure 11: SEM images of the fibers at magnification levels of 300x (left) and 1400x (right)Figure 12: Crack at the edge of the bar at magnification levels of 40x (left) and 850x (right)Figure 13: SEM image of a single glass fiber at magnification of 3500xSEM analysis confirmed that there was no sign of deterioration in the GFRP coupons. Glassfibers were intact without loss of any cross-sectional areas. Fibers were surrounded by the resinmatrix and no gap nor sign indicating the loss of bond between resin and fibers, was observed.9
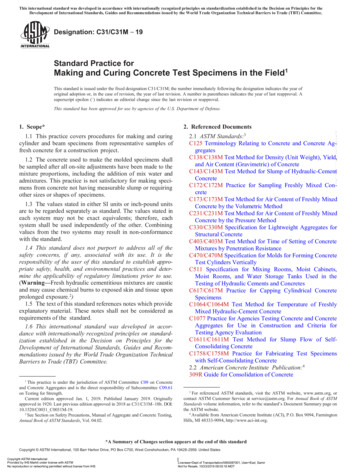
Additionally, GFRP to concrete interfacial bond was maintained properly and no sign of bonddegradation nor loss of contact was observed as presented in Figure 14. The visible interfacialdamage may be the result of sample preparation and drying in the SEM chamber [4].Figure 14: SEM images of the concrete-GFRP interface at magnification levels of 27x (left) and 50x (right)6.2 Energy Dispersive X-Ray Spectroscopy (EDS)EDS was performed at seven selected locations with a focus on the edge of the bar to identifyexisting chemical elements in GFRP bars. The results were compared with pristine samplesproduced in 2015 from the same manufacturer. The results are shown in Figure 15 and 16 wherethe vertical axis corresponds to the counts (number of X-rays received and processed by thedetector) and the horizontal axis presents the energy level of those counts.Figure 15: Result of the EDS analysis performed on GFRP bars after 15-years of service10
Figure 16: Result of the EDS analysis performed on control GFRP samplesSi, Al, Ca (from glass fibers) and C (from the matrix) were the predominant chemicalelements in the extracted samples which were also identical to the control samples. Although,there is a variation in fiber/resin constituents for GFRP bars produced in 2015 compared to theones manufactured in 2000 (as provided in Table 1), the only difference in detected elements wasthe presence of Mg in control samples which was not found in extracted ones. Additionally, thepresence of Na in the extracted samples was not a sign of degradation or alkaline attack since Nawas observed in both control and extracted samples. It may be due to contamination duringsample preparation.Backscattered electron images are provided at different magnification levels to displaycompositional contrast of existing chemical elements and their distribution in fibers and resinmatrix. The images were taken at the edge of the GFRP bars and results are shown in Figure 17and 18.11
Figure 17: Elemental scatter in GFRP bars after 15 years of service at magnification level of 300x: SEMimage of GFRP (a) and elemental distributions of: Ca (b), Si (c), Al (d), C (e), and O (f)12
Figure 18: Elemental scatter in GFRP bars after 15 years of service in magnification level of 1800x: SEMimage of GFRP (a) and elemental distributions of Ca (b), Si (c), Al (d), C (e), and O (f)Comparing the result of EDS analysis performed on the in-servic
GFRP reinforcement was implemented at the top mat in two spans of the concrete deck. Technical personnel performed the extraction of concrete cores in May 2015. The pH and carbonation depth measurements were conducted on concrete cores to characterize the concrete environment. Microscopic examination and mechanical tests including scanning electron