Transcription
6Integrated Multitrophic Aquaculture:Filter Feeders Bivalves as Efficient Reducersof Wastes Derived from Coastal AquacultureAssessed with Stable Isotope AnalysesSalud Deudero1, Ariadna Tor1, Carme Alomar1,José Maria Valencia2, Piluca Sarriera1 and Andreu Blanco31CentroOceanográfico de Baleares, Instituto Español de Oceanografia, Palma2Laboratorio de Investigaciones Marinas y Acuicultura, Andratx3Instituto de Investigaciones Marinas de Vigo, CSIC, VigoSpain1. IntroductionAquaculture industry has rapidly increased from 20 million tons in the 1990s to 68.4 milliontons in 2008, overcoming the 67.0 million tons of extractive fisheries, with an approximatedglobal value of 84,791 million Euros (FAO, 2010). The Mediterranean Sea is an importantproducer of intensive open water fish culture, especially important are industries fromSpain, France, Italy and Greece, which generated 2,133 million Euros in 2008 (FAO, 2008).Parallel to aquaculture industry development, knowledge of its effects on the surroundingenvironment is increasing. Several studies have been conducted to assess the environmentalimpact (Holmer et al., 2008; Yokoyama et al., 2006; Vizzini & Mazzola, 2004) due toaquaculture. Organic enrichment is recognized as the most important problem associated tomarine aquaculture (Mirto et al., 2010; Troell et al., 2003) as a direct result of the release ofdissolved and particulate nutrient loads, especially organic phosphorous and nitrogen in theform of ammonia that might easily induce eutrophication (Karakassis et al., 2000). Uneatenpellet and fresh food supplied at fish cages, together with the excretion products fromcultured fishes are the source of the nutrient loads released (Cheshuk et al., 2003).Whereas the dissolved compounds are easily dispersed and diluted in the water column, theparticulate compounds sink to the sea floor, causing severe modifications of the physicaland chemical characteristics of the sediment and the community dynamics of marineseagrass and benthic fauna (Brown et al., 1987; Karakassis et al., 2000; Mente et al., 2006).The severity and extend of the environmental impact depends on a large number of factors,such as local hydrodynamics, water depth and total output from fish farms. Nevertheless, ithas been detected organic enrichment in the sediment up to 1000 m from fish cages (Sarà etal., 2004).The effects of the organic enrichment are widely studied in the Atlantic and the PacificOcean, especially in relation to the salmon industry (Brown et al., 1987; Cheshuk et al., 2003;www.intechopen.com
104Aquaculture and the Environment - A Shared DestinyWeston, 1991), however, knowledge of fish farming impacts in the Mediterranean Sea isscarce (Sarà et al., 2004, 2006; Vizzini & Mazzola, 2004), which have different hydrographiccharacteristics, such as shallow waters and low current velocity areas, and are characterizedby oligotrophic waters.1.1 Integrated multitrophic aquacultureThe growing concern on aquaculture’s environmental impact has led to an increasingresearch into feed formulations and digestibility, better conversion efficiency and improvedmanagement (Skalli et al., 2004; Troell et al., 2003). Since the last decade, the emphasis hasbeen placed on the practice of integrated multi-trophic aquaculture (IMTA), with a potentialto mitigate some of the environmental problems associated with mono-specific aquaculture(Soto et al., 2008). Originally used in freshwater practices, it involves the culture of two ormore species from different trophic level; generally finfish being simultaneously culturedwith both organic and inorganic extractive species, such as shellfish and seaweeds,respectively; in which by-products from one species are recycled to become inputs foranother. Thus, the organic matter released in aquaculture systems might represent a sourceof available food for filter-feeding organisms, such as bivalves, reducing its impact on theenvironment (Shpigel et al., 1991) and can represent a potential economic income.Filter feeders bivalves are essentially generalist consumers, and it has been demonstratedthat they can exploit organic matter from several sources (autochthonous, allochthonous oranthropogenic), as a function of its availability (Stirling & Okumus, 1995). In a conceptualopen water integrated aquaculture, filter feeder bivalves are cultured adjacent to fishfloating cages, reducing nutrient loadings by filtering and assimilating particulate wastes(uneaten food and faeces) as well as phytoplankton. In this way, bivalves would perform asbiological filters. Previous studies have determined that bivalves can be successfullyincorporated into integrated multitrophic aquaculture systems, based on the increasedgrowth displayed and the feeding efficiency on pellet feed and fecal products (Mazzola &Sarà, 2001; Reid et al., 2010).1.2 Stable isotopes as tracers of matter fluxesThe use of stable isotopes in biogeochemistry and marine ecosystem analysis is increasingrapidly, especially in assessing trophic relationships and pathways of energy flow in foodwebs (Bergamino et al., 2011). Traditionally, the origin and fate of organic matter in themarine environment have been investigated through different approaches, such as lipidbiomarkers or chlorophyll pigments. In filter feeder bivalves, it has been evaluated with gutcontent or fatty acid analyses, representing an instant snapshot of food ingested by bivalves.This limitation could be solved using stable isotope analyses, as the evaluation of foodsources is based on assimilated instead of ingested food, which represents a time-integratedfood utilization.Stable isotope analysis is based on the assimilation of 13C and 15N from sources, with aslight enrichment of heavier isotopes (13C and 15N) as lighter isotopes (12C and 14N) areused in metabolism. The enrichment between prey and consumer tissues has beenconsidered to be consistent across species, however, it has been demonstrated that itdepends on the assimilation process and it has been set at 1‰ for 13C and 3-4‰ for 15Nwww.intechopen.com
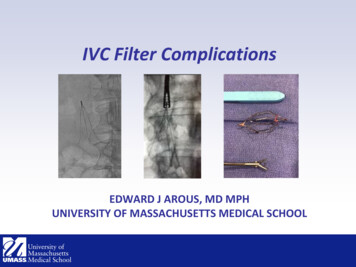
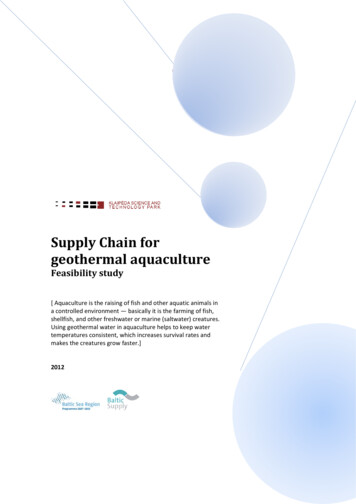
Integrated Multitrophic Aquaculture: Filter Feeders Bivalves as Efficient Reducersof Wastes Derived from Coastal Aquaculture Assessed with Stable Isotope Analyses105(De Niro & Epstein, 1978; McCutchan et al., 2003). Since the ratio of 12C/13C isotopeschanges little through the food web, this ratio is commonly used to distinguish betweencarbon sources, typically C3 or C4 and pelagic or benthic. In contrast, consumers showed alarge amount of enrichment in nitrogen, thus, the 14N/15N ratio is commonly used toestimate trophic positions. Integrated multitrophic aquaculture involves species withdifferent trophic strategies which can be positioned in the food web as a function of the13C and 15N stable isotope signatures.1.3 ObjectivesTo decipher whether integrated multitrophic aquaculture is an effective method forminimizing and reducing waste inputs into the Mediterranean coastal ecosystem we havedesigned a multitrophic integrated system involving filter feeders bivalves (galloprovincialis(Lamarck, 1819) and Chlamys varia (Linnaeus, 1758)), and fin fish Argyrosomus regius (Asso,1801). Through determination of carbon and nitrogen stable isotopes analyses to the severalorganisms and trophic strategies, the following aims will be accomplished:i.Define the isotopic composition of the trophic food web of integrated multitrophicaquaculture in relation to two reference stationsii. Study the temporal variability in waste matter fluxes at the different treatments, henceannual and seasonal variabilityiii. Calculate the relative contributions of wastes (fresh food, pellets, plankton) to the fishfarmed and to the filter feeders at the IMTA2. Methods2.1 Experimental design for IMTAThe study was conducted during years 2008, 2009 and 2010 at a research experimentalstation (LIMIA), on the SW coast of Mallorca, in Andratx Bay (39º 32’ 38.13” N, 2º 22’ 51.08”E) (Figure 1). The installations included 6 floating cages for fish reproductive stages in themiddle of the bay, with cultured Argyrosomus regius, with a total fish stock of 12-15 t year -1.Water depth ranged between 5 to 8 meters. Sediments surrounding fish cages were mostlyunvegetated, except for disperse patches of Caulerpa prolifera (Forsskal) J.V.Lamouroux, 1809within tens of meters distance. Current velocity below fish cages varied between 0 to 10cm/s, with higher prevalence of very low current speeds (0 to 5 cm/s) (own data). Feedregime consisted in a combination of commercial dry pellets, CV4, Mar-9 vitalis repro andGemma (Trouw S.A), hereafter called pellet 1, pellet 2 and pellet 3, respectively; and freshfood based on fishes Sardina pilchardus (Walbaum, 1792) (34.48 %), Spicara smaris (Linnaeus,1758) (24.14 %), Trachurus trachurus (Linnaeus, 1758) (31.03 %) and squid Loligo vulgarisLamarck, 1798 (10.34 %) on average ten times per month, with 10kg supplied each time.Two reference sites were selected to evaluate the effects of aquaculture wastes in the adjacentenvironment. An external site (control 1) (39º 32’ 29.37” N, 2º 22’ 56.45” E) locatedapproximately 350 m away from the fish cages within the Andratx Bay, was selected to studythe influence of the natural variability in the bay. The second site, (control 2) was located 21nautical miles away from fish cages (39º 28’ 4” N, 2º 42’ 53” E) in order to compare the isotopicvalues of the different components of the food web without the fish farm influence.www.intechopen.com
106Aquaculture and the Environment - A Shared DestinyFig. 1. Map of the SW coast of Mallorca. Solid circles indicate sampling sites (Cage: cage site,C1: control 1, C2: control 2).Filter feeder bivalves Mytilus galloprovincialis and Chlamys varia were chosen for this study asthey are native to the region, fast growing and commercially viable. They were collectedfrom the harbor area in Andratx Bay between April and July 2007 and transferred topolyethylene plastic bags (0.70 x 0.40 m and 0.009 m mesh diameter) with a density of 250Mytilus galloprovincialis/bag (size between 44 and 72 mm) and 100 Chlamys varia/bag (sizebetween 19 to 42 mm). Forty plastic bags were placed hanging on fish cages, and the sameamount was simultaneously attached to the rope buoys in control 1 and control 2.2.2 Sampling and data collection2.2.1 Cage siteIn the experimental site (hereafter called cage site), approximately 10 adult specimens ofArgyrosomus regius, and 6 samples of Mytilus galloprovincialis and Chlamys varia (Linnaeus,1758) were sampled seasonally. Additionally, potential food sources derived from aquaculturewastes as fish faeces and pellet and fresh food were sampled; as well as the other componentsof the marine food web, phytoplankton, zooplankton, particulate organic matter (POM) andsedimentary organic matter (SOM). Moreover, 5 sedimentivorous echinoderms Holothuriaforskalii Delle Chiaje, 1823 were also collected.Fish faeces were collected using pipettes after transferring adult Argyrosomus regius in aconical tank for an overnight evacuation. Individuals were then sacrificed in order to extractthe muscle tissue from the left side of the posterior region to the dorsal fin using stainlesssteel tools, then, samples were cleaned thoroughly and rinsed with distilled water.Phytoplankton and zooplankton samples were collected using a plankton net (100 μm meshsize, 30 cm diameter) and a WP2 plankton net for zooplankton (250 μm mesh size, 45 cmdiameter), respectively, which were towed through the water subsurface for 15 minutes at avelocity of 2 knots.www.intechopen.com
Integrated Multitrophic Aquaculture: Filter Feeders Bivalves as Efficient Reducersof Wastes Derived from Coastal Aquaculture Assessed with Stable Isotope Analyses107Particulate organic matter, was sampled by vacuum filtering 10 L of seawater, collectedusing a 5 L Niskin bottle (General Oceanic, USA), through a pre-combusted (450ºC, 4 hours)Whatman GF/F glass microfiber filter, 1 m above the floating cages while in control sites, itwas collected at the same depth as the filter feeders bivalves polyethylene bags.Sedimentary organic matter was collected by SCUBA divers from a quadrant surface (400cm2) using hand cores.2.2.2 Control sitesSimilarly, in control sites, 6 specimens of filter feeder bivalves Mytilus galloprovincialis andChlamys varia were sampled. In control 1, Chlamys varia could not be sampled since thepolyethylene bags were lost after severe storm periods. Moreover, phytoplankton,zooplankton, particulate organic matter (POM) and sedimentary organic matter (SOM) weresampled seasonally and 5 samples of sedimentivorous echinoderms Holothuria forskalii weresampled annually following the same procedure as in cage site (Table 1). All samples werefrozen immediately after sampling and kept at -20ºC till further processing.2.3 Stable isotope analysesSamples were dried in an oven at 60ºC for 24h and subsequently grounded to a fine powderusing a mortar and pestle. A minimum of two replicates for each sample was analyzed forδ13C and δ15N isotopic signatures, except for commercial dry pellet feed which had a stableand controlled composition (Trouw S.A). SOM samples for δ13C isotopic analysis wereacidified by adding 2N HCl (Carabel et al., 2006), while for δ15N analysis, non- acidifiedreplicates were used. From each sample 2 0.1 mg of dry weight was placed in tin cups todetermine the stable isotope ratios of carbon and nitrogen. The analyses were run at theSCTI (Scientific-Technical Services) from the Balearic Islands’ University using a continuousflow mass spectrometer (Thermo Finnegan Delta x-plus). Reference standards were ViennePee Dee Belemnite (VPDB) for C and atmospheric nitrogen for N. One sample of an internalreference, Bovine Liver Standard (1577b) (U.S. Department of Commerce, National Instituteof Standards and Technology, Gaithersburg, MD 20899), was analyzed every eight samplesin order to calibrate the system and compensate the drift over time. The analytical precisionof the stable isotope analyses was based on the standard deviation of the BSL samples; thesedeviations were 0.08 ‰ for δ13C and 0.09 ‰ for δ15N. Isotope ratios were expressed in δ13Cand δ15N, with units of ‰, according to the following equation:δ13C or δ15N [(R sample/ R reference) – 1] x 1000Where R is the corresponding 13C/12C or 15N/14N ratio.2.3.1 Statistical analysesA distance-based permutational analysis of variance (PERMANOVA) on 999 permutationswas employed to test the hypothesis that there were no differences in the isotopic signature(δ13C and δ15N) of filter feeders bivalves between treatments and sampling periods. The factorsTreatment (with three levels: cage, control 1 and control 2), Year (with three levels: 2008,2009 and 2010) and Season nested in Year (with three factors: spring, summer andautumn) were treated as fixed. Additionally, a distance-based test for homogeneity ofwww.intechopen.com
108SampleAquaculture and the Environment - A Shared DestinyTreatment200820092010xxxPerodicityFin FishArgyrosomus regiusFilter feedersMytilus s galloprovincialiscontrol 1xxxSeasonalMytilus galloprovincialiscontrol 2xxxSeasonalChlamys variacagexxxSeasonalChlamys variacontrol 1–––SeasonalChlamys variacontrol 2–xxSeasonalHolothuria forskaliicage–xxAnualHolothuria forskaliicontrol 1–xxAnualHolothuria forskaliicontrol nualAnualSedimentivorousFood sourcesPellet foodPellet 1 (CV4)Pellet 2 (Mar-9 vitalis repro)Pellet 3 (Gemma)Fresh foodLoligo vulgariscagexx–SeasonalSardina pilcharduscagexx–SeasonalSpicara smariscagexx–SeasonalTrachurus trachuruscagexx–Seasonalcagecontrol 1control 2cagecontrol 1control 2cagecontrol 1control 2cagecontrol 1control easonalSeasonalSeasonalSeasonalSeasonalOrganic matter le 1. List of samples collected during the three years of the study in each location with itsperiodicity. (X: sample collected and -: sample not collected).www.intechopen.com
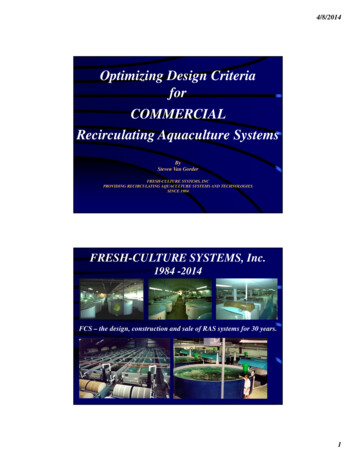
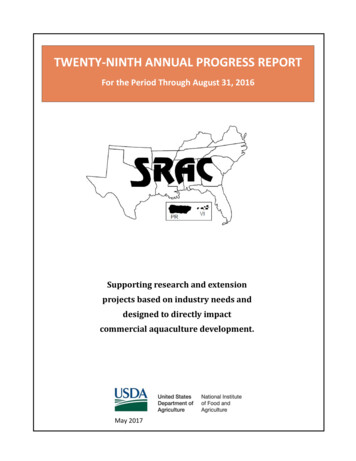
Integrated Multitrophic Aquaculture: Filter Feeders Bivalves as Efficient Reducersof Wastes Derived from Coastal Aquaculture Assessed with Stable Isotope Analyses109dispersions (PERMDISP) was used to analyze the multivariate dispersion for each treatmentat all sampling sites. All statistical computations were performed using the statisticalpackage PRIMER 6.0 software. The permutational analysis (PERMANOVA) was notperformed on δ13C and δ15N sediment data in years 2009 and 2010 because, as aconsequence of the low carbon and nitrogen content in the samples, some replicates did notreach the mass requirements and could not be analyzed in the mass spectrometer.2.3.2 Partial contributions of aquaculture wastes at the studied food websStable isotope mixing models are an increasingly common approach in environmental sciences.They are used to determine the proportional contribution of sources to a mixture based on theirrespective isotope signatures (Phillips & Gregg, 2001). Amongst its application we can find theestimation of the relative importance of food sources to animal diets, pollution sources to air orwater bodies and carbon sources to soil organic matter (Michener & Lajtha, 2007).In this study, we applied the SISUS Bayesian Mixing model (Stable Isotope Sourcing usingSampling) to quantify the feasible contributions of the potential organic matter sources(phytoplankton, zooplankton, POM, faecal material, pellet and fresh food) to the filterfeeders bivalves’ diet, based on the analyzed stable isotope ratios. Considering the specificisotope enrichment between prey and consumer tissues, a discrimination of 0.3 ‰ forcarbon was assumed for POM and filter feeders bivalves; while for muscle tissue samples ofArgyrosomus regius a 1.3 ‰ was applied. Previous studies have shown that trophicfractionation is much larger for δ15N than for δ13C, so a correction of 2.3 ‰ per trophic levelwas applied (McCutchan et al., 2003).The model is based on a modification of the Isosource programme (Phillips & Gregg, 2001),which creates every possible combination of source proportions and compares thesepredicted mixtures signatures with the observed mixtures signatures. If they are equal orwithin some small tolerance range, this combination represents a feasible solution. TheSISUS software is available for public use at http://statacumen.com/sisus/.3. Results3.1 Isotopic composition of the marine food web components at IMTAThe carbon and nitrogen isotopic composition of the marine food components analyzed inthe three years of study in cage and control sites are summarized in Figures 2, 3 and 4.3.1.1 Potential organic matter sources and environmental elementsCommercial pellet food supplied in the fish farm had similar isotopic values of δ13C(between -20.78 ‰ to -21.87 ‰), with an average value of -21.17 0.09 ‰; however, theydiffered greatly in δ15N values (between 14.93 ‰ and 6.20 ‰), with pellet 2 being the mostenriched source in 15N, in contrast to pellet 1 which was the most depleted nitrogen source.Fresh food were 13C- enriched compared to pellet food, on average 2 ‰ ( mean -19.1 0.19‰), in contrast, δ15N values were relatively similar. Considering all individual sources, freshfood sources had similar values of δ13C (between -18.82 ‰ to -19.19 ‰), but they showeddifferences in δ15N values, ranging between 7.92 ‰ to 12.46 ‰, with Loligo vulgaris as themost enriched source in 15N and Spicara smaris the most depleted.www.intechopen.com
110Aquaculture and the Environment - A Shared DestinyCage16A. regiusP214Pellet foodFresh foodL12ZP FPδ 15 N10LP3H. forskaliiPPTT S8SP6P1POMFilter feeders42SOM0-23-22-21-20-19-18δ 13 C-17-16-15-14-13Fig. 2. Mean δ13C and δ15N values of samples in the cage site in years 2008 ( ), 2009 ( ) and2010 ( ). ZP: zooplankton; PP: phytoplankton; FP: Argyrosomus regius fish faeces; S: Sardinapilchardus; SP: Spicara smaris, T: Trachurus trachurus; L: Loligo vulgaris; P1: pellet 1; P2: pellet2; P3: pellet 3; POM: particulate organic matter and SOM: sedimentary organic matter. Filterfeeders include Chlamys varia (grey symbol) and Mytilus galloprovincialis (white symbol).Sardina pilchardus, Spicara smaris, Trachurus trachurus and Loligo vulgaris are classified as freshfood.Throughout the sampling period, Argyrosomus regius’ carbon isotopic signature was, onaverage, -19.06 0.64 ‰, (ranging between -18.72 ‰ to -19.77 ‰), while for nitrogen it was,on average, 11.45 1.12 ‰, (ranging between 10.24 ‰ to 12.83 ‰). Concerning the isotopicstep enrichment, the value of fish faeces was 13C - depleted compared to the muscle isotopicsignature, with a mean decrease of 1.61 0.55 ‰. For 15N, the depletion was morepronounced, with a mean decrease of 3.34 1.34 ‰.Regarding the phytoplankton fraction, in the three years of study, phytoplankton from cagesite exhibited similar values of δ13C and δ15N, with mean values of -14.54 0.29 ‰ and 7.70 0.22 ‰, respectively. Values in control sites showed little variability, with mean values of 15.04 0.41 ‰ and 7.10 1.06 ‰ for δ13C and δ15N in control 1; and -19.44 0.44 ‰ and 5.25 1.25 ‰ for δ13C and δ15N in control 2, respectively. For zooplankton, mean values in cagesite were -21.13 1.27 ‰ for δ13C and 8.06 0.91 ‰ for δ15N. Values from control 1 showedmore variability; with mean values of -18.49 3.56 ‰ for δ13C and 7.97 0.91‰ for δ15N,while in control 2 values were of -17.39 0.37 ‰ and 5.91 1.30 ‰ for δ13C and δ15N,respectively. Comparing δ13C and δ15N values from cage site relative to control sites,phytoplankton from cage site showed a slightly enrichment in 13C relative to control 1, onaverage 0.59 ‰; differences were more pronounced relative to control 2, with an averagewww.intechopen.com
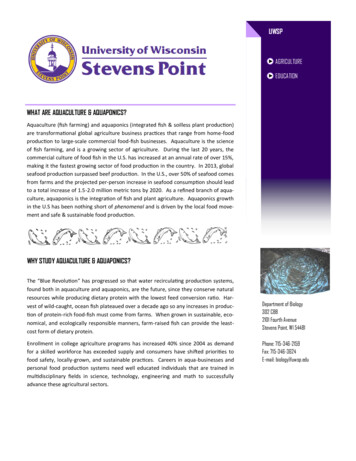
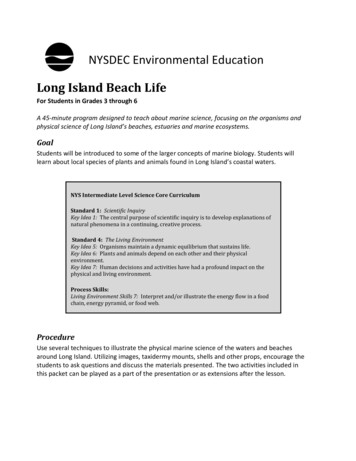
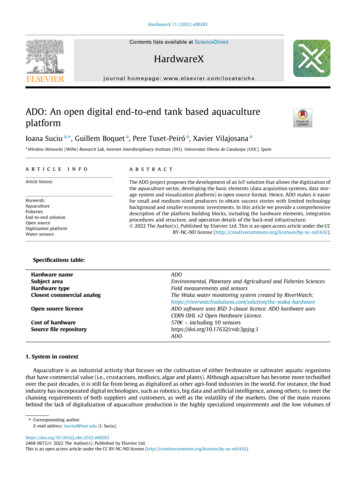
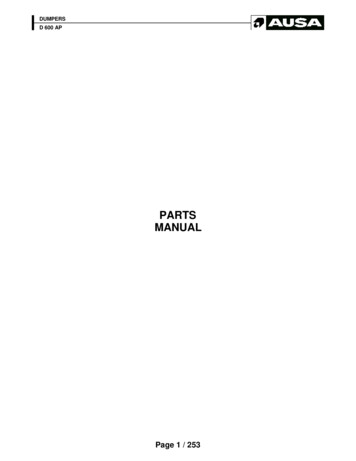
Integrated Multitrophic Aquaculture: Filter Feeders Bivalves as Efficient Reducersof Wastes Derived from Coastal Aquaculture Assessed with Stable Isotope Analyses111Control 1161412Filter feedersZPδ15 N1086H. forskaliiPP4POM2SOM0-23-22-21-20-19-18δ13 C-17-16-15-14-13Fig. 3. Mean δ13C and δ15N values of the different samples in control 1 in years 2008 ( ),2009 ( ) and 2010 ( ). ZP: zooplankton; PP: phytoplankton; POM: particulate organic matterand SOM: sedimentary organic matter. Filter feeders include Mytilus galloprovincialis (whitesymbol).Control 216141210ZPδ15 NFilter feeders8H. forskalii64POMPP2SOM0-23-22-21-20-19-18δ13 C-17-16-15-14-13Fig. 4. Mean δ13C and δ15N values of the different samples in the control 2 in years 2008 ( ),2009 ( ) and 2010 ( ). ZP: zooplankton; PP: phytoplankton; POM: particulate organic matterand SOM: sedimentary organic matter. Filter feeders include Mytilus galloprovincialis (whitesymbol) and Chlamys varia (grey symbol).www.intechopen.com
112Aquaculture and the Environment - A Shared Destinyenrichment of 4.38 ‰. For δ15N values, phytoplankton from cage site, was enriched onaverage a 1.35 ‰ relative to control 1 and 1.56 ‰ relative to control 2. The same patternexisted for zooplankton, with an average enrichment of 2.63 ‰ and 3.73 ‰ in 13C relative tocontrol 1 and control 2, respectively; while for nitrogen, the enrichment relative to control 1and control 2 was on average, 0.09 ‰ and 2.15 ‰, respectively.Particulate organic matter (POM) from cage site showed mean values of -15.98 1.43 ‰ and3.78 2.06 ‰ for δ13C and δ15N, showing an enrichment in 13C and 15N relative to control 1and control 2, with average values of 1.93 ‰ and 0.62 ‰ in 13C and 0.62 ‰ and 1.10 ‰ in15N, respectively. As in phytoplankton and zooplankton, differences were more pronouncedwhen comparing cage site with the distant control site, control 2. On the contrary, δ13C andδ15N sedimentary organic matter (SOM) values from cage site and control 1 were relativelysimilar, with mean values of -17.13 ‰ and 2.04 ‰ for δ13C and δ15N in cage site and -17.04‰ and 3.34 ‰ for δ13C and δ15N in control 1. Relative to control 2, cage site was enriched in13C a 0.67 ‰ while for 15N the enrichment was only 0.06 ‰Sedimentivorous echinoderm Holothuria forskkalii showed mean values of -13.95 0.28 ‰and 7.77 0.56 ‰ for δ13C and δ15N, respectively in cage site. Average values in control 1were -14.10 0.64 ‰ and 7.04 0.27 ‰ for δ13C and δ15N, respectively and in control 2 of 13.19 0.62 ‰ and of 4.82 0.65 ‰ for δ13C and δ15N, respectively. Comparing cage sitewith control sites, an enrichment of 0.79 ‰ in 13C relative to control 2 was observed, whilecontrol 1 values were depleted in a 0.15 ‰ for 13C. For 15N, it was observed an enrichment of0.73 ‰ and 2.93 ‰ relative to control 1 and 2, respectively.3.1.2 Filter feeder bivalves and temporal variability in isotopic signals amongtreatmentsFilter feeders bivalves collected in the cage site exhibited similar isotopic values, rangingfrom -20.73 ‰ to -20.90 ‰ for 13C and 6.26 ‰ to 6.36 ‰ for 15N in Mytilus galloprovincialis,and between -19.41 ‰ to -19.76 ‰ for 13C and 7.33 ‰ to 7.64 ‰ for 15N in Chlamys varia.Statistical analyses showed significant differences between cage and control treatments inthe three years of study with filter feeder bivalves from fish cages enriched in both 13C and15N (PERMANOVA, p 0.05) (Table 2 and 3). Mytilus galloprovincialis of cage site showed anδ Cδ N1315Source of variationdfSSMSPseudo-FdfTr218 .079 .035220 .743*217 .327SS8 .6634MSPseudo-FYe210 .5245 .261812 .08*22 .17121 .08562 .44Se(Ye)417 .0034 .25099 .75*431 .4347 .858417 .72*TrxYe11 .63631 .63633 .7518 .65448 .654419 .51*TrxSe(Ye)13 .99013 .99019 .16*10 .47796 0 .47796Res10746 .6070 .4355810747 .442 0 .44338Total11793 .894117135 .5819 .53*1 .078Table 2. Results of the 3-way PERMANOVA, mixed design, with "Treatment" (Tr), “Year”(Ye) and "Season"(Se) as fixed factors. The analysis is based on the modified Euclideandistance dissimilarity of the Mytilus galloprovincialis isotopic signatures of δ13C and δ15N (999permutations). The studied factors were 3 treatments (cage, control 1 and control 2), threeyears (2008, 2009 and 2010) and three seasons (spring, summer and autumn). *p 0.05www.intechopen.com
Integrated Multitrophic Aquaculture: Filter Feeders Bivalves as Efficient Reducersof Wastes Derived from Coastal Aquaculture Assessed with Stable Isotope Analyses1311315δ Cδ NSources of variationdfSSdfSSMSTr217 .4038 .7017MS Pseudo-F16 .71*222 .2111 .105Ye229 .11614 .55827 .97*22 .80581 .40294 .70*Se(Ye)424 .8836 .220811 .95*440 .42510 .10633 .89*TrxYe0No test00TrxSe(Ye)10 .1911 .04931 .0493Res8343 .28324 .7450 .29814Total9288 .9199292 .93500 .099525 0 .0995250 .52048Pseudo-F37 .24*No test3 .51Table 3. Results of the 3-way PERMANOVA, mixed design, with “Treatment" (Tr), “Year”(Ye) and "Season"(Se) “as fixed factors. The analysis is based on the modified Euclideandistance dissimilarity of the Chlamys varia isotopic signatures of δ13C and δ15N (999permutations). The studied factors were 3 treatments (cage, control 1 and control 2), threeyears (2008, 2009 and 2010) and three seasons (spring, summer and autumn). *p 0.05enrichment of 0.52 ‰ in 13C and 0.75 ‰ in 15N compared to bivalves from control 1; greatestdifferences were found when comparing cage site with control 2, with an enrichment of 0.75‰ in 13C and 1.69 ‰ in 15N (p 0.05) (Figure 5 and 6). Chlamys varia from cage site showed alarge amount of enrichment compared to control 2, 1.11 ‰ and 1.71 ‰ in 13C and 15N,respectively (Figure 7 and 8).3.2 Contribution of organic and inorganic matter sources to different consumers ofthe multitrophic systemAccording to the bayesian mixing model, the main food source for the fish Argyrosomusregius was pellet food, with a mean global contribution of 80.43 % (from pellet 1, 2 and 3),while the remaining 19.57 % corresponded to fresh food. Contributions varied annually, 67.7%, 91.53 % and 82 % for pellet food and 32.3 %, 8.5 % and 18 % for fresh food in years 2008,2009 and 2010, respectively (Figure 9). In the first year of study, pellet 1 was the main pelletfood source, while Sardina pilchardus and Spicara smaris were the main fresh food sources;the main pellet food source changed to be pellet 2 the following year, while in 2010 the mainsource was again pellet 1; Sardina pilchardus and Spicara smaris remained the main fresh foodsources along the remaining years of study.In filter feeder bivalve Chlamys varia, pellet food was the main food source, with a meancontribution of up to 62.68 % of their isotopic composition in the three years of study, followedby fresh food, POM, fish faeces and phytoplankton, with a mean contribution of 18.28 %, 11.26%, 5.18 % and 2.58 %, respectively. Contributions of the five organic matter sources variedboth seasonally and annually (Figure 10), however, aquaculture derived products, as pelletand fresh food and fish faeces remained the main food sources along the three years of studyvarying from 70.03 % in spring 2009 to the maximum of 93.81 % in autumn 2010. Regardingthe seasonal variation, there was a fluctuation in the contribution of pellet food, with amedium contribution in spring, fewer in summer and a higher contribution in autumn.Summer 2009 showed a different pattern with a contribution of 81.74 % of pellet food.Regarding pellet food sources, pellet 1 was the main source in the three years of study, with acontribution fluctuating between 18.72 % and 81.74 %, while for fresh food the maincontribution was from Sardina pilchardus and Spicara smaris. Particulate organic matter (POM)also showed variation, with the lowest contribution in autumn 2009 (4.24 %) and thewww.intechopen.com
114Aquaculture and the Environment - A Shared Destiny-19,0-19,2-19,4-19,6-19,8δ entFig. 5. Mean δ13C (mean SE) values for the three studied years of bivalve Mytilusgalloprovincialis in the study sites: cage, control 1 (C1) and c
Integrated Multitrophic Aquaculture: Filter Feeders Bivalves as Efficient Reducers of Wastes Derived from Coastal Aquaculture Assessed with Stable Is otope Analyses 105 (De Niro & Epstein, 1978; McCutchan et al., 2003). Since the ratio of 12C/13C isotopes changes little through the food web, this ratio is commonly used to distinguish between