Transcription
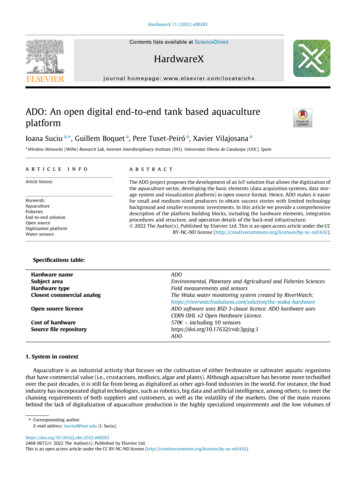
HardwareX 11 (2022) e00283Contents lists available at ScienceDirectHardwareXjournal homepage: www.elsevier.com/locate/ohxADO: An open digital end-to-end tank based aquacultureplatformIoana Suciu a, , Guillem Boquet a, Pere Tuset-Peiró a, Xavier Vilajosana aaWireless Networks (WiNe) Research Lab, Internet Interdisciplinary Institute (IN3), Universitat Oberta de Catalunya (UOC), Spaina r t i c l ei n f oArticle history:Keywords:AquacultureFisheriesEnd-to-end solutionOpen sourceDigitization platformWater sensorsa b s t r a c tThe ADO project proposes the development of an IoT solution that allows the digitization ofthe aquaculture sector, developing the basic elements (data acquisition systems, data storage system and visualization platform) in open source format. Hence, ADO makes it easierfor small and medium-sized producers to obtain success stories with limited technologybackground and smaller economic investments. In this article we provide a comprehensivedescription of the platform building blocks, including the hardware elements, integrationprocedures and structure, and operation details of the back-end infrastructure.Ó 2022 The Author(s). Published by Elsevier Ltd. This is an open access article under the CCBY-NC-ND license ).Specifications table:Hardware nameSubject areaHardware typeClosest commercial analogOpen source licenceCost of hardwareSource file repositoryADOEnvironmental, Planetary and Agricultural and Fisheries SciencesField measurements and sensorsThe Waka water monitoring system created by n/the-waka-hardwareADO software uses BSD 3-clause licence. ADO hardware usesCERN OHL v2 Open Hardware Licence.570 – including 10 sensorshttps://doi.org/10.17632/cvdc3gsjsg.1ADO1. System in contextAquaculture is an industrial activity that focuses on the cultivation of either freshwater or saltwater aquatic organismsthat have commercial value (i.e., crustaceans, molluscs, algae and plants). Although aquaculture has become more technifiedover the past decades, it is still far from being as digitalized as other agri-food industries in the world. For instance, the foodindustry has incorporated digital technologies, such as robotics, big data and artificial intelligence, among others, to meet thechaining requirements of both suppliers and customers, as well as the volatility of the markets. One of the main reasonsbehind the lack of digitalization of aquaculture production is the highly specialized requirements and the low volumes of Corresponnding author.E-mail address: isuciu0@uoc.edu (I. 68-0672/Ó 2022 The Author(s). Published by Elsevier Ltd.This is an open access article under the CC BY-NC-ND license ).
I. Suciu, G. Boquet, P. Tuset-Peiró et al.HardwareX 11 (2022) e00283a niche sector, leading to high product costs that make the adoption of such digital technologies economically viable only forlarge-scale factories. For example, a data acquisition system for a turbidity sensor can cost around 4,500 ( 3,000 for thedatalogger[1] and 1,500 for the sensor[2]).In contrast, a solution developed with open-source tools and the integration of existing general purpose hardware andsoftware platforms could cost less than 600 while including different sensors. However, there are cost-performancetrade-offs when using a cheaper alternative. The technical specifications of the sensors used in ADO are listed in Table 1.With the information provided by this table, a user can know if ADO is a suitable solution for its own application or if itsapplication requires more specialized sensors.In the literature, there are multiple examples of relative cheap approaches for aquaculture and water quality monitoring,which we treat in detail in Section 2. In this article we present ADO, an end-to-end, open and low-cost system aimed at supporting the digitization of the aquaculture sector. From the best of our knowledge, this is the most complete open-sourcework in the related field, fully describing its building blocks, with step by step procedures to setup the system. ADO is composed of three main elements: hardware platform, communication technologies/protocols, and a back-end system. First, thehardware platform is based on a custom PCB that allows to integrate off-the-shelf sensors and other electronic and computing components, and runs a software that is responsible for the data acquisition and processing. Second, the communicationtechnologies and protocols are responsible for the transmission of the data from the hardware platform to the back-end system over the Internet. Finally, the back-end system, which can be hosted on-premises or on the cloud, is used to manage thedevices, store the generated data, visualize it and define operational alarms.The design philosophy behind the ADO project is twofold. Regarding the hardware platform, communication technologies/protocols and the back-end system, we have built upon open-source projects/frameworks and standardized technologies/protocols, thus achieving low hardware and software cost, while maximizing inter-operability, availability and support.Regarding the users, we have designed the system following a plug-and-play philosophy that aims to simplify the devicecommissioning, setup process and daily operation. This end-to-end system approach is the key to ensure that the aquaculture sector can benefit from the open-source solution, limiting the requirements imposed to the sector to adopt a digitalsolution.Overall, the resulting end-to-end system is a low-cost, plug-and-play and real-time asset management and visualizationframework customized to the aquaculture sector that is ready for production environments. Moreover, the resulting systemis in line with the needs identified by the European Maritime and Fisheries Fund (EMFF), and it aims to encourage the collection and harmonization of available data, avoiding duplication and responding to the need for interoperability with othertechnologies in the sector or even in related sectors. Still, while the ADO software applies to any aquaculture vertical, thecasing design proposed in this article is mainly centered on tank-based aquaculture and any adaptation to some other environment should be done while reconsidering the ingress protection of the device and its power mode.The validation of the ADO platform has been conducted during the spring, summer and autumn of 2021 and has consistedin a 8-months pilot deployment in an aquaculture educational center located in the Delta del Ebre, Tarragona, Spain. Thedeployment of the system enabled to validate the simplicity of its deployment, validation of the sensor calibration procedures, obtain feedback from the users of the system and validate the entire data pipeline, from the sensor to the backend server and visualization.2. Related workThe work of Parra et al. in [3] presents a water monitoring system for fish farms, where data from the nodes is sent withWiFi to an access point that has Ethernet connection. The nodes can monitor parameters such as: illumination, water level,oil level, temperature, turbidity, conductivity and humidity. Moreover, there is a feed fall detector, presence sensors and fishbehavior sensors. For the behaviour of the fish, they use light dependent resistors to monitor the swimming velocities and itsdepth, strategy that works only when the halogens are turned on, and not at night. Their work focuses on the calibration ofthe various sensors they use and the total cost of a node is less than 90. However, the resulting node is only a proof of concept and it cannot be deployed as it is, as the sensors are basic electrical components with no water protection. There is noschematic and no performance evaluation compared to off-the-shelf sensors.Saha et al. present a water quality monitoring system [4] with low-cost off-the-shelf elements and pH, electrical conductivity, temperature and water colour sensors. They use Raspberry Pi 3 and Arduino Uno for building the node, and the provider for the sensors is DFRobot. The data from the sensors is sent with WiFi and stored locally on the Raspberry Pi in aMySQL database, and it is extracted by a web page (via an Android app) in order to be displayed in numeric format. Theirapproach stays at proof-of-concept level, without the option for remote access, multiple node management or complexgraphics or alarms. Even if not applied to tank based aquaculture, but to monitor the water quality in Mekong Delta, we mention the work of Danh et al. [5], that proposes an end-to-end aquaculture monitoring system. The data from the nodes istransmitted in the 433 MHz band with LoRa to a control unit, published to a server and accessible with a mobile app.The monitored parameters are dissolved oxygen, temperature, salinity and pH and the entire system was tested in a 5 nodedeployment. The information on their hardware and software is not released and, thus, it cannot be reproduced.Chandanapalli et al. present the implementation of a low cost water monitoring system [6]. However, the authors do notprovide information regarding the obtained costs, nor access to the PCB design. Their system has four sensors attached, to2
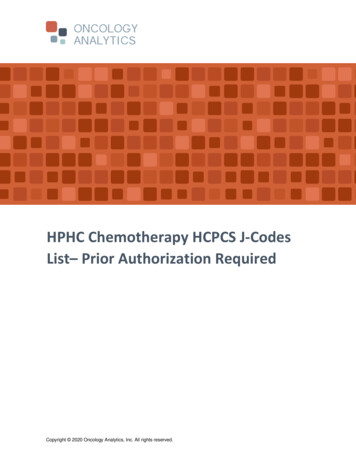
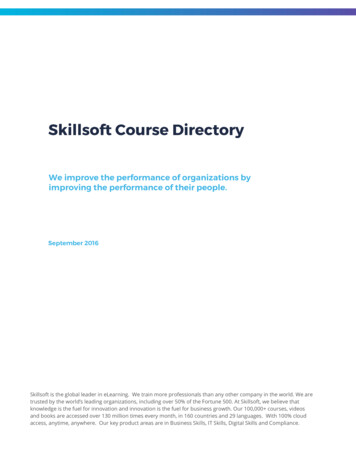
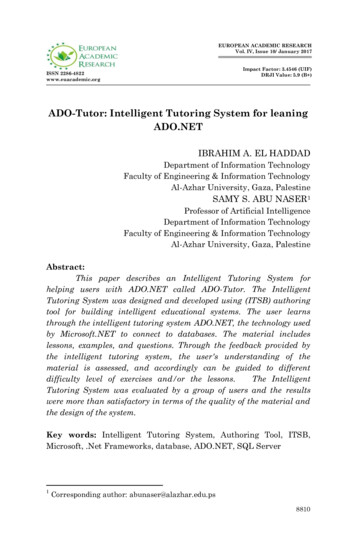
HardwareX 11 (2022) e00283I. Suciu, G. Boquet, P. Tuset-Peiró et al.monitor the water and atmospheric temperature, humidity and pH, and data is sent using the GSM standard. In [7], Qayyumet al. present a solution based on the use of off the shelf elements to build a monitoring system for tank based aquaculture.Their solution relies on MoleNet, a hardware based on the Arduino platform, a 433 MHz RFC69 radio transceiver, pH, DO,salinity and temperature sensors. Data is sent periodically by the Arduino to a Raspberry Pi server. The information onthe total cost of the system, the PCB and the code is not released. Finally, the work of Encinas et al. focuses on providinga proof of concept and a prototype of a distributed IoT system to monitor the water quality by measuring the temperature,pH and dissolved oxygen [8]. Their solution relies on Arduino and ZigBee modules for sensors nodes, which send data to acomputer, further stored in a MySQL database and published to a web app as numerical values.This section reviewed the most relevant, prototype-centered publications in the literature. We identify a general architecture, with the same building blocks: sensor node, server or local data storage and web page/app for data display. The variations are in terms of communication protocol, user interface design, number of sensors or final price. Our work contributeswith a solution that supports a number of maximum 10 sensors that can be even replaced with other electrically compatiblesensors to better fit a specific application. The software is already built to support multi-tenancy, secure connections, built indashboards, data download possibility and real time control and calibration of the sensors. This paper provides a completesetup guide, with information regarding the final price and specifications. The resulting node is ready to be deployed and theback-end system is currently available at https://ado.wine-lab.org/ to support early adopters.3. System descriptionAs introduced earlier, ADO is an end-to-end system intended for monitoring and controlling water quality, allowing totake knowledge-based decisions for quality aquaculture. The ADO project is composed of three different subsystems: hardware platform, communication technologies/protocols, and back-end system. In this section, we describe these subsystems.3.1. Hardware platformThe hardware platform is responsible for the acquisition and the pre-processing of the data from the sensors. It is dividedinto the electronics components and the firmware operation.3.1.1. Electronic componentsThe PCB of the ADO node is depicted in Fig. 1. The main components of the electronics are: a maximum of 10 sensors. The supported sensor destination (e.g., ambient temperature), operating voltage (e.g., 3.3 V or5 V) and communication protocol (e.g., I2C, 1-Wire, analog, digital) are shown in the block diagram of the hardware(Fig. 2). an Arduino MKR series (e.g., MRK1000, MKR1100 or MKR1300) in charge of collecting the sensor data, with a number of 7analog input pins (8/10/12 bit) and 8 digital pins. a Raspberry Pi (RPI), in charge of controlling the Arduino unit: scheduling data collection for individual sensors, managingsensor calibration and publishing data securely to the server.As it can be observed, all these elements are connected to a single control PCB (Fig. 1), which is in charge of interconnecting the devices, providing the required connectors to the actual sensors and offering a flexible power source control. Theactual pin mapping between the main components is represented in Fig. 3.The ADO node can be powered by a 12 V battery or directly from a 220VAC power outlet via a 12 V, 60 W AC/DC converter. The power source can be selected by using a switch. Regardless of the origin, the 12VDC input voltage is later converted to 5 V and 3.3 V to be used by the sensors, embedded systems, and the remaining electronic modules of the board. Thesensors are all Arduino-compatible and come with their own integration boards, which are screwed in the sensor placeholders of the ADO PCB. The sensors are connected to the power supply and to the Arduino input pins (i.e., analog, digital andI2C). For the analog sensors, Arduino has built-in analog-to-digital converters (ADCs), so that there was no need to addADC modules to the ADO PCB. Table 1 provides a summary of the technical specifications1 of the sensors used in ADO.3.1.2. Firmware operationAs stated in the previous subsection, the electronics include two main functional subsystems. On one hand, we have anembedded microcontroller unit integrated into an Arduino module. This unit has the responsibility to handle the configuration and sampling of the different sensors and to serialize the information to the node main CPU upon a request. On the otherhand, the RPI module is responsible for handling the sampling period and requesting data to the Arduino module accordingto a given configuration. It is also responsible for the connection to the network, interacting with the back-end server andprocessing the configuration requests from the end-user.1The main supplier for the sensors is DFRobot: www.dfrobot.com.3
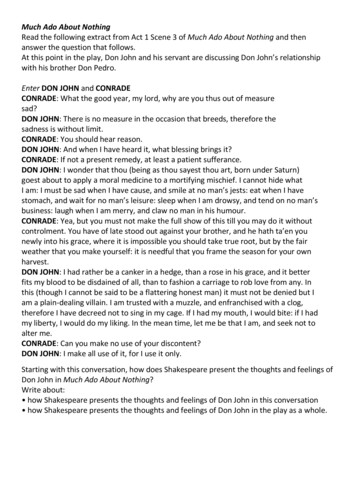
I. Suciu, G. Boquet, P. Tuset-Peiró et al.HardwareX 11 (2022) e00283Fig. 1. 3D PCB of the ADO node.The RPI runs a GNU/Linux distribution and executes a set of micro-services implemented in Python that handle the userinteraction, configuration and authentication methods. The RPI is responsible to flash the Arduino when booted for the firsttime and takes care of checking and processing the firmware updates upon any hardware reset. Fig. 4 is a sequence diagramillustrating the firmware operation described earlier.3.2. Communication technologies/protocolsThe ADO board integrates different communication interfaces. In addition and thanks to its modular design, it enables tointegrate communication interfaces as required by the end user.3.2.1. Communication technologiesBy default, the basic hardware configuration of the ADO board offers two main communication interfaces, namely: Ethernet and Wi-Fi. The MKR Arduino module selected by the presented ADO version (e.g., MKR 1000) features a Wi-Fi interface,but it can simply be replaced by a LTE board as they are pin compatible if a user is required to use cellular connectivityinstead.The Ethernet interface is used for the configuration and bootstrapping phase of the devices. It is reasonable to assume thatnear the ponds the users will not have access to Ethernet sockets, and therefore they will be using WiFi or another wirelessconnectivity interface once deployed. The Ethernet interface however is needed during the setup phase as described above.4
HardwareX 11 (2022) e00283I. Suciu, G. Boquet, P. Tuset-Peiró et al.Fig. 2. Block diagram of the ADO node.Fig. 3. Pin mapping between the components of the ADO node: the symbols are defined in the Bill of Materials (Section .5).During the setup process, the user is prompted to configure the WiFi interface and connect to the existing network. The WiFiinterface is then used during the lifetime operation of the device.3.2.2. Communication protocolsAs described earlier, each ADO node periodically sends sensor data to the back-end. The communication protocol used forsending this data is MQTT (Message Queue Telemetry Transport) [9]. MQTT has been selected as it is extremely lightweightand extensively used in a wide variety of industries (i.e., automotive, manufacturing, telecommunications, oil and gas, etc.)worldwide. It is based on a publish/subscribe mechanism, in which the node publishes messages containing sensor data.There are entities (other ADO nodes, clients) that can subscribe to specific topics. There is a central entity, a broker (ADO5
I. Suciu, G. Boquet, P. Tuset-Peiró et al.HardwareX 11 (2022) e00283Table 1Technical specification of the ADO sensors.SensorMeasurement RangeResolutionAccuracyTemperature RangeWater- proofS1:S2:S3:S4:S5:S6:S7:S8:S9: 55 to 125 C0 to 100 RH, 40 to 125 C0 to 140 to 3000 NTU0 to 20 mg/L0 to 15 ms/cm10 to 100 ms/cmNo limit0 to 5000 ppm0.1 C0.1 RH, 0.1 C0.011 NTU0.01 mg/L0.001 ms/cm0.001 ms/cmN/A1 ppm 0:5 C 3% RH, 0:3 C 0:1N/AN/A 5% 5% 0:5 mm 50 ppm 55 to 125 C 40 to 125 C5 to 60 C5 to 90 C0 to 40 C0 to 40 C0 to 40 C 25 to 105 C0 to 50 C, 0 to 95% RHYesYesYesYes, in IP67 boxYesYesYesYesYes, in IP55 boxWater Temp.Atmospheric Hum and TemppHTurbidityDOConductivity K 1Conductivity K 10Water LevelCO2Fig. 4. ADO node: sequence diagram of the firmware operation and the corresponding interactions between the user, RPi, Arduino and back-end server,when registering the node and visualizing data.server), that filters the received messages and topics, and makes them available to the entities that subscribed to that specifictopic. In this way, the messages sent by the publisher will always be available to the subscriber regardless of them running atthe same time, or knowing each other’s IP address or identities.More specific, for ADO, when a user registers, it gets assigned a unique channel ID. This ID is being inserted in the topicused by its nodes for publishing data: ‘‘channels/[channel ID]/messages”. All the nodes of this user will publish messages tothis topic and will be subscribed to the control topic: ‘‘channels/[channel ID]/control”. The Graphical User Interface extractsfrom the user’s database the data published in the messaging topic and adds it to the user’s dashboards; moreover, it uses thecontrol topic to send control actions from the user to the nodes: calibration, sampling rate, etc. By using these unique topics,the messages intended for one user will never be available to another user. The ADO back-end infrastructure, described indetail in the next section, takes care of instantiating the MQTT broker that handles all the topics.The messages sent by the ADO nodes in the messaging topic are stored in an Influx database. Each user database containstwo measurements: ‘‘control” – storing the commands sent by the user – and ‘‘messages” – storing the sensor readings sentby the nodes. Data stored under both measurements is organized into the following influxdb fields and tags: time: timestamp channel: user’s unique channel ID6
HardwareX 11 (2022) e00283I. Suciu, G. Boquet, P. Tuset-Peiró et al. device name: the specific ADO device that sends the data (messaging topic), or which the control is acting on (controltopic) sensor name: the specific sensor that the reading belongs to (messaging topic), or which the control is acting on (controltopic) protocol: MQTT publisher: unique ID associated with the ADO device unit: data measurement unit update time: the maximum time before this sensor will provide an updated reading for a measurement value: actual sensor reading (messaging topic), or the setting imposed on that sensor (control topic) subtopic: two possible values – SR and CAL – particular to the ‘‘control” measurement, to differentiate between samplingrate control and calibration controlData is sent in JSON format, using SenML labels: payload [‘‘bn”: ‘‘”, ‘‘n”: sensor name, ‘‘u”: unit, ‘‘v”: value, ‘‘t”: timestamp]. These labels are used to fill the InfluxDB database with the corresponding values. The information on unique ID’s iscollected automatically, as each device uses its own ID and key (received upon registration) to log into the MQTT broker. Theinformation on channel ID and the corresponding influx measurement is contained in the MQTT topic used for publishing theJSON data.3.3. Back-end systemThe ADO back-end infrastructure is responsible for two things. First, receiving the data from the ADO nodes and storingthe data in a time-series database. Second, providing a set of tools to manage the assets and visualize the data. Regarding theasset management, it includes mechanisms to authenticate the devices and a security framework to enable multiple tenants.Regarding the visualization tools, it includes mechanisms to create alarms based on predefined thresholds.These functionalities are provided by a framework composed of different building blocks leveraging open-source toolsand frameworks that already exist. These components have been integrated together to provide a functional, secure and configurable server infrastructure closing the system orientation of the ADO framework. Fig. 5 presents a schematic diagram ofthe different components used to integrate the back-end system.3.3.1. Platform orchestrationThe Mainflux framework [10] has been used as a base building block to orchestrate the system. Mainflux is a frameworkdeveloped in Go and built as a set of microservices that provides device management, data aggregation and data management functionalities. On top of that, it provides connectivity and message routing between different back-end components,event and alarm management, analytics on the core operation and the possibility to connect to different user interfaces.One important feature of Mainflux is that it is built to support multi-tenancy and enables different organizations andusers to run their dashboards and management interfaces in an isolated manner. The ADO platform leverages the securityand user management functionalities of Mainflux to both authenticate and secure the devices and the back-end platform.Fig. 5. ADO back-end building blocks: input and user APIs, user authentication and asset management, data visualization and data storage, and thecorresponding tools for building them.7
I. Suciu, G. Boquet, P. Tuset-Peiró et al.HardwareX 11 (2022) e00283To operate, Mainflux uses two different databases. First, Postgress SQL is a relational database used to store operationaland management data, such as information about users, devices and locations. Second, InfluxDB is a time-series databaseused to store the data received from the sensor nodes.Message routing between ADO devices and the ADO back-end is handled by a MQTT broker, exposed by the Mainfluxframework as a microservice. Finally, the NGINX application server is used as proxy to hide the interfaces of the differentmicro-services. This ensures that the management and other critical interfaces are not exposed to non-specialized users.In addition to integrating Mainflux, the ADO back-end has a custom Python service that is responsible to customize thisapplication for the aquaculture vertical and to allow the user to control its devices remotely. This control is done via the Grafana user interface and dashboards, as explained in detail in Section 3.3.2), and allows users to identify its devices, turn thesensors on/off and control their sampling rate, calibrate them following on-screen instructions, and set thresholds to determine when alarms should be triggered.3.3.2. Visualization frameworkThe visualization framework is built using Grafana [11]. Grafana is an open-source dashboard and visualization systemthat is well-known and widely adopted.Within the ADO back-end, Grafana has been integrated into Mainflux as a microservice and is used as the entry point forthe non-administrative user, allowing to access sensor data and configuring sensor devices, as explained earlier. Sensor datais obtained directly from the InfluxDB database, communication is handled by MQTT, and access is provided through theNGINX application server.Several Grafana templates have been developed to simplify the use of the platform, defining the proper visualizationdashboards organized by tenant, device and sensor type. We have extended the Grafana dashboard to enable the end usersto configure the sampling rate of the ADO nodes. With a simple combo-box, the users can change the sampling rate of theADO devices, as well as start or stop them. More specifically, the user has access to the following visualization dashboards:1. ‘‘All devices” (Fig. 6b,c): this dashboard offers the visualization of aggregated sensor data from all the registered devices,available at one glance. This is useful for quickly checking the status of a parameter in all the locations that have devicesinstalled. For example, checking the current temperature in all the pools. By selecting the temperature sensor from thedrop-down menu, two types of information are displayed: i) the bar plot is showing the average temperature valuefor each device. The number of bars is equal to the number of user registered devices that have that type of sensor connected. ii) the time series plot is showing the evolution in time of the temperature value, for each device, on the sameplot, but with different colors. The time range can be selected by the user to any interval since the registration of thedevices. Fig. 6b) shows the aggregated temperature data for the case of a user that has two devices equipped with temperature sensors: there are two bars corresponding to each device, showing the average temperature value, and twotraces in the time series plot, showing the evolution of this parameter for both devices. In comparison, Fig. 6c) showsthe dissolved oxygen data, but the user has only one device equipped with this type of sensor, so only one wide bar isshowing, and one green trace.2. ‘‘Calibration”: this dashboard is to be used if the user has at least one of the following sensors: C02, Dissolved Oxygen,Conductivity and/or pH. It offers written instructions for correctly calibrating each of these sensors, according to theirtechnical specifications. Calibration is recommended to be repeated once a month, but this dependents on the environment where the sensors are used and their usage frequency. We created a collection of YouTube videos2 that describe notonly the calibration process, but also the other visualization options of the ADO graphical interface.3. ‘‘Device configuration” (Fig. 6d,f): this dashboard is used as per device basis, to look deeply into the data that a certaindevice provides. From the drop-down menu, the device of interest can be selected. There are three types of information displayed: i) overall device health (Fig. 6d), showing the most recent value recorded by each sensor of the selected device, ingreen if the sensor is currently working and in red if that sensor is currently turned off; ii) time series data for each of thesensors of the selected device (Fig. 6d), – this data can be downloaded in various formats: CSV, text, for a specific time range;iii) the current sampling rate value for each sensor of the selected device, with options to change it to any value from thedrop-down menu, or to turn the sensor off (Fig. 6f); This control is sent to the device in real time, using MQTT messages.4. ‘‘System alerts” (Fig. 6e): these dashboards has two sections. The top section shows a history of the alerts that the ADOsystem triggered, aggregated for all the devices and all sensors. Alerts are displayed in red if they are critical and an alarmwas triggered, in orange if the event is still evaluated or there is no data to be evaluated, and in green if the sensor valuesare within the specified ranges. The alert mentions the device name and the sensor value that triggered it. The bottomsection of this dashboard allows the user to select each sensor and to set the ‘‘healthy” range of values. Any values thatwould be outside that range will trigger an alarm, that consists in a new red entry in the alarm history, a new red entry onthe GUI homepage and an email notifying about the registered value, the device in question and optionally, a screen capture from the GUI.2ADO tutorial: https://www.youtube.com/playlist?list PLcyHQsMeofzA-NNKaqbpQZJie6e59i0zi8
HardwareX 11 (2022) e00283I. Suciu, G. Boquet, P. Tuset-Peiró et al.Fig. 6. Graphical user interface of ADO deployed in the pilot case: a) ADO login screen; b,c) ‘‘All devices” dashboard; d),f) ‘‘Device configuration” dashboard;e) ‘‘System alerts” dashboard.The user has the possibility to create its own dashboards and manipulate the collected data from its sensors, to obtain anyother useful information for its personal application.4. Design filesThe complete list of the hardware design files and software projects is summarized in the following table. These files areavailable at https://doi.org/10.17632/cvdc3gsjsg.1 and contain the necessary information to replicate the hardware PCB, thefirmware code that has to be installed on the hardware, and the software code for launching the server. A description of eachof the listed design files follows: Schematic Prints.pdf: PDF file containing the schematic describing the interconnections between components of the ADOhardware. Board.step: the 3D model of the ADO PCB. BOM.xlsx: Excel file containing the Bill of Materia
In the literature, there are multiple examples of relative cheap approaches for aquaculture and water quality monitoring, which we treat in detail in Section 2. In this article we present ADO, an end-to-end, open and low-cost system aimed at sup-porting the digitization of the aquaculture sector. From the best of our knowledge, this is the most complete open-source work in the related field .