Transcription
(2020) 5:61Epler‑Ruths et al. Cogn. Cognitive Research: Principlesand ImplicationsOpen AccessORIGINAL ARTICLEFocus on the notice: evidence of spatialskills’ effect on middle school learningfrom a computer simulationColleen M. Epler‑Ruths1* , Scott McDonald2, Amy Pallant3 and Hee‑Sun Lee3AbstractThis article represents the findings from the qualitative portion of a mixed methods study that investigated theimpact of middle school students’ spatial skills on their plate tectonics learning while using a computer visualiza‑tion. Higher spatial skills have been linked to higher STEM achievement, while use of computer visualizations hasmixed results for helping various students with different spatial levels. This study endeavors to better understandthe difference between what high and low spatial-skilled middle school students notice and interpret while using aplate tectonic computer visualization. Also, we examine the differences in the quantity and quality of students’ spatiallanguage. The collected data include student spatial scores, student interviews, screencasts, and online artifacts. Theartifacts were students’ answers to questions inserted in an online curriculum (GEODE) with the embedded computervisualization (Seismic Explorer). Students were asked what they “noticed” during interviews and in the curriculum.Typed student answers and interviews were analyzed for types and quantity of spatial words. Analysis of typedanswers and interviews indicated that there are differences in the number and types of spatial words used by high orlow spatial students. Additionally, high spatial learners talk about depth, notice patterns in data and are more likelyto make a hypothesis to explain what they see on the screen. Findings suggest that students go through an iterativecycle of noticing and interpreting when using a scientific model. Overall, results show a significant positive relation‑ship between spatial skills and what students notice while learning plate tectonics. An explanation for the increasedgain in plate tectonics comprehension is that students with higher spatial skills notice more, so they are able tointerpret more details of the model. This finding implies that students with low spatial skills do not benefit as muchfrom use of a computer visualization and will need more scaffolding in order to interpret details in the computervisualization.Keywords: Spatial skills, Plate tectonics learning, Computer visualizations, NoticingBackgroundThinking spatially is complex as it involves variousaspects of spatial abilities including mental rotationof objects, perception of one’s location in a setting,and visualization of how material would fold or unfold(Liben and Titus 2012; National Research Council 2006).There is no consensus on how to classify “spatial thinking.” While spatial thinking covers a variety of cognitive*Correspondence: cmeruths@gmail.com1Shikellamy High School, Sunbury, PA 17801, USAFull list of author information is available at the end of the articleprocesses (Kozhevnikov and Hegarty 2001; McGee 1979;Wang 2017), “spatial skill” relates to a specific categorywithin spatial thinking and represents the cognitive processes of mental rotation, defined as the ability to quicklyand precisely rotate either 2D or 3D figures; spatial orientation, defined as the ability to find a spatial relationshipin reference to as student’s body, and spatial visualization,defined as ability to perform a complex spatial procedurewith many steps, perspective taking and so on (Liben,personal communication, October 26, 2018). Rather thanability or intelligence, the term skill is used to emphasize The Author(s) 2020. Open Access This article is licensed under a Creative Commons Attribution 4.0 International License, whichpermits use, sharing, adaptation, distribution and reproduction in any medium or format, as long as you give appropriate credit to theoriginal author(s) and the source, provide a link to the Creative Commons licence, and indicate if changes were made. The images orother third party material in this article are included in the article’s Creative Commons licence, unless indicated otherwise in a credit lineto the material. If material is not included in the article’s Creative Commons licence and your intended use is not permitted by statutoryregulation or exceeds the permitted use, you will need to obtain permission directly from the copyright holder. To view a copy of thislicence, visit http://creat iveco mmons .org/licen ses/by/4.0/.
Epler‑Ruths et al. Cogn. Research(2020) 5:61that it can be improved through training, learning orexperience (Newcombe 2010; Uttal et al. 2013a, b).Research on spatial skills indicates an important linkbetween being able to think spatially and understanding complex scientific content, in particular geosciences(Kastens and Ishikawa 2006; Kastens et al. 2009; Manduca and Kastens 2012; Uttal and Cohen 2012). Geoscience is considered a spatial science, making it difficult fornovices who cannot discern spatial properties to learnearth science content (Liben and Titus 2012). Studiesshow that students who are not adept at spatial visualization, perspective taking, and mental rotation are lesssuccessful in science, technology, engineering, and math(STEM) classes and tend to leave those majors (Uttaland Cohen 2012). Most studies of spatial skills concerning science learning were conducted in the undergraduate classrooms (Uttal et al. 2013a, b). Less research hasbeen conducted at the secondary school level with regardto spatial skills and STEM learning (Newcombe 2010,2013). Research in K-12 science learning found that priorknowledge and reasoning (Keig and Rubba 1993) andspatial ability (Klein and Koroghlanian 2004; Ganley et al.2014) help students learn science content. In order toimprove instruction and enhance students’ achievement,researchers need to have a better understanding of howspatial skills are related to science learning across students K-12.Computer visualizations are often used in K-12 science classrooms to supplement curriculum and mayrequire students to use a variety of spatial skills. Usually embedded in an inquiry science learning environment (Linn et al. 2010), dynamic visualizations, whichare defined as digitally animated, interactive representations, expose certain aspects of the scientific phenomenon for the learner’s manipulation (Renken et al.2016) and allow the learner to understand inner workings of a complex system such as a Earth’s climate (Pallant and Lee 2014). Fortunately, studies indicate thatcomputer visualizations can help students mitigateissues with spatial understanding (Höffler 2010;Ruttenet al. 2012; Smetana and Bell 2012) by making abstractconcepts more concrete, simplifying parts of the worldthat are too complex to visualize, and lowering thecognitive load of visualizing other complex phenomena. Cognitive load refers to the degree to which working memory can be overloaded with information to beprocessed and remembered by the brain (Baddelelyand Hitch 1974; Sweller 1988). Cognitive load can bereduced by 3D and dynamic visualizations to compensate for students low spatial skill (Höffler 2010; Lee2007). However, other studies hypothesize that learners with high spatial abilities generally develop deeperunderstanding from dynamic visualizations perhapsPage 2 of 16due to “ability-as-enhancer,” their high spatial skillenhances good instruction or “ability-as-compensator,”where high spatial skill compensates for poor instruction, because high spatial students need fewer cognitive resources to hold mental pictures (Mayer and Sims1994; Hays 1996; Hegarty and Sims 1994). Since computers have become standard classroom resources inthe USA, computer-based dynamic visualizations havebecome more available. Research is needed to explicatewhy different learning outcomes emerge for studentswho are spatially adept and those who are not whileusing dynamic 3D computer visualizations in the science classroom (Hoffler 2010).Researchers have tried to understand how spatialskills can be evaluated and framed in the context ofstudent learning when supported with computers. Science education researchers (Carey 1986; Chi et al.1981;Jacobson 2001; Petcovic and Libarkin 2007) have usedaspects of novice/expert differences to study spatialskills in science. Professional vision (Goodwin 1994)describes how experts notice important subtleties thatare elusive or invisible to novices. One way to gaugedeveloping professional vision with spatial skills isthrough examining the noticing effect (Lindgren andSchwartz 2009) by asking what students notice on acomputer screen. The noticing effect is especially useful for determining levels of student understanding.Since learning is often defined as developing knowledgethat allows for formulating inferences beyond the giveninformation (Bruner 1957; Goodwin 1994), spatial skillswill likely be associated with what students notice and,in turn, make inferences.This article describes the qualitative results froma project that included a pilot study and main studyaddressing these issues. In the pilot study, we firstdetermined the spatial affordances in the computer visualization used in the research, Seismic Explorer. Seismic Explorer is embedded in the GEODE curriculum,which is designed to support student learning aroundthe patterns between volcanoes, earthquakes and platetectonics. We then collected student answers to noticing questions placed within the online GEODE curriculum. The initial student answers were used to developeda Spatial Noticing Coding Framework to code the spatial characteristics of students’ typed answers. In thesecond (main) study, we investigated the intersectionof student spatial skills based on the Spatial Reasoning Instrument (Ramful et al. 2017) with what studentsnoticed in interviews and in typed answers in curriculum while using the Seismic Explorer computer visualization during a middle school earth science class. Thequalitative data were collected and analyzed to answerthese research questions:
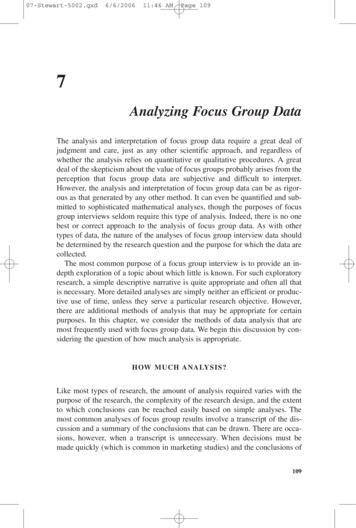
Epler‑Ruths et al. Cogn. Research(2020) 5:61 What are the differences in what high or low spatialstudents notice and interpret while using the computer visualization? Does the quality and quantity of spatial language usediffer between high and low spatial students?The learning contextThe computer-based visualization used in this studywas part of an online middle school curriculum module focused on the guiding question, “What will Earthlook like in 500 million years?" The module was developed as part of Geological models for Explorations ofDynamic Earth (GEODE) project. The GEODE modulewas designed to help students understand plate tectonicsfrom the system perspective, an idea that tectonic platescover the entire surface of the Earth and are in constantmotion, causing interactions in specific ways along all oftheir boundaries. Students investigate several cases ofplate boundary types and formulate hypotheses aboutcausal mechanisms leading to seismic activities and landforms found on Earth. The plate tectonics module takesfive to eight class periods to finish and contains two computer-based simulation/visualization tools: the SeismicExplorer for interactively retrieving volcanic and earthquake data around the world over the last eighty yearsand Tectonic Explorer for simulating plate motions on an“Earth-like” planet. This study focuses on data visualizations shown on the Seismic Explorer.Fig. 1 Seismic explorer affordances—earthquake timeline viewPage 3 of 16Seismic Explorer (SE), developed by Concord Consortium, is a web-based data visualization tool used tomodel earthquake, volcano, and plate data onto an Earthmap (Pallant et al. in press). SE is a dynamic visualization(Linn et al. 2010) embedded in the plate tectonic curriculum. SE is a robust application that provides visualizationrequiring many spatial skills: spatial orientation, mental rotation, and spatial visualization. Students must usethese skills to be able to interpret the spatial nature of SEto have the most sophisticated understanding possible ofthe earthquake/volcano/plate data.The affordances of Seismic Explorer (Figs. 1 and 2)include a detailed map of the Earth with the ability tooverlay three types of data onto the surface—earthquakes(as colored dots), volcanoes (as colored triangles), andplate boundaries (as colored lines). The display can bealtered by map types, data types, and earthquake magnitude and time. The visualization has buttons to openor close a key, change map type, change data type, run atime-lapse of earthquake data, and filter for earthquakemagnitude. In addition, SE has a dynamic slicing tool thatallows users to cut a 3D cross-sectional piece of Earth outof the map to see the pattern of earthquakes below thesurface.The SE visualization has many features to help studentsvisualize the spatial geoscience features of earthquakes,volcanoes, and plates. The analysis of the affordances ofthe tool demonstrates the interrelationship between thiscomputer visualizations and spatial skills.
Epler‑Ruths et al. Cogn. Research(2020) 5:61Page 4 of 16Fig. 2 Seismic explorer affordances—dynamic 3D slicing toolMethodsThe research project was divided into two parts, a pilotand a main mixed methods study. This paper discussesresults from pilot and qualitative portion of main study(Fig. 3).ParticipantsPilot study—A convenience sample (n 58) of seventhgrade students located in a suburban school district inPennsylvania near an R1 university participated in thepilot study. The only data collected were artifacts of student work from the online GEODE curriculum. Prior tothis unit, students had completed a section of life sciencecurriculum. The data were collected in the spring semester from 12 classes from three experienced teachers.Main study—A convenience sample (n 119) of seventh-grade students participated in the main study.The students attended one middle school that served asmall city in an economically disadvantaged rural area.Plate tectonics content was taught during the fall, afterFig. 3 Diagram of methods discussed in this paper: procedures and products. Note. From this research study, 2017
Epler‑Ruths et al. Cogn. Research(2020) 5:61Page 5 of 16students completed a unit on “measurement and thinking like a scientist.” Prior to the study, the two experienced teachers involved had used a mixture of lecturesand hands-on activities followed by assessment in theirclasses. The teachers taught the plate tectonics module tofive classes each.MeasuresSRI testscore is 30 points. Test norms report a score of 10 was inthe 10th percentile, a score of 22 was in the 75th percentile, and a score of 28 was in the 95th percentile. Based onthese reported parameters and available student population, this study placed students with a score of ten or lessas low spatial student and students with score of 20 ormore as high spatial.Plate tectonics content pretest and posttestThe Spatial Reasoning Instrument (SRI) was administered to students in the main study prior to the start ofthe plate tectonic curriculum. SRI was chosen for thisresearch because it is designed for use in research withmiddle school students (Ramful et al. 2017) and measures three spatial skills—mental rotation, spatial orientation, and spatial visualization—skills needed in STEMcurricula typically experienced during ages 11–13. Theskills measured by the SRI are related to the skills neededto use Seismic Explorer and to learn plate tectonics(Table 1). SRI incorporates 10 questions from each skillincluding card rotation tests, cube comparison tests,folding paper tests, and perspective-taking tests and hasbeen tested for reliability and validity. The maximumA content test developed by researchers by the GEODEproject team based on prior research and was administered before and after the curriculum in the main study.The 16-question multiple choice content measure usedquestions from existing standardized tests collected fromoutside sources as well as questions developed by theresearch team. Four of the multiple-choice questions inthe online test used questions from the Plate TectonicsMultiple Choice (PTMC) assessment tool. The PTMCdiscerns students’ level of understanding along variousdegrees of sophistication to an upper anchor of the platetectonics learning progression.Table 1 showcases how three different spatial skills areutilized across three different dependent measures—plateTable 1 Alignment of Spatial Skills to Plate Tectonics Learning, SE Tools and the SRI TestSpatial Orientation(Perspective Taking)Which arm does shehold out?Mental RotationPlate TectonicsLearningUnderstand one’slocation in space,reading maps, findrelationshipsbetween cardinal(NESW) points, andperceive objects fromfront, top and sideviewEnvisioning the otherside of the planet orimagining depth ofearthquakes, faultline and layersImagine platemovement over time-on surface andunder the earth, or tofind patterns withrelation toearthquake, volcanoand geographicfeaturesSeismic ExplorerWhole worldperspectiveSlicing toolSimultaneous spatialprocesses – key,plate motion, depthSRI (SpatialReasoningInstrument)From this research study, 2017Spatial VisualizationWhat would this looklike when unfolded?
Epler‑Ruths et al. Cogn. Research(2020) 5:61tectonics understandings, the Spatial Reasoning Instrument (SRI), and the affordances of the SE visualization(see Table 1). Table 1 matches the three spatial skills (spatial orientation, mental rotation, and spatial visualizationon row 1) with example questions on the SRI (row 2), theuse of those skills to support learning plate tectonics (row3) and how the skills could be used while using the Seismic Explorer visualization.Spatial language coding systemThe Spatial Language Coding System (SLCS) was used tocode student uses of words—both written and spoken—in both the pilot and main study. SLCS was designed tostudy overall naturalistic spatial language to determinethe frequency of spatial words individuals use across different spatial domains (Cannon et al. 2007). Words werecoded in terms of spatial dimensions, shapes, locationsand directions, orientations and transformations, continuous amount, deictics, spatial features and properties,and patterns. Spoken and typed spatial words from interviews and digital artifacts were totaled to arrive at a spatial word score for each student. This measure counts theexistence of a spatial words so a computer search featurewas used to find the number and variety of spatial wordsin the phases typed by students.Spatial noticing coding frameworkIn addition to the analysis of spatial words based on thespatial language coding system, a coding framework forspatial noticing was developed as part of the pilot studyto classify the spatial references specifically generatedwhile answering four noticing questions in the GEODEcurriculum. The first question asks the students to“Describe the pattern of earthquake depth and magnitude in your cross section (of South America). Why doyou think the earthquakes form that pattern?”. The nextquestion asks the students to “Describe some features ofthe topography (the ups and downs of the land surface)of the Indian Ocean”. The third asks “What do you noticeabout the pattern of earthquakes and the topography ofthe Indian Ocean? And the last question asks “Describethe pattern of earthquake depth and magnitude in yourcross section (of the Indian Ocean). Why do you thinkthe earthquakes form that pattern?Interviews and typed curriculum answersIn addition to the two measures, we also coded studentinterviews and typed curriculum answers to understandtheir spatial words and noticing. The student responsesto the GEODE curriculum questions were analyzed todistinguish modes of relationships: similarity and contiguity (Maxwell and Miller 2008). Students were scoredfrom 0 to 3: a score of 0 (none) for no or incorrectPage 6 of 16answers; a score 1 (low) for answers based on colors, ascore 2 (medium) for answers based on depth or earthfeature, or a score 3 (high) for answers based on combination of depth, earth feature, or plates. The higher thescore, the more spatially integrated the students’ writtenanswers were. For example, students who only answereda noticing question using color (score 1) did not provideevidence of using spatial skills. On the other hand, students who discussed depth and related the depth to Earthfeatures (score 3) showed evidence of using spatial skills.Two raters scored the entire set of 64 students’ responsesto four noticing questions in the GEODE curriculum.Each question was scored from 0 to 3. The inter-raterreliability was measured using Kappa for each GEODEquestion: 0.78, p 0.001, for the first question; 0.75,p 0.001 for the second question; 0.58, p 0.001, for thethird question; 0.67, p 0.001 for the fourth question. Theexact score agreement between the two raters was 88%for the first question, 86% for the second question, 77%for the third question, and 78% for the fourth question. Aspatial noticing score for each student was computed byaveraging all scores the student received across the fourquestions.Student whose answers went beyond the color seemedto indicate that they were beginning to interpret the 3Dnature of the phenomena around plate tectonics (Kastenset al. 2006; Newcombe 2016). The Spatial Noticing Coding Framework along with multiple exemplars for eachof the coding levels was reviewed and approved by fourindependent researchers not familiar with the project inan effort to confirm face validity.ProceduresThis study was conducted as the qualitative study portionof the Pretest–Posttest Control Group design where theGEODE curriculum treatment was randomly assignedat the class level. All students (n 119) took a spatial(SRI) test and a plate tectonics content pretest. Then fiveclasses each received one of two treatments: controlled(n 57; regular classroom plate tectonic instruction) orGEODE (n 62, online curriculum with embedded Seismic Explorer visualization) treatment. Student answerdata were collected from the GEODE treatment grouponly. The control group received an alternative activity that paralleled the GEODE curriculum content asagreed upon by teachers. Nine students from both control and GEODE classrooms were interviewed usingthink-aloud semi-structured interviews (see Table 2).The students interacted with the SE visualization tool(not imbedded in the GEODE curriculum) in the middle of the three-week period they were learning aboutplate tectonics in school. The primary selection criteriawere of students that represented the extreme high and
Epler‑Ruths et al. Cogn. Research(2020) 5:61Page 7 of 16Table 2 Student interviewsDate NAMESRI ScoreControl or GEODEPrePostGainSci GradeNotesInterviewed 2x – pre–pre/post10–18 LENA7GEODE4515210–19 DEB7Control32 16510–25 LYNN5GEODE6410–28 ROY6GEODE1411–3 CLINT8Control5311–1 AYDEN25GEODE97 23 2 2847110–23 BOB25Control31188924Control2539911–3 LYNSEY27Control67193Data collection and analysisMeasuresPrior to starting the plate tectonic curriculum, studentdata from the Spatial Reasoning Instrument and the platetectonic content pre-test were collected online and at theconclusion of the curriculum, all students took the content post-test.Student typed curriculum module responses (GEODE)Student answers to four noticing questions were selectedfor analysis. The questions focused on what studentsnoticed about earthquakes in two locations on Earth: thewest coast of South America (Peru and Chile), and thebasin of the Indian Ocean between Africa and Australia.Student interviewsDue to constraints of testing in the field, students usedin the interviews were from both treatment groups.This means that some students would have had experience of using the SE feature before the interview, whilstsome would have not. The students were interviewedduring the three-week period when students were studying earthquakes, volcanoes, and plate tectonics in science classes. Table 2 shows nine interviewed students:four from GEODE classes and five from control classes.4 min of video—tech issue9610–25 LAURIlow spatial abilities based on their scores on SRI test. Wethen tried to balance the interviewed students in termsof high/low spatial scores, gender, treatment/control, andthe criterion of being talkative (López and Pintó 2017).After the treatment, both groups took the plate tectonicscontent posttest that was identical to the pretest. In thisstudy, an unequal sample size was used for the two partsof the analysis. Large classroom student data sets wereused for coding student answers to online curricula. Student interviews were limited to a few targeted high andlow spatial learners, in order to establish specific comparisons to differentiate between cases (Adams 2008).No screencast, only field notes58Five students scored lower than 10 out of 30 on the SRItest and were categorized as low spatial ability. Four students scored higher than 24 out of 30 score and were categorized as high spatial ability. Student interviews wererecorded using screencast software that captured whatwas happening on the computer screen and the audio ofthe student’s and interviewer’s voices. Screencast videoswere limited in order to establish specific comparisonsto differentiate between cases (Adams 2008). Interviewswere conducted while GEODE students were using theGEODE online curriculum and control students weredoing similar text book curriculum. Students were asked“What do you notice?” while they were interacting withthe Seismic Explorer. Screencasts were analyzed at theportion of the interview where students were using aspecific spatial skill (Table 3). All interviews were transcribed. The excerpts used in this article were chosen torepresent when students are using SE to look at the mapfrom overhead (spatial orientation), using the slicingtool (mental rotation), or interpreting the key to the map(spatial visualization).ResultsThe analysis of students’ typed answers to the noticingquestions in the GEODE module and their interviewsyielded several differences between high and low spatial students in what they notice, how they interpret thevisualizations, and the spatial language they use whendescribing their interpretations. The three key differencewere in ways they talked about depth, identified patterns,and if they proposed explanations or hypothesizes.Talking about depthsWhen talking about the physical dimensions of Earth,high spatial learners used words related to depths andheights while low spatial learners talked about thecolors of the features. High spatial learners noticed/interpreted the information from the key that explained
Epler‑Ruths et al. Cogn. Research(2020) 5:61Page 8 of 16Table 3 Spatial skills used in seismic explorerSpatial skillDefinitionCurriculum activitySpatial orientationAbility to find a spatial relationship inreference to a student’s bodyUse spatial orientation to interpret themaps from overhead to see height ofmountains, depth of ocean, and depthof earthquakes within EarthMental RotationAbility to quickly and precisely rotateeither 2D or 3D figuresUse mental rotation to interpret themotion of the 3D slice as the slice ispulled out of ground and rotated toshow the side of the slice as well asrotated around the axisSpatial visualization Ability to perform a complex spatialprocedure with many stepsSE visualizationsUse spatial visualization between the keyand the map to interpret magnitudeand depth of earthquakes, topographi‑cal data on land and in ocean, andtemporal data as earthquakes areembedded on the mapthe various earthquake depths and verbalized the earthquakes’ depths from the surface. High spatial studentsseemed to use spatial visualizations and spatial orientations in combination with the information from the mapkey to develop more sophisticated understandings. Forexample, these skills would help with noticing that volcanoes only are located over earthquakes of a specificdepth. Low spatial learners eventually discussed depths,but only after first verbalizing they were seeing colors.Low spatial learners seemed unable to analyze the imageson the SE to make proper interpretations of the earthquake data, and thus did not get to the level of makinginferences.In SE, the dots located on the seismic activity map torepresent the earthquakes had two meanings. Accordingto the key, the dot had a color that was meant to indicate the depth at which the earthquake occurred. In addition, the size of the dot indicated the magnitude of theearthquake. The key showed how the color and the size ofthe dot should be interpreted (Fig. 4). This pairing of twotypes of information resulted in misinterpretations by thestudents when they conflated the unique meanings of thedots’ size and color. To connect the SE visualization toFig. 4 Seismic explorer earthquake keythe Earth-related phenomena, students would likely needto use spatial visualization skills to connect informationfrom the key to data in the map.
Epler‑Ruths et al. Cogn. Research(2020) 5:61Throughout the interviews, there were clear differencesin the ability of high spatial learners to notice relationsbetween colors and Earth features compared to low spatial learners. For example, here is an episode where a highspatial student, Bob (control), looked at the first screenwith earthquake data embedded on the world map, withthe key on the screen (See Table 3c). The earthquakes arerepresented as colored dots; the key explains that different colors represent different depths.Researcher: So, what else with regard to the key doyou see here? [looks at earthquake data on the mapand key that relates to the data].BOB: It looks like that there is less depth when it isabove oceanic crust. Umm—yeah cause most depthwas along inland.Here Bob appeared to use visual orientation to noticethat the earthquakes above
inking spatially is complex as it involves various aspects of spatial abilities including mental rotation of objects, perception of one’s location in a setting, and visualization of how material would fold or unfold (Liben and Titus 2012; National Research Council 2006). ere is no consensus


![project2 Encase.pptx [Read-Only]](/img/12/project2-encase.jpg)