Transcription
Impact AidPayments OverviewFiscal Year 2020Section 7003 – Basic Support
Table of ContentsOverview . 1Alabama . 4Alaska . 5Arizona . 7Arkansas . 10California. 11Colorado . 15Connecticut . 15Delaware . 16Florida . 16Georgia . 17Hawaii . 18Idaho . 18Illinois . 19Indiana . 20Iowa. 20Kansas . 21Kentucky . 22Louisiana . 23Maine . 23Maryland . 24Massachusetts . 25Michigan . 25Minnesota . 26Mississippi . 27Missouri . 28Montana . 29Nebraska . 32Nevada . 33New Jersey . 34New Mexico . 35New York . 37North Carolina . 39North Dakota. 41Ohio . 42Oklahoma . 431
Oregon . 50Pennsylvania . 51Puerto Rico . 51Rhode Island . 52South Carolina . 52South Dakota . 53Tennessee . 54Texas . 55Utah . 57Vermont . 58Virgin Islands . 58Virginia . 59Washington . 61West Virginia . 63Wisconsin. 63Wyoming . 64Glossary . 652
OverviewAbout This PublicationIn this publication, the National Association of Federally Impacted Schools (NAFIS) catalogs how Section 7003 funds for FiscalYear (FY) 2020 were distributed to federally impacted school districts across the United States and its territories, based oninformation from the U.S. Department of Education Impact Aid payment database. At the time of writing in February 2022, FY2020 is the most recent year that final payments have been made to federally impacted school districts.The report features a list of school districts, by state, that received payments for Section 7003 – Basic Support, as well as keyImpact Aid-related data for each of those districts, including the payment the district received and the amount it would havereceived if the program were fully funded. In addition, the report includes the LOT percentage, total average daily attendance(ADA), total federally connected students in ADA by type, disability payment, and congressional district for each school district.Impact AidU.S. public school districts are financed through a combination of state and local revenue. Local funding comes from acombination of business and residential property taxes and fees and local sales tax.Because Federal land is exempt from taxation (as are many of the businesses and facilities located on that land), the land placesa financial burden on local school districts and taxpayers.School districts with Federal property—such as military installations, Indian Trust or Treaty lands, Federal low-rent housing andnational laboratories, national parks and other Federal buildings and lands—lose local revenue because of these non-taxableFederal activities. Impact Aid is a Federal education program that partially reimburses federally impacted school districts—thoselocated on or near Federal property—for this loss of locally-derived revenue. It ensures these districts are not at a financialdisadvantage and that the students they serve have access to the opportunities they need to meet their full potential.Impact Aid funding is direct, locally controlled and flexible. It goes directly to school districts, bypassing state involvement, andis used to support all students in the district, just like local tax revenue. It can be used for any general fund purpose, such asinstructional materials, teacher salaries, transportation, technology, social-emotional supports, extracurricular activities andfacilities. All decisions on how Impact Aid funds are spent are made locally, allowing great flexibility to ensure funds are targetedwherever needs are greatest.1
For FY 2020, Congress appropriated approximately 1.49 billion for Impact Aid, across five line items:Section7002 – Federal Property7003 – Basic Support7003(d) – Children with Disabilities7007 – Construction7008 – FacilitiesAppropriations 75.31 million 1.34 billion 48.32 million 17.41 million 4.84 millionNote: Appropriations increased in FY 2021Section 7003 – Basic SupportBasic Support payments reimburse school districts for the loss of tax revenue that occurs when families of students live or workon Federal property. Federally connected students include children of members of the uniformed services, children who reside onIndian lands, children who live in Federal low-rent housing and children whose parents are civilians working and/or living onother Federal land. There is additional funding dedicated to children of members of the uniformed services or children living onIndian lands who have disabilities.According to data from FY 2018, over half of Section 7003 recipients (52% or 562 total) are located in rural areas, compared to57% for the nation as a whole. In addition, 20% (or 221 school districts) are located in towns, which is similar to the nationalnumber of 18%, and 16% (or 171 districts) are suburban, which is closer to the national number of 20% than 7002. Twelvepercent of all 7003 districts are in cities, compared to 5% of districts nationally.Section 7003 is the largest component of the Impact Aid program in regards to both funding and the number of school districtsserved. To be eligible, a school district must educate at least 400 federally connected students in its average daily attendance(ADA), or those students must comprise at least three percent of its ADA.The Federal Government uses a formula to determine the amount of Section 7003 funding that a school district should receive—its full funding payment, also known as its maximum payment. Recognizing that there is varying tax loss associated with where afederally connected student lives, this formula assigns different weights for different categories of students: Indian lands,military on-base, military off-base, low-rent housing, civilian parent living and working on Federal land, and civilian parent livingor working on Federal land.Impact Aid has not been fully funded since 1969, which means school districts do not receive their full funding payments. Todistribute the available funds by need, Congress developed a formula known as the Learning Opportunity Threshold (LOT), whichmeasures how dependent a school district is on Impact Aid. Each district has a LOT percentage determined by the percent ofFederal students in its ADA and the percent that the maximum Impact Aid payment is of the district’s total current expenditures(TCE). The higher that percentage, the more of its full funding payment a district receives.2
FY 2020 Section 7003 – Basic Support National SnapshotFor FY 2020, Congress appropriated approximately 1.3 billion ( 1,340,242 to be exact) for Basic Support. It also appropriated 48.32 million to support special education services for military and Indian lands students.1,010 school districts are part of the Section 7003 – Basic Support program. Their calculated need totaled 2.23 billion.Note: This information comes from the U.S. Department of Education and is based on FY 2020 data.About NAFISThe National Association of Federally Impacted Schools (NAFIS) represents the 1,100-plus federally impacted public schooldistricts that together educate more than 9 million students across the nation. Federally impacted school districts are thoselocated on or near nontaxable Federal property—including military installations; Indian Trust, Treaty and Alaska Native ClaimsSettlement Act lands; Federal low-rent housing facilities; and national parks, national laboratories and other Federal buildingsand property. These school districts, which are demographically and geographically diverse, receive Impact Aid, a Federaleducation program that reimburses school districts for the lost local revenue and additional costs associated with the presence ofFederal property. To learn more, visit www.nafisdc.org.3
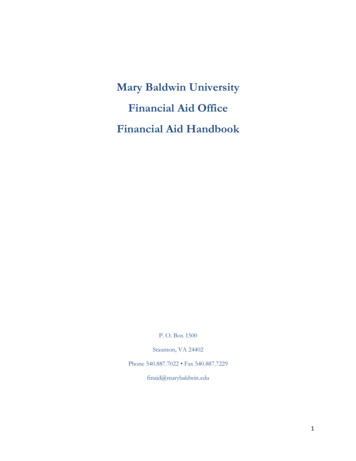
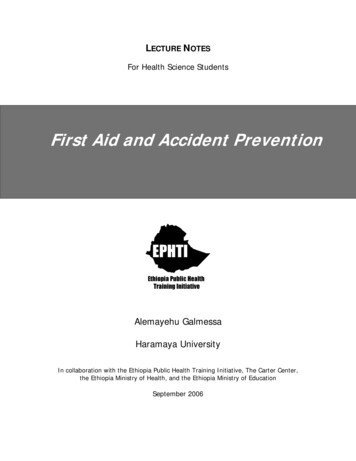
AlabamaImpact Aid Fiscal Year 2020 Section 7003 – Basic Support Final PaymentsSchool DistrictCDLOTFY20 PaymentAnniston City SchoolsAutauga County Board ofEducationDaleville City Board of Education315% 25,352.29Enterprise City School System 59,847.98Full FundingPayment 153,052.94 yCiviliansIndianLandsDisabilityPayment-48% 11,357.50420% 92,191.67 154,530.281,04519551129-15 7,382.50236% 759,999.64 2,022,485.285,1721,700815831-54 31,234.50Eufaula City Board of EducationFairfield City Board of EducationGadsden City Schools27414%13%4% 26,685.32 16,275.95 6,709.85 181,417.96 114,051.03 Huntsville City Schools512% 215,117.51 1,610,010.5624,0882,7833282,009-446 12,493.50474474--- 242,262.55Lee County Board of Education36% 34,851.94 560,209.229,284Macon Co. Board of EducationMadison City SchoolsMadison Co. Board of Education35510%27%14% 12,124.96 352,023.38 139,407.77 108,141.65 1,240,378.85 1452,5002,402-2321 24,987.00 567.50Marion County Board of Education46% 7,404.99 106,368.843,310180---180-Opelika City Board of Education36% 11,238.20 154,825.754,561262---262-Ozark City Schools213% 54,225.77 197,373.292,06544239203-200 2,271.50Perry County Board of Education75% 6,003.17 41,365.661,319664--62 2,271.50796435--361 14,197.00Phenix City Board of Education313% 99,626.38 727,444.677,038Piedmont City Board of Education38% 4,949.74 52,593.481,15189---89-Russell County Board of Education18% 28,109.08 297,832.753,456252252--- 13,062.00Sylacauga City Board of Education38% 10,108.31 90,413.511,99715311-151- 1,962,253.90 9,506,714.94TOTAL 362,087.054
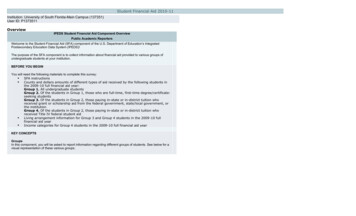
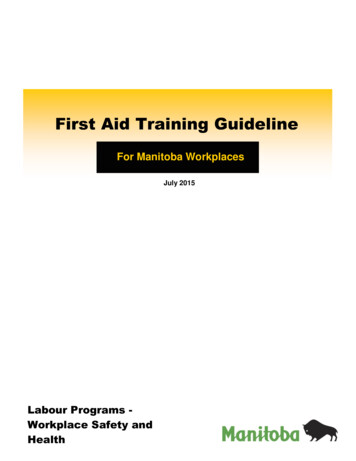
AlaskaImpact Aid Fiscal Year 2020 Section 7003 – Basic Support Final PaymentsAlaska Gateway SchoolsAlaska State Department ofEducation & Early DevelAleutian Region School DistrictAleutians East Bor. SchoolDistrictAnchorage School DistrictAL38% 472,209.38 1,203,564.82381TotalFederalEnrollment133AL99% 34,731,126.06 34,731,126.404,0623,8783,663-215- 502,901.50AL35% 46,153.79 66,251.27196--6- 1,120.50AL100% 2,230,459.30 2,230,459.57235202--202- 36,961.50AL4% 109,966.80 2,319,677.9544,5941,4501,176--274 90,723.50Annette Island School DistrictAL100% 5,653,441.87 5,653,442.00320320--320--Bering Strait School DistrictBristol Bay Borough SchoolDistrictChatham School DistrictAL100% 17,689,090.12 17,689,090.262,0091,602--1,602- 159,046.50AL30% 112,311.43 253,521.5410425-1222-AL42% 174,478.77 325,514.5916759-25286 2,240.00Copper River School DistrictAL52% 478,779.45 904,992.414401772807718 17,920.50Cordova City School DistrictAL18% 35,833.49 183,736.8733155214-30 3,920.00Craig City School DistrictAL52% 721,825.79 1,351,526.00508180-60120- 28,001.00Delta/Greely School DistrictAL43% 332,834.69 747,314.37812305101204-- 8,400.00Denali Borough School DistrictAL14% 5,834.42 25,617.1622330327---Dillingham City School DistrictFairbanks-North Star Bor.School DistrictGalena City School DistrictGreater Sitka Borough SchoolDistrictIditarod Area School DistrictAL56% 587,255.91 1,024,686.38469218-1168220 29,121.50AL6% 94,978.28 1,268,491.0713,6431,384718666-- 49,282.00AL10% 489,596.42 2,009,621.995,048182--182- 26,881.50AL13% 71,683.41 425,774.861,207134742-58 2,240.00AL52% 722,256.36 1,351,526.00347138220116- 33,601.50Kake City School DistrictAL66% 383,099.76 574,177.7110452--52- 12,321.00Kashunamiut School DistrictAL100% 3,345,689.46 3,345,689.36318303--303- 35,842.00Klawock City School DistrictKodiak Island Borough SchoolDistrictKuspuk School DistrictAL100% 835,207.35 835,207.7311291-1675- 16,801.00AL9% 51,336.52 509,693.142,376359123171-65 37,522.00AL100% 3,743,196.72 3,743,197.00403339--339- 60,482.50Lake & Peninsula School DistrictAL54% 947,766.47 1,441,186.06357162-112734 23,521.00School DistrictCDLOTFY20 PaymentFull andsDisabilityPaymentMilitaryCivilians-24109- 36,961.505
Alaska (Continued)Impact Aid Fiscal Year 2020 Section 7003 – Basic Support Final PaymentsSchool DistrictLower Kuskokwim SchoolDistrictLower Yukon School DistrictCDLOTFY20 PaymentFull tMilitaryCiviliansIndianLandsLowRentHousing82,732- 375,216.00AL86% 26,438,953.03 30,237,081.624,2842,740-DisabilityPaymentAL100% 16,043,849.83 16,043,850.282,0181,453--1,453- 201,608.50Nome School DistrictNorth Slope Borough SchoolDistrictNorthwest Arctic SchoolDistrictPribilof School DistrictAL35% 118,325.10 155,911.33721243-228-15-AL62% 7,014,548.29 11,127,564.042,1981,028--1,00622 117,605.00AL64% 6,773,781.95 10,320,623.522,1011,169-123925121 133,285.50AL100% 894,391.95 894,392.208181--81- 12,321.00Southwest Region SchoolsAL100% 5,325,719.26 5,325,719.11602509--48029 95,204.50Tanana City School DistrictAL40% 23,547.95 29,592.245019-172- 1,120.50Unalaska City School DistrictAL7% 28,979.20 209,795.7042119--19--Valdez City SchoolsAL5% 10,996.83 143,102.756692525----Wrangell Public SchoolsAL6% 2,015.47 14,133.6130340-24-16-Yakutat School DistrictAL23% 32,498.14 79,501.538617-3410 1,120.50Yukon Flats School DistrictYukon Koyukuk SchoolDistrictYupiit School DistrictAL100% 2,226,249.70 2,120,040.78235192--192- 66,083.00AL41% 1,702,676.97 4,039,119.362,056451138-313- 64,962.50AL100% 5,035,096.40 5,035,096.85457456--456- 47,042.00TOTAL 145,738,042.09 169,990,611.43 2,331,381.506
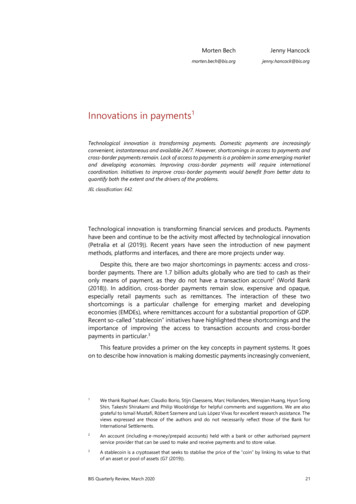
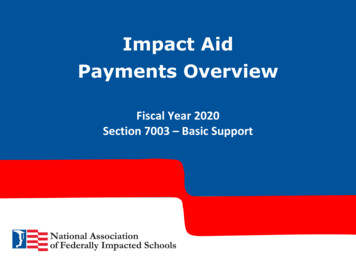
ArizonaImpact Aid Fiscal Year 2020 Section 7003 – Basic Support Final PaymentsAkimel O'Otham Pee Posh (3-4)1100% 538,875.50 59,658.8511TotalFederalEnrollment11-38-Akimel O'Otham Pee Posh (K-2)1100% 106,731.15 66,712.111111-29--AZ Compass Schools, Inc.Baboquivari Unified SchoolDistrictBerean Academy948% 190,573.18 389,398.8816353--53- 9,038.003100% 8,118,599.25 8,118,599.291,1151,115-101,105- 208,994.0026% 9,674.47 23,510.88385442024---Blue Ridge Unified School DistrictCamp Verde Unified SchoolDistrict #28Casa Grande Union High SchoolDistrict #82Cedar Unified School District #25132% 978,990.95 2,453,947.662,011334--334- 41,798.50120% 237,163.79 1,124,113.751,500182-29153- 32,761.5019% 136,115.94 1,278,403.873,539174--174- 55,355.001100% 1,094,724.51 1,094,725.15149149--149- 37,280.00Chinle Unified School District #243100% 27,103,630.70 27,103,631.493,6893,689--3,689-49% 88,633.26 161,637.2745022--22- 5,648.50913% 126,413.41 88,165.7814412--12- 3,389.50118% 285,184.90 1,484,124.032,178202--202- 24,853.50823% 29,506.75 71,708.17330642836-- 3,389.00160% 461,283.39 756,756.31319103--103- 11,297.00115% 680,390.34 4,201,981.279,085870--546324 105,062.502100% 6,758,244.83 6,758,245.00902895793102-- 125,397.001100% 4,334,818.23 4,334,817.72643590--590- 127,656.00627% 415,548.05 1,454,735.441,384198--198- 39,539.501100% 10,440,297.66 10,440,298.281,4211,421--1,421- 128,786.00128% 156,789.48 528,994.7142172--72- 4,518.501100% 186,343.74 95,512.931513--13--145% 1,237,112.96 2,667,014.971,704363--363- 15,815.50179% 783,714.51 975,701.34289179-179---School DistrictClarksdale-Jerome School District#3Coconino County AccommodationSchool DistrictCoolidge Unified School District#21Crown Charter SchoolDestiny School, Inc.Flagstaff Unified School District#1Fort Huachuca AccommodationSchoolsFort Thomas Unified SchoolsFountain Hills Unified SchoolDistrict #98Ganado Unified School District#20Gila Bend Unified School District#24Gila County Regional SchoolDistrict No. 49Globe Unified School District #1Grand Canyon Unified SchoolDistrict #4CDLOTFY20 PaymentFull anLandsLowRentHousingDisabilityPayment 18,075.00 495,938.507
Arizona (Continued)Impact Aid Fiscal Year 2020 Section 7003 – Basic Support Final PaymentsSchool DistrictHa:san Preparatory & LeadershipSchoolHolbrook Unified School District#3Imagine Coolidge Elementary,Inc.Juniper Tree AcademyKayenta Unified School District#27Leman Academy of Excellence,Inc.Liberty High SchoolLitchfield Elementary SchoolDistrict #79Maricopa Unified School DistrictMcNary Elementary SchoolDistrict #23Mesa Unified School District #4Mohave Valley ElementarySchool District #16Page Unified School District #8CD3LOT92%FY20 PaymentFull tMilitaryCiviliansIndianLandsLowRentHousing09640 439,347.59 470,217.5211373183% 5,889,067.13 6,976,852.391,976950-294817% 69,533.79 168,984.4263923--23314% 110,612.97 243,337.568881698386-1100% 13,026,494.70 13,026,494.611,7731,773--1,773124% 75,010.42 293,592.063,079461126335-839% 69,533.98 168,984.4213123--2335% 45,151.79 767,630.0911,318409409--18% 159,011.43 1,797,112.577,294263--2431100% 1,109,418.97 1,109,419.45151151--15193% 220,288.71 5,951,190.4362,465810--810416% 279,105.04 678,288.771,054942-9220-DisabilityPayment 28,242.00 145,731.00 2,259.00 4,519.00 250,793.50 7,908.00 29,937.00 58,744.50 22,593.50 259,830.50 11,297.00179% 6,540,376.66 8,199,417.932,5621,116--1,116- 232,718.50Painted Desert Demo ProjectsParker Unified School District#27Peach Springs Unified District#8Pillar Charter School, Inc.1100% 925,740.56 925,740.73146126--126- 18,075.00935% 44,204.47 58,777.19Pinon Unified School District #4Red Mesa Unified School District#27Sacaton Elementary SchoolDistrict #18Salt River-Pima-MaricopaCommunity SchoolSan Carlos Unified SchoolDistrict #20Sanders Unified School District#181100% 8,089,210.91 8,089,210.701100% 3,688,269.28 3,688,268.641100% 4,768,298.916100%11-4100% 7,670,422.69 7,670,423.221,8351,044--1,0444100% 1,909,782.40 1,572,289.82214214--2144110-28--1,1011,101--1,101- 144,602.00502502--502 4,768,299.49663649--649 1,917,606.06 1,917,605.81317275-14261100% 11,204,401.96 11,204,401.741,5251,525--1,525100% 4,966,673.13 4,966,672.51727676--676-- 216,902.00 23,723.50 77,949.50 188,660.00 55,355.00 260,961.00 100,543.008
Arizona (Continued)Impact Aid Fiscal Year 2020 Section 7003 – Basic Support Final PaymentsSchool DistrictShonto Governing Board ofEducation, Inc.Sierra Vista Unified SchoolDistrict #68Skyline Gila River LLCSomerton School District #11Sonoran Science AcademyDavis MonthanStanfield Elementary SchoolDistrict #24StrengthBuilding Partnersdba Las Puertas CommunitToltecalli High SchoolTombstone Unified SchoolDistrict #1Topock Elementary SchoolTuba City Unified SchoolDistrictTucson Unified SchoolDistrictVail School District #20Valentine Elementary SchoolDistrict #22Vector School District, Inc.Whiteriver Unified SchoolDistrict #20Window Rock Unified SchoolDistrict #8Winslow Unified School Dist.#1Yuma Elementary SchoolDistrict #1TOTALCDLOTFY20 PaymentFull tMilitaryCiviliansIndianL
School Board of Brevard Co. Florida . North Hanover Township Board of Education 3 100% 10,312,810.04 10,312,810.14 1,113 788 759 29 - - 121,091.50 Northern Burlington County Regional School Dist. 3 39% 2,370,087.03 5,966,087.76 2,187 556 467 89 - - 56,019.50 . McKenzie Special School District