Transcription
Ministry ofEducationSample Tests forEffective AssessmentGrades 1 – 6 Ministry of Education 20111-6 AssesmentTests copy.indd 13/12/12 11:21:26 AM
AcknowledgementsThe handbook: Sample Tests for Effective Assessment is a direct response by the Ministry of Educationto enhance and expand teachers’ knowledge and practice in assessing students.This handbook has taken a significant amount of time to complete. Groups of individuals worked assiduously to ensure that items are closely aligned to the Revised Primary Mathematics Curriculum. Theyhave contributed to the intellectual stimulus which aided the successful completion of this exercise.The Ministry wishes to extend earnest thanks to the expert who initiated, planned and prepared thisimportant document. Special thanks to the Mathematics Specialists for their invaluable contributionsto the development of these sample test items. They undertook the most time-consuming chore ofconstructing these sample test items. Their efforts are greatly appreciated.The Ministry is grateful to the team of officers from the Core Curriculum Unit of the Ministry ofEducation for their priceless assistance, and Ms. Jean Hastings – Director of Education Systems Transformation Programme (Ministry of Education); who chairs the National Comprehensive NumeracyProgramme Committee.In all these endeavours, it becomes manifest that “except the Lord build the house, they labour invain that build it”. Therefore, the Ministry’s personnel want to thank God for his guidance throughthe process.Finally, our thanks to all other persons whose names do not appear, but who made valuable contributions to the development of the handbook.Seymour HamiltonNational Mathematics CoordinatorApril 20112Sample Tests for Effective Assessment – Grades 1 – 61-6 AssesmentTests copy.indd 23/12/12 11:21:27 AM
TABLE Of ContentsINTRODUCTION5GRADE ONE END OF YEAR SAMPLE TEST8Table of Specification: Section A8Table of Specification: Section B8Sample End of Year Test – Section A9Sample End of Year Test – Section B17Sample End of Year Test – Answer Sheet19GRADE TWO END OF YEAR SAMPLE TEST20Table of Specification: Section A20Table of Specification: Section B21Sample End of Year Test – Section A22Sample End of Year Test – Section B32Sample End of Year Test – Answer Sheet35GRADE THREE END OF YEAR SAMPLE TEST36Table of Specification: Section A36Table of Specification: Section B37Sample End of Year Test – Section A38Sample End of Year Test – Section B52Sample End of Year Test – Answer Sheet54GRADE FOUR END OF YEAR SAMPLE TEST55Table of Specification: Section A55Table of Specification: Section B56Sample End of Year Test – Section A57Sample End of Year Test – Section B71Sample End of Year Test – Answer Sheet73Ministry of Education, 20111-6 AssesmentTests copy.indd 333/12/12 11:21:27 AM
GRADE FIVE END OF YEAR SAMPLE TEST74Table of Specification: Section A74Table of Specification: Section B74Sample End of Year Test – Section A75Sample End of Year Test – Section B85Sample End of Year Test – Answer Sheet88GRADE SIX END OF YEAR SAMPLE TEST489Table of Specification: Section A89Table of Specification: Section B90Sample End of Year Test – Section A91Sample End of Year Test – Section B103Sample End of Year Test – Answer Sheet106Sample Tests for Effective Assessment – Grades 1 – 61-6 AssesmentTests copy.indd 43/12/12 11:21:27 AM
INTRODUCTIONOne of the major challenges that now exists in many primary schools is that the result from internal assessment cannot always be interpreted as an accurate reflection of a child’s mastery level of the ideas he/sheencountered at that grade level. This has resulted from the fact that many assessment instruments are toonarrow in their assessment of the curriculum (the instruments test students on only a few topics/strands)or, weighting of items on instruments does not reflect the curriculum weighting of objectives and topics.Therefore, the creation of this handbook features six sample test papers which were designed to test students at the end of an academic year. This means that they are intended to be summative tests developedto summarize student attainment after completing a particular grade level. It is hoped that having administered the End of Year Test, teachers will be able to ascertain the extent to which students have achievedthe objectives at the end of the school year/grade level.A sample for each grade level is included. The sample tests consist of two sections: Section A comprisesmultiple choice (selected – response type) items while Section B comprises structured/open-ended(constructed – response type) items. Items on the tests are related to the attainment targets in the RevisedPrimary Curriculum (RPC). Within the RPC, all the attainment targets for each grade level describe theknowledge and skills that are to be taught. This was a major factor in designing the tests. The suggesteddistribution of the items is shown in the tables below:GRADES 1 – 3STRANDSATTAINMENT TARGETSNumber Understand the idea of sets.PERCENTAGES OF QUESTIONSGRADE 1GRADE 2 GRADE 350 – 60 %50 – 60 %50 – 60%15 – 20 %15 – 20 %15 – 20 %5 – 10 %5 – 10 %5 – 10 %5 – 10 %5 – 10 %5 – 10 %10 – 15%10 – 15%10 – 15% Know the value of numerals and associatethem, their names, numbers and ordinals. Use the basic operations with numbersand number patterns. Use mathematical symbols for comparisonand decision ility Demonstrate an understanding of the useand value of money.Estimate, compare and use the various types ofmeasurement.Explore paths and/or shapes in the environment and relate basic mathematical shapes toeveryday life.Demonstrate the use of variables in mathematical sentences.Collect, organize and interpret information inpractical situations and use simple probabilitylanguage.Ministry of Education, 20111-6 AssesmentTests copy.indd 553/12/12 11:21:27 AM
GRADES 4 – 6STRANDSATTAINMENT TARGETSNumber Know and use the values of numerals andassociate them with their names, numbers andordinals.PERCENTAGE OF QUESTIONSGRADE 4 GRADE 5 GRADE645 – 50 %45 – 50 %45 – 50 % Demonstrate the understanding of fractionalideas. Explain the process of the basic operations, useestimation with basic operations. Operate with numbers and number patterns. Explain the process of the basic operations,use estimation appropriately and demonstrateproficiency with the basic facts. Model patterns, expressions and numberrelationships using concrete objects. Make and interpret Venn Diagrams. Use computation, estimation and calculatorsappropriately to solve real world problemsincluding problems with fractions and decimals. Use models to express their conceptualunderstanding of rational numbers (fractions).Measurement Explain and carry out the processes of estimationand measurement, including the selection ofappropriate precise units.20 – 22%20 – 22%20 – 22%12 – 15%12 – 15%12 – 15% Select appropriate units and tools to measure tothe desired degree of accuracy. Derive informally and use formulae formeasurement situations.Geometry Identify, describe, compare and classify geometricfigures and their properties. Select appropriate units and tools to measureangles to the desired degree of accuracy. Describe the relationships between andamong geometrical figures and explain spatialrelationships. Make generalizations about geometricrelationships and explore geometrictransformation.6Sample Tests for Effective Assessment – Grades 1 – 61-6 AssesmentTests copy.indd 63/12/12 11:21:27 AM
Algebra Explain the meaning and use of simple formulae.8 – 10%8 – 10%8 – 10%10 – 12%10 – 12%10 – 12% Use open sentences to express relationshipsamong quantities, model and explain the solutionof simple equations, using diagrams and concretematerials. Identify and explain basic algebraic concepts. Interpret expressions and equations involvingvariables.Statistics/Probability Collect, organize, graph, describe and interpretdata in a problem-solving context. Identify and apply the mean average as a measureof central tendency. Explore the concept of chance. Make and interpret a variety of graphs, charts andtables. Explore complex problems by gathering statisticsfrom real-world situations. Distinguish among and apply the appropriatemeasures of central tendency (mean, median,mode) and dispersion (range). Design questionnaires and conduct datacollections chart relationships, present findingsand make statements about the data.Each test is accompanied by a table of specification, guidelines for marking, item distribution andan answer sheet. When writing mathematics tests, there is need to consider elements such as: Weighting of each strand in relation to the Mathematics Curriculum Level of question, for example, recall, use of knowledge, etc. Relevance of the questions Table of specification Rubric Item distributionIt is the hope that as you become familiar with the content of this book, you will find it helpfulas you go about the business of mathematics assessment as a tool that will produce numeratestudents who will contribute to our society.Ministry of Education, 20111-6 AssesmentTests copy.indd 773/12/12 11:21:27 AM
GRADE ONE END OF YEAR SAMPLE TESTTable of Specification: Section ASECTION A – MULTIPLE CHOICESection A comprises 28 multiple-choice items covering the five strands of the curriculum.All items are weighted equally and together are worth 28 marks.STRANDSNumberSimple Recall/KnowledgeMathematicalReasoningTotal # ofItems10(Ques. 2, 7, 9,10, 11,12, 13, 14, 19, 20)1(Ques. 25)16Use of Knowledge5(Ques. 1, 3, 26, 27, 28)Measurement1(Ques. 4,)3(Ques. 8, 17, 22)1(Ques. 23)5Geometry1(Ques. 5)-1(Ques. 21)2Algebra--2(Ques. 6,18)2Statistics1(Ques. 15)1(Ques. 16)1(Ques. 24)3814628Total # of ItemsTable of Specification: Section BSECTION BSection B comprises 5 structured questions covering four of the five strands of the curriculum.Students are required to answer all questions. Questions are weighted differently giving a total of12 marks.Use of KnowledgeMathematicalReasoningTotal # ofMarks5(Ques. 3, Ques. 4a, 4b)-5-2(Ques. 2a, 2b)-22(Ques. 1a, 1b)--2Algebra----Statistics1(Ques. 5a)2(Ques. 5b, 5c)39STRANDSSimple Recall/KnowledgeNumberMeasurementGeometryTotal # of Marks83012Sample Tests for Effective Assessment – Grades 1 – 61-6 AssesmentTests copy.indd 83/12/12 11:21:27 AM
Sample End of Year Test – Section AGrade OneMathematicsSample End of Year TestName: Date:SECTION ACIRCLE THE CORRECT ANSWER FOR EACH OF THE FOLLOWING.1.Which of these is the numeral six?a) 22.c) 6d) 9Which of these two numbers add to make 7?a) 4 43.b) 5Theb) 4 3c) 4 2d) 4 1is the .a) 4th pictureb) 3rd picturec) 2nd pictured) 1st picture4.Which of the following would you use to measure the size of your waist?a)b)c)d)Ministry of Education, 20111-6 AssesmentTests copy.indd 993/12/12 11:21:31 AM
5.What is the name of this shape?a) triangle6.c) 5d) 11c) —32d) —3b)12:02c) 2:00d) 12:00b) 6 7c) 5 9d) 4 41b) —4Which is true?a) 8 710b) more than 5What time is shown on the clock?a) 2:129.d) squareWhat fraction is shaded?1a) —28.c) circleN 1 5; what is N?a) less than 57.b) diamondSample Tests for Effective Assessment – Grades 1 – 61-6 AssesmentTests copy.indd 103/12/12 11:21:31 AM
10. The diagrams show how sweets are shared among friends.What fraction does each person receive?2a) —21b) —21c) —31d) —411.Which number is next?2, 4, 6,a) 712.b) 8c)12d) 246c) 60d) 70Which number is missing?10, 20, 30, , 50,a) 10b) 40Ministry of Education, 20111-6 AssesmentTests copy.indd 11113/12/12 11:21:32 AM
13.The mangoes below can be grouped as:a)14.b)c)d)Arrange the numbers 7, 3, 6, 12 from the smallest to the largest.a) 3, 6, 7, 12b) 3, 12, 7, 6c) 3, 7, 6, 12d) 12, 7, 6, 3The table below shows the number of coloured pencils sold inGrade 1B. Using the table, answer questions 15 and 16.BlueYellow7Red4Purple15.How many blue pencils were sold?16.How many purple and red pencils were sold altogether?a) 1412b) 13c) 12a) 9b) 7c) 5d) 4d) 11Sample Tests for Effective Assessment – Grades 1 – 61-6 AssesmentTests copy.indd 123/12/12 11:21:32 AM
17.Which of the following is as tall as this ruler?a)b)c)d)18.Mary had 8 balls. She gave ‘n’ of them to Sam and had 5 left.Which mathematical sentence shows this?a) 8 n 5b) n 5 5c) 8 – n 5d) n – 8 5Ministry of Education, 20111-6 AssesmentTests copy.indd 13133/12/12 11:21:33 AM
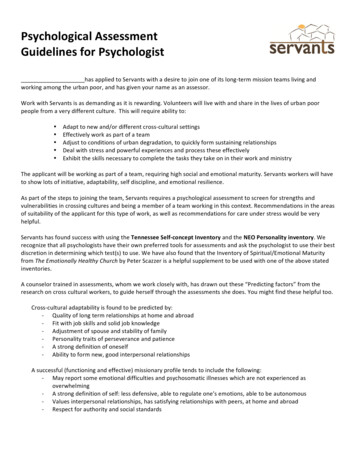
19. How many socks are needed for the four children?a) 16b) 8c) 6 d) 420. There are 7 cats in a room. 3 are sleeping. The others are playing.How many cats are playing?a) 1b) 3c) 4d) 721. What should the next picture be?a)b)c)d)14Sample Tests for Effective Assessment – Grades 1 – 61-6 AssesmentTests copy.indd 143/12/12 11:21:34 AM
Look at the calendar below then answer questions 22 and 23AUGUST 2728293031Which day is the 17th of August?a) Sundayb) Wednesdayc) Fridayd) Saturday23.What will be the first day of the next month?a) Thursdayb) Sundayc) Tuesdayd) Friday24.What is the chance of Thursday coming before Tuesday in the same week?a) certainb) maybec) imposibled) likely25.5 tomato plants are in one row. 6 corn plants are in the same row. How many more cornplants are there than tomato plants?a) 1b) 3c) 6d) 11Ministry of Education, 20111-6 AssesmentTests copy.indd 15153/12/12 11:21:34 AM
26.Which position is the stop sign in?a) 1stb) 2ndc) 3rdd) 4th27.Which number is one more than 43?a) 41b) 42c) 44d) 4528.Write 33 in words.a) thirty-threeb) twenty- threec) thirteend) three16Sample Tests for Effective Assessment – Grades 1 – 61-6 AssesmentTests copy.indd 163/12/12 11:21:34 AM
Sample End of Year Test – Section BGrade OneMathematicsSample End of Year TestName: Date:SECTION BANSWER ALL QUESTIONS IN T
GRAdE onE End of YEAR SAmPlE TEST Table of SpecificaTion: SecTion a SECTION A – MULTIPLE CHOICE Section A comprises 28 multiple-choice items covering the five strands of the curriculum. All items are weighted equally and together are worth 28 marks. STRANDS Simple Recall/ Knowledge Use of Knowledge Mathematical Reasoning Total # of Items Number 5 (Ques. 1, 3, 26, 27, 28) 10 (Ques.
![Hardness Tests [3]](/img/2/lmcm2-aula3.jpg)