Transcription
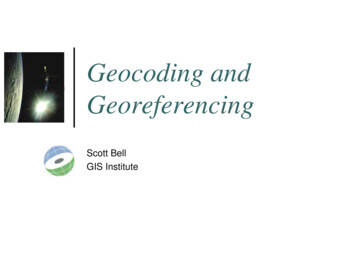
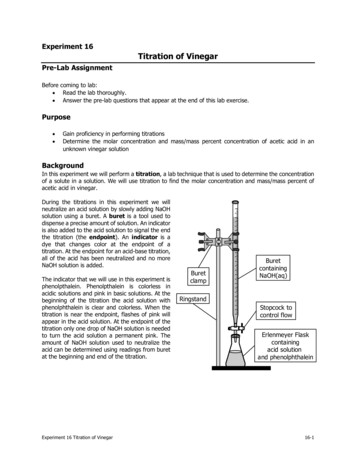
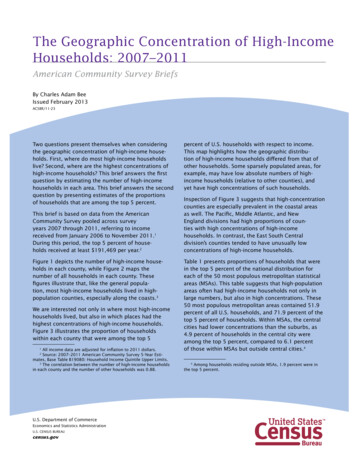
The Geographic Concentration of High-IncomeHouseholds: 2007–2011American Community Survey BriefsBy Charles Adam BeeIssued February 2013ACSBR/11-23Two questions present themselves when consideringthe geographic concentration of high-income households. First, where do most high-income householdslive? Second, where are the highest concentrations ofhigh-income households? This brief answers the firstquestion by estimating the number of high-incomehouseholds in each area. This brief answers the secondquestion by presenting estimates of the proportionsof households that are among the top 5 percent.This brief is based on data from the AmericanCommunity Survey pooled across surveyyears 2007 through 2011, referring to incomereceived from January 2006 to November 2011.1During this period, the top 5 percent of households received at least 191,469 per year.2Figure 1 depicts the number of high-income households in each county, while Figure 2 maps thenumber of all households in each county. Thesefigures illustrate that, like the general population, most high-income households lived in highpopulation counties, especially along the coasts.3We are interested not only in where most high-incomehouseholds lived, but also in which places had thehighest concentrations of high-income households.Figure 3 illustrates the proportion of householdswithin each county that were among the top 5All income data are adjusted for inflation to 2011 dollars.Source: 2007–2011 American Community Survey 5-Year Estimates, Base Table B19080: Household Income Quintile Upper Limits.3The correlation between the number of high-income householdsin each county and the number of other households was 0.88.1percent of U.S. households with respect to income.This map highlights how the geographic distribution of high-income households differed from that ofother households. Some sparsely populated areas, forexample, may have low absolute numbers of highincome households (relative to other counties), andyet have high concentrations of such households.Inspection of Figure 3 suggests that high-concentrationcounties are especially prevalent in the coastal areasas well. The Pacific, Middle Atlantic, and NewEngland divisions had high proportions of counties with high concentrations of high-incomehouseholds. In contrast, the East South Centraldivision’s counties tended to have unusually lowconcentrations of high-income households.Table 1 presents proportions of households that werein the top 5 percent of the national distribution foreach of the 50 most populous metropolitan statisticalareas (MSAs). This table suggests that high-populationareas often had high-income households not only inlarge numbers, but also in high concentrations. These50 most populous metropolitan areas contained 51.9percent of all U.S. households, and 71.9 percent of thetop 5 percent of households. Within MSAs, the centralcities had lower concentrations than the suburbs, as4.9 percent of households in the central city wereamong the top 5 percent, compared to 6.1 percentof those within MSAs but outside central cities.42U.S. Department of CommerceEconomics and Statistics AdministrationU.S. CENSUS BUREAUcensus.gov4Among households residing outside MSAs, 1.9 percent were inthe top 5 percent.
2U.S. Census Bureau0100 Miles00100 MilesLess than 4343–106107–251252–883884 or moreNumber of householdsby countyNumber of High-Income Households for Each County in the United States: 2007–2011Note: The term "county" refers to a county or statistically equivalent entity.Source: U.S. Census Bureau, 2007–2011 American Community Survey.500 MilesFigure 1.
U.S. Census Bureau30100 Miles00100 MilesLess than 587 or moreNumber of householdsby countyNumber of Households for Each County in the United States: 2007–2011Note: The term "county" refers to a county or statistically equivalent entity.Source: U.S. Census Bureau, 2007–2011 American Community Survey.500 MilesFigure 2.
4U.S. Census Bureau0100 MilesPacificPacificPacific00100 MilesWESTWestSouthCentralWest NorthCentralSOUTHMIDWESTNote: The term "county" refers to a county or statistically equivalent entity.Each category contains approximately 629 counties ranked by concentrationof high-income households.Source: U.S. Census Bureau, 2007–2011 American Community Survey.Mountain500 MilesEastSouthCentralEastNorthCentralConcentration of High-Income Households for Each Countyin the United States: 2007–2011Figure ONLess than 1.012%1.012% to 1.558%1.559% to 2.159%2.160% to 3.247%3.248% or moreConcentrationby countySouthAtlanticNORTHEAST
Table 1.Concentration of High-Income Households in the 50 Most Populous MetropolitanStatistical Areas: 2007–2011(For information on confidentiality protection, sampling error, nonsampling error, and definitions, see www.census.gov/acs/www/)Metropolitan statistical 391,132,264New York-Northern New Jersey-Long Island, NY-NJ-PA . . . . . . . . . . . . . . . . . . . .Los Angeles-Long Beach-Santa Ana, CA . . . . . . . . . . . . . . . . . . . . . . . . . . . . . . .Chicago-Joliet-Naperville, IL-IN-WI . . . . . . . . . . . . . . . . . . . . . . . . . . . . . . . . . . . .Dallas-Fort Worth-Arlington, TX . . . . . . . . . . . . . . . . . . . . . . . . . . . . . . . . . . . . . . .Houston-Sugar Land-Baytown, TX . . . . . . . . . . . . . . . . . . . . . . . . . . . . . . . . . . . . .Philadelphia-Camden-Wilmington, PA-NJ-DE-MD . . . . . . . . . . . . . . . . . . . . . . . . .Washington-Arlington-Alexandria, DC-VA-MD-WV . . . . . . . . . . . . . . . . . . . . . . . .Miami-Fort Lauderdale-Pompano Beach, FL . . . . . . . . . . . . . . . . . . . . . . . . . . . . .Atlanta-Sandy Springs-Marietta, GA . . . . . . . . . . . . . . . . . . . . . . . . . . . . . . . . . . .Boston-Cambridge-Quincy, MA-NH . . . . . . . . . . . . . . . . . . . . . . . . . . . . . . . . . . . .San Francisco-Oakland-Fremont, CA . . . . . . . . . . . . . . . . . . . . . . . . . . . . . . . . . . .Riverside-San Bernardino-Ontario, CA . . . . . . . . . . . . . . . . . . . . . . . . . . . . . . . . .Detroit-Warren-Livonia, MI . . . . . . . . . . . . . . . . . . . . . . . . . . . . . . . . . . . . . . . . . . .Phoenix-Mesa-Glendale, AZ . . . . . . . . . . . . . . . . . . . . . . . . . . . . . . . . . . . . . . . . .Seattle-Tacoma-Bellevue, WA . . . . . . . . . . . . . . . . . . . . . . . . . . . . . . . . . . . . . . . .Minneapolis-St. Paul-Bloomington, MN-WI . . . . . . . . . . . . . . . . . . . . . . . . . . . . . . .San Diego-Carlsbad-San Marcos, CA . . . . . . . . . . . . . . . . . . . . . . . . . . . . . . . . . .Tampa-St. Petersburg-Clearwater, FL . . . . . . . . . . . . . . . . . . . . . . . . . . . . . . . . . . .St. Louis, MO-IL . . . . . . . . . . . . . . . . . . . . . . . . . . . . . . . . . . . . . . . . . . . . . . . . . . .Baltimore-Towson, MD . . . . . . . . . . . . . . . . . . . . . . . . . . . . . . . . . . . . . . . . . . . . . .Denver-Aurora-Broomfield, CO . . . . . . . . . . . . . . . . . . . . . . . . . . . . . . . . . . . . . . .Pittsburgh, PA . . . . . . . . . . . . . . . . . . . . . . . . . . . . . . . . . . . . . . . . . . . . . . . . . . . . .Portland-Vancouver-Hillsboro, OR-WA . . . . . . . . . . . . . . . . . . . . . . . . . . . . . . . . . .San Antonio-New Braunfels, TX . . . . . . . . . . . . . . . . . . . . . . . . . . . . . . . . . . . . . . .Sacramento—Arden-Arcade—Roseville, CA . . . . . . . . . . . . . . . . . . . . . . . . . . . . .Orlando-Kissimmee-Sanford, FL . . . . . . . . . . . . . . . . . . . . . . . . . . . . . . . . . . . . . .Cincinnati-Middletown, OH-KY-IN . . . . . . . . . . . . . . . . . . . . . . . . . . . . . . . . . . . . . .Cleveland-Elyria-Mentor, OH . . . . . . . . . . . . . . . . . . . . . . . . . . . . . . . . . . . . . . . . .Kansas City, MO-KS . . . . . . . . . . . . . . . . . . . . . . . . . . . . . . . . . . . . . . . . . . . . . . . .Las Vegas-Paradise, NV . . . . . . . . . . . . . . . . . . . . . . . . . . . . . . . . . . . . . . . . . . . . .San Jose-Sunnyvale-Santa Clara, CA . . . . . . . . . . . . . . . . . . . . . . . . . . . . . . . . . .Columbus, OH . . . . . . . . . . . . . . . . . . . . . . . . . . . . . . . . . . . . . . . . . . . . . . . . . . . .Charlotte-Gastonia-Rock Hill, NC-SC. . . . . . . . . . . . . . . . . . . . . . . . . . . . . . . . . . .Austin-Round Rock-San Marcos, TX . . . . . . . . . . . . . . . . . . . . . . . . . . . . . . . . . . .Indianapolis-Carmel, IN . . . . . . . . . . . . . . . . . . . . . . . . . . . . . . . . . . . . . . . . . . . . .Virginia Beach-Norfolk-Newport News, VA-NC. . . . . . . . . . . . . . . . . . . . . . . . . . . .Nashville-Davidson—Murfreesboro—Franklin, TN . . . . . . . . . . . . . . . . . . . . . . . . .Providence-New Bedford-Fall River, RI-MA . . . . . . . . . . . . . . . . . . . . . . . . . . . . . .Milwaukee-Waukesha-West Allis, WI . . . . . . . . . . . . . . . . . . . . . . . . . . . . . . . . . . .Jacksonville, FL . . . . . . . . . . . . . . . . . . . . . . . . . . . . . . . . . . . . . . . . . . . . . . . . . . .Memphis, TN-MS-AR . . . . . . . . . . . . . . . . . . . . . . . . . . . . . . . . . . . . . . . . . . . . . . .Louisville/Jefferson County, KY-IN . . . . . . . . . . . . . . . . . . . . . . . . . . . . . . . . . . . . .Oklahoma City, OK . . . . . . . . . . . . . . . . . . . . . . . . . . . . . . . . . . . . . . . . . . . . . . . . .Richmond, VA . . . . . . . . . . . . . . . . . . . . . . . . . . . . . . . . . . . . . . . . . . . . . . . . . . . . .Hartford-West Hartford-East Hartford, CT . . . . . . . . . . . . . . . . . . . . . . . . . . . . . . .New Orleans-Metairie-Kenner, LA . . . . . . . . . . . . . . . . . . . . . . . . . . . . . . . . . . . . .Raleigh-Cary, NC . . . . . . . . . . . . . . . . . . . . . . . . . . . . . . . . . . . . . . . . . . . . . . . . . .Salt Lake City, UT . . . . . . . . . . . . . . . . . . . . . . . . . . . . . . . . . . . . . . . . . . . . . . . . . .Buffalo-Niagara Falls, NY . . . . . . . . . . . . . . . . . . . . . . . . . . . . . . . . . . . . . . . . . . . .Birmingham-Hoover, AL . . . . . . . . . . . . . . . . . . . . . . . . . . . . . . . . . . . . . . . . . . . . .Percentage ofMSA householdsamong top5 .04.43.24.2Note: Population estimates are as of July 1, 2011.Sources: High-income concentrations are from the 2007–2011 American Community Surveys, and populations are from “Annual Estimates of the Population ofMetropolitan and Micropolitan Statistical Areas: April 1, 2010 to July 1, 2011.”U.S. Census Bureau5
Table 2 lists 25 metropolitan statistical areas with high concentrations of households among the top5 percent. Bridgeport-StamfordNorwalk, CT, had the highestconcentration of high-incomehouseholds, with 17.9 percent ofhouseholds falling in the top 5percent of the national distribution.Table 3 lists 25 MSAs with lowconcentrations of high-incomehouseholds out of the 366 MSAs.Coincidentally, two of the lowestMSAs were both named Danville. InDanville, IL, and Danville, VA, 1.1percent of each county’s households were among the top 5 percent of U.S. households by income.5SOURCE AND ACCURACYThe data presented in this reportare based on the ACS sampleinterviewed in years 2007 through2011. The estimates based on this5The estimated proportions for Danville,VA, and Danville, IL, were not statisticallysignificantly different at the 90 percent confidence level. The estimated proportion forDanville, VA, is also not statistically significantly different from the third-, fourth-, andseventh-lowest estimates. The estimate forDanville, IL, is not statistically significantlydifferent from any of the seven lowest estimated proportions.6What Is the American Community Survey?The American Community Survey (ACS) is a nationwide surveydesigned to provide communities with reliable and timely demographic,social, economic, and housing data for the nation, states, congressional districts, counties, places, and other localities every year. It has anannual sample size of about 3.3 million addresses across the UnitedStates and Puerto Rico and includes both housing units and groupquarters (e.g., nursing facilities and prisons). The ACS is conductedin every county throughout the nation, and every municipio in PuertoRico, where it is called the Puerto Rico Community Survey. Beginningin 2006, ACS data for 2005 were released for geographic areas withpopulations of 65,000 and greater. For information on the ACS sampledesign and other topics, visit www.census.gov/acs/www .sample approximate the actualvalues and represent the entirehousehold and group quarterspopulation. Sampling error is thedifference between an estimatebased on a sample and the corresponding value that would beobtained if the estimate were basedon the entire population (as from acensus). Measures of the samplingerrors are provided in the form ofmargins of error for all estimatesincluded in this report. All comparative statements in this report haveundergone statistical testing, andcomparisons are significant at the90 percent level unless otherwisenoted. In addition to samplingerror, nonsampling error may beintroduced during any of the operations used to collect and processsurvey data such as editing, reviewing, or keying data from questionnaires. For more information onsampling and estimation methods,confidentiality protection, andsampling and nonsampling errors,please see the 2011 ACS Accuracyof the Data document located at /Accuracy/ACSAccuracy of Data 2011.pdf .U.S. Census Bureau
Table 2.Concentrations of High-Income Households in the Highest-Concentration MetropolitanStatistical Areas: 2007–2011(For information on confidentiality protection, sampling error, nonsampling error, and definitions, see www.census.gov/acs/www/)Metropolitan statistical ercentage ofMSA householdsamong top5 percentBridgeport-Stamford-Norwalk, CT. . . . . . . . . . . . . . . . . . . . . . . . . . . . . . . . . . . . . . . . . . . . . . . . . . . . . .San Jose-Sunnyvale-Santa Clara, CA. . . . . . . . . . . . . . . . . . . . . . . . . . . . . . . . . . . . . . . . . . . . . . . . . . .Washington-Arlington-Alexandria, DC-VA-MD-WV. . . . . . . . . . . . . . . . . . . . . . . . . . . . . . . . . . . . . . . . .San Francisco-Oakland-Fremont, CA . . . . . . . . . . . . . . . . . . . . . . . . . . . . . . . . . . . . . . . . . . . . . . . . . . .Trenton-Ewing, NJ. . . . . . . . . . . . . . . . . . . . . . . . . . . . . . . . . . . . . . . . . . . . . . . . . . . . . . . . . . . . . . . . . .New York-Northern New Jersey-Long Island, NY-NJ-PA. . . . . . . . . . . . . . . . . . . . . . . . . . . . . . . . . . . . .Oxnard-Thousand Oaks-Ventura, CA . . . . . . . . . . . . . . . . . . . . . . . . . . . . . . . . . . . . . . . . . . . . . . . . . . .Boston-Cambridge-Quincy, MA-NH. . . . . . . . . . . . . . . . . . . . . . . . . . . . . . . . . . . . . . . . . . . . . . . . . . . . .Boulder, CO. . . . . . . . . . . . . . . . . . . . . . . . . . . . . . . . . . . . . . . . . . . . . . . . . . . . . . . . . . . . . . . . . . . . . . .Napa, CA. . . . . . . . . . . . . . . . . . . . . . . . . . . . . . . . . . . . . . . . . . . . . . . . . . . . . . . . . . . . . . . . . . . . . . . . .Santa Cruz-Watsonville, CA . . . . . . . . . . . . . . . . . . . . . . . . . . . . . . . . . . . . . . . . . . . . . . . . . . . . . . . . . .Naples-Marco Island, FL. . . . . . . . . . . . . . . . . . . . . . . . . . . . . . . . . . . . . . . . . . . . . . . . . . . . . . . . . . . . .Baltimore-Towson, MD . . . . . . . . . . . . . . . . . . . . . . . . . . . . . . . . . . . . . . . . . . . . . . . . . . . . . . . . . . . . . .Midland, TX. . . . . . . . . . . . . . . . . . . . . . . . . . . . . . . . . . . . . . . . . . . . . . . . . . . . . . . . . . . . . . . . . . . . . . .Los Angeles-Long Beach-Santa Ana, CA. . . . . . . . . . . . . . . . . . . . . . . . . . . . . . . . . . . . . . . . . . . . . . . .Santa Barbara-Santa Maria-Goleta, CA . . . . . . . . . . . . . . . . . . . . . . . . . . . . . . . . . . . . . . . . . . . . . . . . .Hartford-West Hartford-East Hartford, CT. . . . . . . . . . . . . . . . . . . . . . . . . . . . . . . . . . . . . . . . . . . . . . . .San Diego-Carlsbad-San Marcos, CA. . . . . . . . . . . . . . . . . . . . . . . . . . . . . . . . . . . . . . . . . . . . . . . . . . .Seattle-Tacoma-Bellevue, WA. . . . . . . . . . . . . . . . . . . . . . . . . . . . . . . . . . . . . . . . . . . . . . . . . . . . . . . . .Honolulu, HI. . . . . . . . . . . . . . . . . . . . . . . . . . . . . . . . . . . . . . . . . . . . . . . . . . . . . . . . . . . . . . . . . . . . . . .Philadelphia-Camden-Wilmington, PA-NJ-DE-MD . . . . . . . . . . . . . . . . . . . . . . . . . . . . . . . . . . . . . . . . .Anchorage, AK . . . . . . . . . . . . . . . . . . . . . . . . . . . . . . . . . . . . . . . . . . . . . . . . . . . . . . . . . . . . . . . . . . . .Santa Rosa-Petaluma, CA. . . . . . . . . . . . . . . . . . . . . . . . . . . . . . . . . . . . . . . . . . . . . . . . . . . . . . . . . . . .Houston-Sugar Land-Baytown, TX . . . . . . . . . . . . . . . . . . . . . . . . . . . . . . . . . . . . . . . . . . . . . . . . . . . . .Chicago-Joliet-Naperville, IL-IN-WI. . . . . . . . . . . . . . . . . . . . . . . . . . . . . . . . . . . . . . . . . . . . . . . . . . . . .97.47.47.37.17.06.96.96.86.86.8Sources: 2007–2011 American Community Surveys.Table 3.Concentrations of High-Income Households in the Lowest-Concentration MetropolitanStatistical Areas: 2007–2011(For information on confidentiality protection, sampling error, nonsampling error, and definitions, see www.census.gov/acs/www/)Metropolitan statistical 356357358359360361362363364365366Owensboro, KY. . . . . . . . . . . . . . . . . . . . . . . . . . . . . . . . . . . . . . . . . . . . . . . . . . . . . . . . . . . . . . . . . . . .Lake Havasu City-Kingman, AZ. . . . . . . . . . . . . . . . . . . . . . . . . . . . . . . . . . . . . . . . . . . . . . . . . . . . . . . .Morristown, TN . . . . . . . . . . . . . . . . . . . . . . . . . . . . . . . . . . . . . . . . . . . . . . . . . . . . . . . . . . . . . . . . . . . .Lewiston-Auburn, ME . . . . . . . . . . . . . . . . . . . . . . . . . . . . . . . . . . . . . . . . . . . . . . . . . . . . . . . . . . . . . . .Jacksonville, NC . . . . . . . . . . . . . . . . . . . . . . . . . . . . . . . . . . . . . . . . . . . . . . . . . . . . . . . . . . . . . . . . . . .Bay City, MI. . . . . . . . . . . . . . . . . . . . . . . . . . . . . . . . . . . . . . . . . . . . . . . . . . . . . . . . . . . . . . . . . . . . . . .Williamsport, PA . . . . . . . . . . . . . . . . . . . . . . . . . . . . . . . . . . . . . . . . . . . . . . . . . . . . . . . . . . . . . . . . . . .Youngstown-Warren-Boardman, OH-PA . . . . . . . . . . . . . . . . . . . . . . . . . . . . . . . . . . . . . . . . . . . . . . . . .Springfield, OH . . . . . . . . . . . . . . . . . . . . . . . . . . . . . . . . . . . . . . . . . . . . . . . . . . . . . . . . . . . . . . . . . . . .Pocatello, ID . . . . . . . . . . . . . . . . . . . . . . . . . . . . . . . . . . . . . . . . . . . . . . . . . . . . . . . . . . . . . . . . . . . . . .Goldsboro, NC. . . . . . . . . . . . . . . . . . . . . . . . . . . . . . . . . . . . . . . . . . . . . . . . . . . . . . . . . . . . . . . . . . . . .Clarksville, TN-KY. . . . . . . . . . . . . . . . . . . . . . . . . . . . . . . . . . . . . . . . . . . . . . . . . . . . . . . . . . . . . . . . . .Johnstown, PA. . . . . . . . . . . . . . . . . . . . . . . . . . . . . . . . . . . . . . . . . . . . . . . . . . . . . . . . . . . . . . . . . . . . .Wheeling, WV-OH. . . . . . . . . . . . . . . . . . . . . . . . . . . . . . . . . . . . . . . . . . . . . . . . . . . . . . . . . . . . . . . . . .Sumter, SC . . . . . . . . . . . . . . . . . . . . . . . . . . . . . . . . . . . . . . . . . . . . . . . . . . . . . . . . . . . . . . . . . . . . . . .Cumberland, MD-WV . . . . . . . . . . . . . . . . . . . . . . . . . . . . . . . . . . . . . . . . . . . . . . . . . . . . . . . . . . . . . . .Gadsden, AL. . . . . . . . . . . . . . . . . . . . . . . . . . . . . . . . . . . . . . . . . . . . . . . . . . . . . . . . . . . . . . . . . . . . . .Mansfield, OH . . . . . . . . . . . . . . . . . . . . . . . . . . . . . . . . . . . . . . . . . . . . . . . . . . . . . . . . . . . . . . . . . . . . .Hinesville-Fort Stewart, GA. . . . . . . . . . . . . . . . . . . . . . . . . . . . . . . . . . . . . . . . . . . . . . . . . . . . . . . . . . .Anderson, IN. . . . . . . . . . . . . . . . . . . . . . . . . . . . . . . . . . . . . . . . . . . . . . . . . . . . . . . . . . . . . . . . . . . . . .Muskegon-Norton Shores, MI. . . . . . . . . . . . . . . . . . . . . . . . . . . . . . . . . . . . . . . . . . . . . . . . . . . . . . . . .Steubenville-Weirton, OH-WV. . . . . . . . . . . . . . . . . . . . . . . . . . . . . . . . . . . . . . . . . . . . . . . . . . . . . . . . .Pine Bluff, AR . . . . . . . . . . . . . . . . . . . . . . . . . . . . . . . . . . . . . . . . . . . . . . . . . . . . . . . . . . . . . . . . . . . . .Danville, IL. . . . . . . . . . . . . . . . . . . . . . . . . . . . . . . . . . . . . . . . . . . . . . . . . . . . . . . . . . . . . . . . . . . . . . . .Danville, VA. . . . . . . . . . . . . . . . . . . . . . . . . . . . . . . . . . . . . . . . . . . . . . . . . . . . . . . . . . . . . . . . . . . . . . .Percentage ofMSA householdsamong top5 .41.41.41.41.31.31.31.31.21.11.1Sources: 2007–2011 American Community Surveys.U.S. Census Bureau7
During this period, the top 5 percent of house-holds received at least 191,469 per year. 2. Figure 1 depicts the number of high-income house-holds in each county, while Figure 2 maps the number of all households in each county. These figures illustrate that, like the general popula-tion, most high-income households lived in high-