Transcription
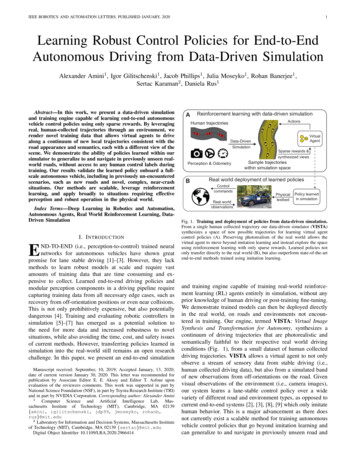
NEWSLETTER #32 - July 2015www.sumproduct.com www.sumproduct.com/thoughtAlas, poor ratios I knew them well This month we thought we would actually look at a technical area of financial modelling which is sometimesneglected: ratio analysis. You may be highly adept at building financial statements, but can you interpret them?In other news, we give you an update on Windows 10, flag a possible issue with Power Map and also take charge of“Power” altogether as we explain how Microsoft seeks to ‘transform’ Power Query into something else Until next month.Liam Bastick, Managing Director, SumProductSooner Rather Than LaterWindows 10 is coming sooner than first thought. Microsoft hasannounced that PCs and tablets running the software would go on salefrom Wednesday 29 July (why midweek, we don’t know), at whichpoint the operating system would also be offered as a free download toexisting users. The roll-out of the product for smartphones, Xbox gamesconsoles and other accessories “ will follow later”.It is fair to say that Windows 8 and the updated 8.1 have not beenreceived as well as the software giant might have hoped, with manydeciding not to update to its touch-centric user interface. The companyhas seemingly acknowledged this with the return of some of the morepopular Windows 7 features (like being able to find the off switch?).New additions are set to include: the new Edge browser allows users to annotate web pages the integration of the company’s voice-controlled virtual assistant, Cortana (not Clippy!) - which was previously restricted to Microsoft’s phones a new app that allows video games to be streamed to a PC or tablet from an Xbox, vital for all you Excel enthusiasts out there, we’re sure.The early release comes as much of a surprise to many as it was expected that the launch of the product would not happen until later in the year.contact@sumproduct.com www.sumproduct.com 61 3 9020 2071
Being Rational With RatiosOne key area of financial statement analysis is ratio analysis. This isrelatively straightforward to produce from published statutory accountsafter taking into account certain details, typically found in the Notes tothe Accounts.Not only is the data required readily available, using ratios rather thanabsolute calculations allows comparison between previous years andwith peers in a similar industry at a similar stage in their business lifecycle.Trends can be derived to identify improvements / deficiencies and assessthe underlying story of the business evaluated.There are limitations to ratio analysis. Most ratios are derived fromaccounting data and these line items are dependent upon the accountingpolicies of the firm and the accounting standards of the jurisdiction. Asmore companies convert to report by International Financial ReportingStandards (IFRS), comparisons between companies in similar sectors butdifferent geographical locales will become easier. However, due to theaccounting policies adopted, ratios should always be considered overthe longer term in conjunction with other methods of financial analysis(e.g. discounted cash flow).Ratios are often separated into various categories, e.g. profitability,liquidity, asset management, debt (gearing), equity and market value.However, there is no universal agreement as to either how these ratiosshould be calculated or categorised. It is possible to discover that differenttexts use slightly different formulae for the computation of many ratios.Therefore, when comparing a calculated ratio with a published ratio oran industry average, make sure that the formula used in the calculation isconsistent with the published ratio.SumProduct works with various accounting presentations around theworld including US Generally Accepted Accounting Principles (US GAAP)and the International Financial Reporting Standards (IFRS) – now adoptedby c.120 companies around the world. For the purposes of the followingillustration, we have used US GAAP, but IFRS ratios are very similar.Profitability RatiosProfitability ratios measure a company’s operating efficiency, including its ability to generate income and cash flow. Cash flow affects the company’sability to obtain debt and equity financing and therefore ensure the company’s long-term viability and ultimately profitability.This is the calculation that shows the ratio ofcontribution divided by sales. This ratio considersthe profit of direct costs. In essence, the grossprofit ratio is essentially the percentage mark-up onmerchandise from its cost. This ratio is essential inunderstanding break-even analysis.It is best used when the splits of direct costs andsales revenue by category can be determined.Sometimes known as the EBITDA margin, thisratio differs from the Gross Profit Margin in that itincludes the indirect costs in the calculation also.This demonstrates company profitability beforecapital expenditure requirements, financing andtaxation and is often seen as an operating cashflowratio proxy.Similar to Net Profit (EBITDA) Margin, this considersprofitability including capital expenditure butexcluding financing and taxation considerations.This provides the ultimate profitability as aproportion of sales allowing for easy comparison toother companies.It can be argued this ratio is too high level as it isunclear how the profitability is derived betweendirect costs, indirect costs, capital expenditureattribution (i.e. depreciation), financing andtaxation.contact@sumproduct.com www.sumproduct.com 61 3 9020 2071
The return on assets ratio, often called the return ontotal assets, is a profitability ratio that measures thenet income produced by total assets during a periodby comparing net income to the average totalassets, i.e. it measures how efficiently a companycan manage its assets to produce profits during aperiod.That is, this ratio measures how profitable acompany's assets are.The return on net assets depicts how much thebalance sheet “sweats” profitability.Net Assets equals Total Assets less Total Liabilitiesand is therefore equal to Total Equity. Therefore,depending upon how equity is defined, this ratio isoften the equivalent of Return On Equity.Capital Employed is defined as Total Assets lessCurrent Liabilities, which is effectively Total Debt Total Equity.This is effectively an accounting return proxy for thereturn on weighted capital.ROCE is a long-term profitability ratio because itshows how effectively assets are performing whiletaking into consideration long-term financing. Thisis why ROCE is considered a more useful ratio thanReturn On Equity to evaluate the longevity of acompany.The return on equity ratio or ROE is a profitabilityratio that measures the ability of a firm to generateprofits from its shareholders investments in thecompany.ROE is also an indicator of how effectivemanagement is at using equity financing to fundoperations and grow the company.Similar to Return On Equity, this specifically looksat the return on the average Common Stock (ShareCapital).Liquidity RatiosThese ratios analyse the ability of a company to pay off both its currentliabilities as they become due as well as their long-term liabilities as theybecome current. These ratios frequently consider the ability to turn otherassets into cash to pay off liabilities and other current obligations.It should be emphasised that liquidity is not only a measure of how muchcash a business has. It is also a measure of how easy it will be for thecompany to raise enough cash or convert assets into cash.The current ratio is a liquidity ratio that measures afirm’s ability to pay off its short-term liabilities withits current assets.This means that a company has a limited amountof time in order to raise the funds to pay for theseliabilities, due within one year. Current assets likecash, cash equivalents, and marketable securitiescan easily be converted into cash in the short term.Companies with larger amounts of current assetswill find it easier to pay off current liabilities whenthey become due without having to sell off key longterm, revenue generating assets.contact@sumproduct.com www.sumproduct.com 61 3 9020 2071
The quick ratio (alternatively known as the acid testratio) is a liquidity ratio that measures the ability ofa company to pay its current liabilities when theycome due with only quick assets.Quick assets are current assets that can beconverted to cash within the short-term (typically90 days).Cash, cash equivalents, short-term investmentsor marketable securities, and current accountsreceivable are considered quick assets.Short-term investments or marketable securitiesinclude trading securities and available for salesecurities that can easily be converted into cashwithin the next 90 days. Marketable securities aretraded on an open market with a known price andreadily available buyers. Inventory is specificallyexcluded.This is the ratio of a company’s total cash and cashequivalents to its current liabilities.A highly restrictive liquidity ratio, the cash ratio ismost commonly used as a measure of companyliquidity. It can therefore determine if, and howquickly, the company can repay its short-termdebt. A strong cash ratio is useful to creditors whendeciding how much debt, if any, they would bewilling to extend to the asking party.Not to be confused with the Working Capital Ratio(another name for the Current Ratio), this rationotes the level of surplus / deficit in working capitalas a proportion of total assets.This can provide a reader of the proportion ofcapital used in operations as a proportion of thetotal assets utilised.Asset Management RatiosProfitability ratios measure a company’s operating efficiency, including itsability to generate income and cash flow. Cash flow affects the company’sability to obtain debt and equity financing and therefore ensure thecompany’s long-term viability and ultimately profitability.(either in averages or in closing balances). Reporting companies are awareof this and this can lead to Balance Sheet manipulation. Auditors cannotremedy this situation: their role is merely to report that amounts are trueand fair as at the reporting date.Many of these ratios in particular are based on using year-end balancesThis ratio should actually be net credit sales, butthis figure is not always readily available and salesare often used as a proxy in practice, even if this istechnically incorrect.This measures the level of turnover within one year:the lower this figure, the more it demonstrates theinefficiency of the Accounts Receivable team tocollect owed monies.This alternative ratio is easier to understand formany: essentially, this divides the last ratio into 365(the number of days in a year) to derive how long ittakes to recover credit sales.contact@sumproduct.com www.sumproduct.com 61 3 9020 2071
This ratio measures the level of inventory turnoverwithin one year: this figure needs to be comparedagainst previous years and industry averages tohave any real meaning.This alternative ratio is easier to understand formany: essentially, this divides the last ratio into 365(the number of days in a year) to derive how longcash is tied up in inventory.This ratio measures the level of turnover within oneyear: the lower this figure, the longer it takes thecompany to make its payments to creditors whichmay suggest cash flow difficulties, for example.This alternative ratio is easier to understand formany: essentially, this divides the last ratio into 365(the number of days in a year) to derive how long istaken on average before creditors are paid.Not strictly a ratio, this calculation computes howlong working capital is tied up in the company’sbusiness. If this extends over time or is greater thanthe industry average this may suggest a companymay soon suffer cash flow problems (if not already).This alternative ratio is perhaps not as easy tounderstand. Essentially, this divides the last ratiointo 365 (the number of days in a year) to derivehow frequently the working capital is turned over inone year.This measures the level of fixed assets turnoverwithin one year. This ratio is an efficiency measureto see how productive its fixed assets are ingenerating sales.Similar to the previous ratio, the asset turnover ratiois an efficiency ratio that measures a company'sability to generate sales from its assets bycomparing net sales with average total assets.Debt (Gearing) RatiosSometimes referred to as solvency ratios, this looks at longer-term concerns affected by debt rather than shorter-term issues derived from operations.These ratios consider the level of debt carried by the business, how this financial leverage affects the business and its ability to service its financingobligations.This ratio measures the level of total liabilities as aproportion of the total liabilities and equity addedtogether.The idea behind this ratio is that all forms of liabilityare financing the business in some shape or form(e.g. not paying a tax creditor means that the cashmay be used elsewhere in the short term).Similar to the above ratio, this ratio measures thelevel of total liabilities as a proportion – this time ofjust owners’ equity.This can be useful as an accounting proxy fordetermining ungearing and re-gearing betas forvaluation purposes.contact@sumproduct.com www.sumproduct.com 61 3 9020 2071
This financial leverage ratio measures the amount ofa firm’s assets that are financed by its shareholdersby comparing total assets with total shareholder’sequity.Like all liquidity ratios and financial leverage ratios,the equity multiplier is an indication of companyrisk to creditors. Companies that rely too heavily ondebt financing will have high debt service costs andwill have to raise more cash flows in order to pay fortheir operations and obligations.Similar to the Total Debt ratio, this measures morespecific debt as a proportion of the total liabilitiesand equity added together.This ratio tightens the focus even more, specificallylooking at Debt to Equity.The times interest earned ratio, sometimes calledthe P&L interest coverage ratio, is a coverage ratiothat measures the proportionate amount of incomethat can be used to cover interest expenses in thefuture.In some respects the times interest ratio isconsidered a solvency ratio because it measuresa firm’s ability to make interest and debt servicepayments. Since these interest payments are usuallymade on a long-term basis, they are often treatedas an ongoing, fixed expense. As with most fixedexpenses, if the company can’t make the payments,it could go bankrupt and cease to exist. Thus, thisratio could be considered a solvency ratio.In practice, the cash versions of this metric aremore commonplace as accounting figures may bemanipulated.This is an extremely important ratio for financing.Cash Flow Available for Debt Servicing (CFADS) isdefined as operating and investing income excludinginterest paid and (usually) debt drawdowns andequity issuances. More often than not this onlyconsiders the cash generated in the period andexcludes any opening cash balance.This measures the company’s ability to meet all ofits debt obligations (i.e. principal and interest).Financiers prefer this value to be between 1.20 and1.50 (too low can trigger a default, too high maytrigger a cash sweep).Similar to the DSCR, this ratio is used to confirminterest obligations may be met (often used whenprincipal is not yet due).Equity RatiosEquity ratios are measures shareholders will pay particular interest in. They need to understand how the market values the business compared to bookvalues and what the price / performance equates to on a per share basis.contact@sumproduct.com www.sumproduct.com 61 3 9020 2071
Earnings per share (EPS), also called net income pershare, is a market prospect ratio that measures theamount of net income earned per share of averagestock outstanding for the period in question.Earnings per share is also a calculation that showshow profitable a company is on a shareholder basis.Therefore, a larger company’s profits per sharecan be compared to smaller company’s profitsper share, but this will mean they need to makemore profit. Size is sometimes “normalised” in thismetric.This is still meaningful if negative.Similar to EPS, this measure is useful for minorityshareholders who cannot necessarily access theearnings attributed to them.This cannot be negative.This measures the Owners’ Equity (or Net Assets)ascribed to each share. Note that this should beundertaken on a closing balance, rather than anaverage balance, basis.This reports how much of the current period’sprofit is paid out. Depending upon the law wherethe company resides and its retained earnings, thisfigure can be greater than 100%.This ratio reports how much of the current period’sprofit is retained and hence reinvested. DividendPayout Ratio plus Retention Ratio should equal100%.Some may consider this metric better positioned inanother category, but the financial leverage ratiosmeasures the value of equity in a company byanalysing its overall debt picture.These ratios either compare debt or equity to assetsas well as shares outstanding to measure the truevalue of the equity in a business.When shareholders own a majority of the assets,the company is said to be less leveraged. Whencreditors own a majority of the assets, thecompany is considered highly leveraged. All ofthese measurements are important for investorsto understand how risky the capital structure of acompany and if it is worth investing in.Also situated in profitability, the return on equityratio or ROE is a profitability ratio that measuresthe ability of a firm to generate profits from itsshareholders investments in the company.ROE is also an indicator of how effectivemanagement is at using equity financing to fundoperations and grow the company.Sometimes this is calculated on the Du Pont basis,where it is calculated as the Net Income Marginmultiplied by Total Assets Turnover multiplied bythe Financial Leverage Ratio. Whichever methodis adopted, the results should equate (the Du Pontmethod provides more information).contact@sumproduct.com www.sumproduct.com 61 3 9020 2071
Market Value RatiosA subset of equity ratios, these measures shareholders specifically address market value. These ratios pre-suppose the company is marketable and avaluation is readily available.The price earnings ratio, often called the P/E ratio,is a market prospect ratio that calculates the marketvalue of a stock relative to its earnings by comparingthe market price per share by the earnings pershare.Investors often use this ratio to evaluate what astock’s fair market value should be by predictingfuture earnings per share.The PE ratio helps investors analyse how much theyshould pay for a stock based on its current earnings.This is why the price to earnings ratio is often calleda price multiple or earnings multiple.This ratio is not calculated when EPS is negative.Similar to the P/E ratio, this measure shows themarket uplift to show whether investors havevalued the company’s performance at a premium ora discount.Modelling Example (US GAAP Illustration)contact@sumproduct.com www.sumproduct.com 61 3 9020 2071
If you or your colleagues require assistance with financial modelling, interpretation or training, drop us a line at contact@sumproduct.com ortraining@sumproduct.com. We’d be happy to help no matter where you are in the world – have passports, will travel!The Future’s Mapped Out.?It’s come to our attention that back in late May previous incarnations of the Excel COM add-in Power Map Preview for Excel 2013 “expired” and will nolonger work on any version of Excel.contact@sumproduct.com www.sumproduct.com 61 3 9020 2071
A new (final?) preview version is available for download s.aspx?id 38395.If you installed the earlier version, uninstall it from Control Panel, thendownload and install the current version of the Power Map Preview. Onceyou have installed it, if it appears greyed out on the Ribbon, de-activateand re-activate the COM add-in.This version has the same functionality as the version of Power Mapthat was released with Microsoft Office 365 SP1. Although feature andperformance enhancements for Power Map will continue to be releasedfor the Microsoft Office 365 subscription plans, Microsoft has stated thatthere are no future plans to update the downloadable Power Map Preview.It should be noted that if you have a subscription for Microsoft Office 365ProPlus, you will continue to have access to Power Map for Excel as part ofthe self-service business intelligence tools. Whenever any new Power Mapfeatures and performance enhancements are released, you’ll get them aspart of your subscription plan. Office 2013 Professional Plus on the otherhand Transformers – Power Query in Disguise?Sharp-eyed readers who have decided to tinker with the Office 2016 Preview have noticed that Power Query appears to have had a namechange:It looks like we may have a Power Outage, with the section tentatively renamed “Get & Transform”. We are not quite sure what the futureholds for Power Pivot, Power Map (and PowerPoint?). SumProduct has toyed with petitioning Microsoft to retain the “Power” prefix atthe very least. Our suggestions include: Power 2 (The People Edition) Power Jerk Power Bored Power Lift Power Cut Power Nap Power Drill Power Play Power Grid Power Ranger Power HungryLet us know what you think!Upcoming SumProduct Training CoursesLocationDateCourseDurationPerth23rd - 24th Jul 2015Financial Modelling2 daysManila29th - 30th Jul 2015Financial Analysis2 daysNew York31st Aug - 2nd Sep 2015Strategic Planning, Forecasting and Budgeting3 daysHong Kong12th - 13th Oct 2015Financial Modelling for Financial Analysis2 daysSingapore15th - 16th Oct 2015Financial Modelling for Financial Analysis2 daysLondon19th - 21st Oct 2015Strategic Planning, Forecasting and Budgeting3 daysSingapore19th - 22nd Oct 2015Strategic Planning, Forecasting and Budgeting4 daysHong Kong26th - 29th Oct 2015Strategic Planning, Forecasting and Budgeting4 daysSydney25th - 26th Nov 2015Financial Modelling For Financial Analysis2 daysMelbourne30th Nov - 1 Dec 2015Financial Modelling For Financial Analysis2 daysDubai8th - 10th Dec 2015Strategic Planning, Forecasting and Budgeting3 dayscontact@sumproduct.com www.sumproduct.com 61 3 9020 2071
Key StrokesEach newsletter, we’d like to introduce you to several useful keystrokes you may or may not be aware of. This month we thought wewould take CONTROL of the alphabet:KeystrokeWhat it doesCTRL ASelect current region / allCTRL BBold (toggle)CTRL CCopyCTRL DFill downCTRL FFind dialog boxCTRL GGo To dialog boxCTRL HReplace dialog boxCTRL IItalics (toggle)CTRL KInsert hyperlinkCTRL LExcel 2007 / later: Create Table; Excel 2003 / earlier: Create ListCTRL NNew workbookCTRL OOpen workbookCTRL PPrintCTRL RFill rightCTRL SSaveCTRL TExcel 2007 / later: Insert TableCTRL UUnderline (toggle)CTRL VPasteCTRL WClose WindowCTRL XCutCTRL YRedoCTRL ZUndoThere are over 540 keyboard shortcuts in Excel. For a comprehensive list, please download our Excel file at ts.Our ServicesWe have undertaken a vast array ofassignments over the years, including:· Business planning· Building three-way integratedfinancial statement projections· Independent expert reviews· Key driver analysis· Model reviews / audits for internaland external purposes· M&A work· Model scoping· Project finance· Real options analysis· Refinancing / restructuring· Strategic modelling· Valuations· Working capital managementIf you require modelling assistanceof any kind, please do not hesitate tocontact us at contact@sumproduct.com.Link to OthersTrainingThese newsletters are not intended to beclosely guarded secrets. Please feel freeto forward this newsletter to anyone youthink might be interested in converting to“the SumProduct way”.SumProduct offers a wide range oftraining courses, aimed at financeprofessionals and budding Excel experts.Courses include Excel Tricks & Tips,Financial Modelling 101, Introduction toForecasting and M&A Modelling.If you have received a forwardednewsletter and would like to receivefuture editions automatically, pleasesubscribe by completing our newsletterregistration process found at the foot ofany www.sumproduct.com web page.Check out ourmore popularcourses inour trainingbrochure:Any Questions?If you have any tips, comments or queriesfor future newsletters, we’d be delightedto hear from you. Please drop us a line atnewsletter@sumproduct.com.Drop us a line at training@sumproduct.comfor a copy of the brochure or downloadit directly fromhttp://www.sumproduct.com/training.Registered Address: SumProduct Pty Ltd, Level 6, 468 St Kilda Road, Melbourne VIC 3004Melbourne Address: SumProduct Pty Ltd, Level 9, 440 Collins Street, Melbourne VIC 3000contact@sumproduct.com www.sumproduct.com 61 3 9020 2071
The return on net assets depicts how much the balance sheet "sweats" profitability. Net Assets equals Total Assets less Total Liabilities and is therefore equal to Total Equity. Therefore, depending upon how equity is defined, this ratio is often the equivalent of Return On Equity. Capital Employed is defined as Total Assets less