Transcription
KeyBanc Capital MarketsIndustrial & AutomotiveConferenceBoston, MassachusettsJune 9, 2004
Safe Harbor StatementsForward-Looking StatementsThis presentation contains certain forward-looking information within the meaning ofthe Private Securities Litigation Reform Act of 1995. The words “believe”, “expect”,“anticipate”, “estimate”, “target”, and similar expressions, among others, identifyforward-looking statements. All forward-looking statements are based oninformation presently available to management. Such forward-looking statementsare subject to certain risks and uncertainties that could cause events and theCompany’s actual results to differ materially from those expressed or implied.Please see the disclosure regarding forward-looking statements immediatelypreceding Part I of the Company’s Annual Report on Form 10-K for the fiscal yearended October 31, 2003. The Company assumes no obligation to update anyforward-looking statements.Regulation GThis presentation includes certain non-GAAP financial measures that excluderestructuring and other unusual charges and gains that are volatile from period toperiod. Management believes the non-GAAP measures provide a better indicationof operational performance and a more stable platform on which to compare thehistorical performance of the Company than the most nearly equivalent GAAP data.All non-GAAP data in the presentation are indicated by footnotes. Tables showingthe reconciliation between GAAP and non-GAAP measures are available at the endof this presentation and on the Greif Web site at www.greif.com.
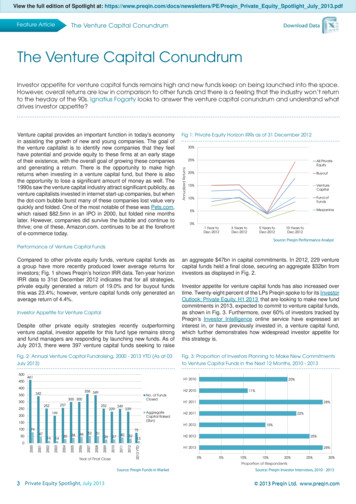
2003 Net Sales: 1.9 BillionBy SegmentBy Region2%13%26%27%72%60%Industrial Packaging & ServicesPaper, Packaging & ServicesTimberNorth AmericaEuropeOther
Comprehensive Product PortfolioGREIFGCC DrumFibre Product PortfolioSteel Plastic MamorRussell-StanleySchutz HooverMauserIBCGlobalPresence
Multinational Customer BaseTop 10 customersrepresent less than20% of sales
Paper, Packaging & ServicesFiscal 2003AdvantagesNet sales 504 million26% Value-added niche player Fully integrated containerboard network Differentiation through superior qualityand dependable serviceOperating profit (1) 29 million25%(1)Before restructuring chargesEnd marketsPackagingAutomotiveFoodBuilding products
Fully Integrated Containerboard Producer(000s of tons)105%IntegrationExternal tainerboardOutput (Mills)0100200300400500600700800
0%Source: SEC filings, Analyst reports and Pulp & PaperInterstate Resources57%NorampacBoise65%International Paper70%Longview Fibre75%Georgia-Pacific80%Smurffit-StonePackaging Corp.Weyerhaeuser100%Pratt Ind.Temple-InlandGreifIntegration: Greif versus Industry Peers105% 103%90% 90%77%63%52% 50%50%25%
Liner Prices versus PP&S' Operating ProfitFiscal Years 1996-2004Paper, Packaging & Services’Annual Operating ProfitMonthly Liner Prices500 54 55 35 53 32 29400 23 410 20 15 8 310( 2)Dollars per tonThousands of dollarsSource: Pulp & Paper* Six months ended April 30Note: Annual operating profit includes corporate allocations.Apr 04*Oct. 03Oct. 02Oct. 01Oct. 00Oct. 99Oct. 98( 5)Oct. 0
The Packaging Industry Continues to Consolidate1984WeyerhaeuserStone ContainerInternational PaperChampion Int’lUnion fit-StoneWeyerhaeuserInternational %17%13%11%9%72%
TimberFiscal 2003Advantages Undervalued Timberland AssetsNet sales 28 million2%Operating profit (1) 20 ica (1)319,000acresBefore restructuring charges and timberland gainsEnd marketsPaperBuilding productsHousingPilings and poles
TransformationProcess
Strong FoundationLeadingmarketposition Global leader – industrial packaging Leading specialty provider – paper and packaging Advantaged timberland assetsStrongheritage Integrity Customer focus People firstHistory ofbold moves In the industry – Van Leer, Sonoco and CorrChoice acquisitions In the market – value-added packaging provider In the company – Transformation ProcessSources ofcompetitiveadvantage Scale economies Uniquely positioned to serve global customers Distinctive customer service and respected “industrial brand” Differentiated and comprehensive product offerings A special culture
Our AspirationsPreferred productivitypartner“Break-away momentum”Growth Compelling value propositionbased on what targeted customersare willing to pay for Low-cost provider of high-qualityproducts with consistent andreliable delivery Organic growth: 5% (GDP 2 points) Operating profit margins: 10% SG&A: 10% RONA: 20% ROIC WACC: 5 pointsValueProductivityProductivity imperative Real-cost productivity: 4% per year Capital productivity- Asset turns: 2x- Operating WC/revenues: 12% World-class strategic sourcing capabilitiesPeople“Strong performance ethic” No. 1 preferred employer in the industry Strong performance ethic- Consequence management- Transparent governance structure- Rigorous management processes Special culture: “Great place to work”
The Greif Business System:The Framework for Achieving AspirationsVision/ValuesDirectionGreif OperatingSystem tPerformanceManagement
Greif’s Operating System – Capability EnginesCommercialExcellence Regional tactical marketing Value selling Fact-based account managementOperationalExcellence Diagnostics and target setting Network alignment Lean operations continuous improvementStrategicSourcing Global fact-based management Supplier relationships and integration TCO (productivity) analysisFact-BasedGeneralManagement Integrated problem solving People management/development Performance management
Guiding/Driving ProcessesStrategy Current focus on optimizing existing business portfolio.People Putting the right people in the pivotal roles. Identify high potential employees and talent gaps. Rigorous approach to talent development and capability building.PerformanceManagement Key Performance Indicators aligned across the enterprise. Building automated dashboards to track progress. Developing a rigorous performance management system.
Our ExpectationsFromIncremental improvementToA transformationCost effectiveLow costMarket pricingValue pricingNice place to workDemanding, but great place to workTactical sourcingStrategic supply chain managementEntitlementPerformanceIndividual, fragmented processesStandardized, uniform processesThe Greif WayThe Greif Way
The Greif Center of Excellence:A Mission-Driven Capability Building EngineOrganizationalstructure andinfrastructureFaculty selectionand developmentImproveMissionThe Greif Center of Excellenceprovides training to developand maintain the skill setsrequired to sustain the GreifProduction and CommercialSystems.The GreifCenter ofExcellenceMissionSustainRenewStudents andparticipantsInteractivemodules
Financial Overview
Financial Summary(Dollars in millions, except per share amounts)For the Quarters ended April 30,20042003Change 542.2 470.815%Operating profit*33.323.641%Net income*16.06.4Earnings per share*Class A Common StockClass B Common Stock0.560.850.230.34Net sales* Before restructuring charges and timberland gains.
Gross Profit(Dollars in millions)For the Quarters ended April 30,2004Net salesGross profitGross profit margin 542.22003470.815%89.382.29%16.5%17.5%Higher raw material costs (especially steel and OCC).Lower average selling prices for containerboard.Lower planned timber sales.Higher energy costs. Change
Selling, General and Administrative Expenses(Dollars in millions)For the Quarters ended April 30,Net salesSG&ASG&A expense ratio 20042003Change 542.2 470.815%55.759.0-6%10.3%12.5%Benefits from the Transformation Initiatives.Partial offset by a 3 million negative impact of foreign currency translation.
Financial Performance GoalsOperating Profit Margin **SG&A / Net Sales20%15%15.4%10.0%10%5.2%6.1%6.6%15%10.0%2004 *2006Target5%0%0%200220032004 *20022006TargetReturn on Net Assets ***2003Operating Working Capital / Net Sales 20032004 *2006Target200220032004 *2006TargetRepresents the twelve-month period ended April 30, 2004.Before restructuring charges and timberland gains.Return on net assets equals operating profit, before restructuring charges and timberland gains, divided by total debt plus shareholders’ equity.Operating working capital equals accounts receivable plus inventories less accounts payable.
Guidance(Dollars in millions, except per share amounts)Capital expendituresDepreciation expenseEPS* - Class A Common Stock2004Guidance2003Actual**2002Actual** 75 - 80 61 46 100 83 78 2.35 - 2.40 1.53 1.12* Before restructuring charges, debt extinguishment charge, timberland gains and cumulative effect of change inaccounting principle.** Excludes CorrChoice's capital expenditures (approximately 8 million) and depreciation expense ( 10.5 million)for the first eleven months of fiscal 2003. CorrChoice's amounts were not consolidated in fiscal 2002.
Fiscal 2004 EPS* Guidance Bridge2004 EPS approximately 55% above 2003 0.35 (0.35) 0.24 (0.24) 0.17 2.35 - 2.40CorrChoice –Full Year @ 100%Fiscal2004 0.65- 0.70 ePP&SCorrChoiceSynergies* Before restructuring charges and timberland gains, per Class A share.Timber
Fiscal 2004 Priorities Transformation Process– Deliver full-year of SG&A optimization savings– Rapid deployment of Operational Excellence– Organic growth through Commercial Excellence– Achieve working capital targets– Capture strategic sourcing opportunities CorrChoice: Realize operational and administrativesynergies Debt Reduction
Stock Performance: GEF vs. S&P 500December 4, 2002 – June 4, 20049/30/03: CorrChoiceTransaction3/4/03: TransformationProcess Announcement
Transformation Process – A Catalyst for Unlocking Value Leading global market position in industrial packaging Fully integrated network and value added niche positions in paperand packaging Significantly undervalued timber assets Comprehensive product portfolio and geographic diversification Financial flexibility Improving industry and company fundamentals
Appendix
GAAP to Non-GAAP Reconciliation(Dollars in thousands, except per share amounts)Year ended October 31, 2003GAAP - operating profitRestructuring chargesTimberland gainsNon-GAAP - operating profit beforerestructuring charges andtimberland gains GAAP - net incomeRestructuring charges, net of taxDebt extinguishment charge,net of taxTimberland gains, net of taxCumulative effect of change inaccounting principleNon-GAAP - net income beforerestructuring charges, debtextinguishment charge, timberlandgains and cumulative effect ofchange in accounting principle Diluted Per Share AmountsClass AClass AClass B Class B62,26460,743(5,577) 94,3572,824(12,122) 117,430 9,49642,034 85,059 0.341.49 49Year ended October 31, 2002Diluted Per Share Amounts 1.53 2.28 30,9791,8076,592(7,758)0.23(0.27)- 31,6201.100.060.35(0.41)- 1.121.640.10- 1.68
GAAP to Non-GAAP Reconciliation(Dollars in thousands)Year ended October 31,20032002Industrial Packaging & ServicesGAAP - operating profitRestructuring chargesNon-GAAP - operating profit beforerestructuring chargesPaper, Packaging & ServicesGAAP - operating profitRestructuring chargesNon-GAAP - operating profit beforerestructuring chargesTimberGAAP - operating profitRestructuring chargesTimberland gainsNon-GAAP - operating profit beforerestructuring charges andtimberland gains 19,87647,924 32,5082,322 67,800 34,830 16,90712,469 19,797446 29,376 20,243 25,481350(5,577) 42,05256(12,122) 20,254 29,986
GAAP to Non-GAAP Reconciliation(Dollars in thousands, except per share amounts)Quarter ended April 30, 2004Quarter ended April 30, 2003Diluted per share amountsClass ADiluted per share amountsClass BClass AClass BGAAP - operating profitRestructuring chargesTimberland gainsNon-GAAP - operating profit beforerestructuring charges andtimberland gains 22,36012,278(1,364) 7,72817,449(1,568) 33,274 23,609GAAP - net income (loss)Restructuring charges, net of taxTimberland gains, net of taxNon-GAAP - net income beforerestructuring charges and timberlandgains 8,4498,496(944) 0.300.29(0.03) 0.450.45(0.05) (4,413)11,865(1,066) (0.16)0.43(0.04) (0.24)0.64(0.06) 16,001 0.56 0.85 6,386 0.23 0.34
GAAP to Non-GAAP Reconciliation(Dollars in thousands)Quarter ended April 30,20042003Industrial Packaging & ServicesGAAP - operating profitRestructuring chargesNon-GAAP - operating profit beforerestructuring chargesPaper, Packaging & ServicesGAAP - operating profit (loss)Restructuring chargesNon-GAAP - operating profit beforerestructuring chargesTimberGAAP - operating profitRestructuring chargesTimberland gainsNon-GAAP - operating profit beforerestructuring charges andtimberland gains 18,2199,541 27,760 13,942 1,0303,791(230)2,66538013,562 2,435 4,821 4,37172(1,364) 6,31896(1,568) 3,079 4,846
Operating Working Capital / Net Sales **** * Represents the twelve-month period ended April 30, 2004. . **** Operating working capital equals accounts receivable plus inventories less accounts payable. Guidance (Dollars in millions, except per share amounts) 2004 Guidance 2003 Actual** 2002 Actual** Capital expenditures 75 - 80 61 46