Transcription
FIRSTQUARTERFiscal 2023 Report to ShareholdersCanaccord Genuity Group Inc. Reports First Quarter Fiscal 2023 ResultsExcluding significant items, quarterly earnings per common share of 0.11(1)First quarter dividend of 0.085 per common shareTORONTO, August 4, 2022 – Canaccord Genuity Group Inc. (Canaccord Genuity Group, the Company, TSX: CF) today announced its financialresults for the first fiscal quarter ended June 30, 2022.“The abrupt deceleration in global markets impacted first fiscal quarter financial performance in all of our capital markets businesses and to alesser degree, our wealth management businesses,” said Dan Daviau, President & CEO of Canaccord Genuity Group Inc. “In addition to the morechallenging backdrop, our quarterly results were impacted by markdowns of certain inventory positions held in connection with supporting ourcapital markets clients in Australia and Canada.”“Looking forward, we expect that economic conditions will continue to tighten before they improve but we continue to be active globally and wefeel good about our market position, the outlook for our wealth management businesses and a continuance of strong M&A activity in our capitalmarkets businesses.”First fiscal quarter highlights:(All dollar amounts are stated in thousands of Canadian dollars unless otherwise indicated) First quarter revenue excluding significant items(1) of 328.8 million, a decrease of 37.2% over the same period in the prior year First quarter net income before taxes excluding significant items(1) of 27.5 million, a decrease of 75.9% ( 1.9 million and a quarter-overquarter decrease of 98.1% on an IFRS basis) Diluted earnings per common share excluding significant items(1) for the first fiscal quarter of 0.11 per share (diluted loss per common shareof 0.14 on an IFRS basis), a decrease of 84.9% compared to the first quarter of fiscal 2022 Advisory revenue in the Company’s global capital markets division increased 8.7% year-over-year reflecting increased contributions from our USand UK & Europe businesses Capital markets revenues were impacted by sharp declines in the market value of certain inventory and warrant positions related to ourinvestment banking activities in Canada and Australia as well as certain market value adjustments related to our facilitation activity in Canada On May 31, 2022, the Company completed its acquisition of Punter Southall Wealth Limited (PSW) to increase the long-term value and marketposition of its wealth management position in the UK & Crown Dependencies Total client assets(1) in our global wealth management business of 90.7 billion, a decrease of 4.4% from Q1/22 reflecting year-over-yeardecreases of 2.1% in Canada and 6.2% in the UK & Crown Dependencies, primarily attributable to the decline in market values during the threemonth period and the impact of changes in foreign exchange rates on the value of client assets recorded in GBP, partially offset by theaddition of new client assets in connection with the acquisition of PSW Purchased 502,000 common shares for cancellation under the normal course issuer bid (NCIB) during the three months ended June 30, 2022 First quarter common share dividend of 0.085 per share(1) See Non-IFRS Measures on page 4CANACCORD GENUITY GROUP INC.FIRST QUARTER FISCAL 20231
Three months ended June 30Q1/23Q1/22First fiscal quarter highlights – adjusted(1)Revenue excluding significant items(1)Expenses excluding significant items(1)Diluted earnings per common share excluding significant items(1)Net Income excluding significant items(1)Net Income attributable to common shareholders excludingsignificant items(1)(3)First fiscal quarter highlights- IFRSRevenueExpensesDiluted (loss) earnings per common shareNet Income(2)Net (Loss) income attributable to common shareholders(3)Year-over-yearchangeThree monthsendedMarch 31Q4/22Quarter-overquarter change 328,817301,3650.1119,935 )% )% 11,879 81,251(85.4)% 54,678(78.3)% 317,370315,476(0.14)(3,004)(12,564) )%(104.1)%(118.0)% )%(104.4)%(122.3)%(1) Figures excluding significant items are non-IFRS measures. See Non-IFRS Measures on page 4(2) Before non-controlling interests and preferred share dividends paid on the Series A and Series C Preferred Shares(3) Net income (loss) attributable to common shareholders is calculated as the net income adjusted for non-controlling interests and preferred share dividendsCore business performance highlights:Canaccord Genuity Wealth ManagementThe Company’s combined global wealth management operations earned revenue of 162.2 million for the first fiscal quarter, a year-over-yeardecrease of 16.8%. Net income before taxes excluding significant items(1) for this segment decreased by 48.8% year-over-year. Wealth management operations in the UK & Crown Dependencies generated first quarter revenue of 73.3 million, a decrease of 8.7%compared to Q4/22 and unchanged compared to the same period last year. Measured in local currency (GBP), revenue was 45.7 million inQ1/23 compared to 42.7 million in Q1/22, an increase of 7.0% compared to the same quarter last year. Because the acquisition of PSW closedmid-way through the quarter, revenue associated with PSW will be fully reflected in the results of our next fiscal quarter (Q2/23) compared tothe current quarter (Q1/23). Net income before taxes excluding significant items(1) for this business was 18.7 million in Q1/23, down 3.5% yearover-year. Canaccord Genuity Wealth Management (North America) generated 73.0 million in first quarter revenue, a decrease of 4.2% compared toQ4/22, and because revenue in Q1/22 was at an elevated level with the significant investment banking revenue in that quarter, Q1/23 revenuerepresented a year-over-year decrease of 30.0% compared to Q1/22. Excluding significant items(1) net income before taxes for this businesswas 6.5 million in Q1/23, which represents a year-over-year decrease of 75.2% because of the elevated investment banking activity in thecomparable quarter and a sequential increase of 27.4%. Wealth management operations in Australia generated 15.9 million in first quarter revenue, a decrease of 9.1% compared to the first quarterof last year. Excluding significant items(1) net loss before taxes for this business was 0.5 million in Q1/23, down from net income of 2.6 million in Q1/22.Total client assets in the Company’s global wealth management businesses at the end of the first fiscal quarter amounted to 90.7 billion, adecrease of 4.2 billion or 4.4% from Q1/22. Client assets in the UK & Crown Dependencies were 52.2 billion ( 33.3 billion) as at June 30, 2022, a decrease of 1.3% (increase of 3.5%in local currency) from 52.8 billion ( 32.1 billion) at the end of the previous quarter, and a decrease of 6.2% (increase of 2.6% in local currency)from 55.6 billion ( 32.4 billion) at June 30, 2021 primarily attributable to the decline in market values, offset by net inflows and newassets from our acquisition of PSW and, when measured in CAD, changes in GBP/CAD foreign exchange rates. Client assets in North America were 33.9 billion as at June 30, 2022, a decrease of 10.6% from 37.9 billion at the end of the previousquarter and a decrease of 2.1% from 34.6 billion at June 30, 2021 due to the decline in market values, partially offset by net inflows and newassets from existing IAs and new recruits. Client assets(1) in Australia were 4.7 billion (AUD 5.3 billion) at June 30, 2022, a decrease of 12.3% from 5.4 billion (AUD 5.7 billion) atthe end of the previous quarter, also reflecting the decline in market values. In addition, client assets(1) totalling 13.3 billion (AUD 15.0 billion)are also held on record in less active and transactional accounts through our Australian platform.Canaccord Genuity Capital MarketsGlobally, Canaccord Genuity Capital Markets earned revenue of 164.1 million for the first fiscal quarter, a year-over-year decrease of 49.4%.The decrease primarily reflected substantially lower investment banking revenues in all geographies in connection with the significant decline inindustry-wide new issue volumes. In addition to the challenging backdrop of reduced levels of activity, another headwind for this quarter’s resultswas the impact of sharp declines in the market value of certain inventory and warrant positions earned in respect of our investment bankingactivities. These valuation changes primarily impacted our Australian capital markets business, and to a lesser degree, our Canadian business.Net income before taxes excluding significant items(1) for this segment was 4.1 million for the quarter, a year-over-year decrease of 95.1%. Canaccord Genuity Capital Markets participated in 80 investment banking transactions globally, including led or co-led, raising total proceedsof 6.2 billion during Q1/23.The Company’s US capital markets business was the largest contributor of revenue for the three-month period, with revenue of 124.1 million, or75.6% of total global capital markets revenue. This business contributed advisory fees revenue of 63.3 million for Q1/23, an increase of(1) See Non-IFRS Measures on page 42CANACCORD GENUITY GROUP INC.FIRST QUARTER FISCAL 2023
36.5% from the same period in the prior year. Commissions and fees revenue for the three-month period increased by 30.7% year-over-year, to 26.3 million. Investment banking revenue for the three-month period decreased by 84.0% to 6.3 million when compared to the first quarter ofthe prior year because of reduced new issue activity. Principal trading revenue also decreased by 40.9% from the prior year to 26.6 million in thefirst quarter due to lower trading volume, volatility and activity. Excluding significant items(1), the pre-tax net income contribution from thisbusiness amounted to 19.4 million for the three-month period.Revenue in our UK & Europe capital markets operations decreased by 7.3% for the three-month period driven mainly by lower investment bankingrevenue. Advisory revenue in this business increased 59.2% year-over-year to 16.1 million for the first quarter, and commissions and feesrevenue increased by 8.4% to 4.3 million. Excluding significant items(1), our UK & Europe capital markets business earned pre-tax net income of 3.4 million for the first quarter, a year-over-year improvement of 10.2%. The pre-tax profit margin in this business was 13.1% for the firstquarter, the strongest result in nine fiscal quarters.First quarter revenue of 14.3 million in our Canadian capital markets business decreased by 87.7% when compared to Q1/22. First quarterinvestment banking, advisory, and commissions and fees revenue declined by 92.6%, 83.7% and 91.8% respectively when compared to the sameperiod in the prior year. The impact of market declines on our revenue in Canada gave rise to facilitation losses of about 11 million offsettingour commission revenue leading to the significant decline compared to prior quarters. Declines in market values and net fee share inventoryvaluation adjustments of about 7 million reduced investment banking revenue by that amount and combined with a significant decline in new issueofferings led to a substantial decrease in investment banking revenue compared to prior quarters. Notwithstanding the revenue declines, thisbusiness continues to be a top-ranked domestic underwriter in Canada. Our Canadian capital markets operations generated a loss before incometaxes of 17.3 million in Q1/23, a decrease of 138.7% from income before income taxes of 44.6 million generated in the same period in theprior year.First quarter revenue earned by our Australian capital markets business decreased 101.0% year-over-year, reflecting a 118.7% decrease ininvestment banking revenue when compared to the same period a year ago. In addition to lower new issue activity, investment banking revenuewas negatively impacted by a net loss of approximately 20 million as a result of market value declines related to fee share and warrant inventories.Net loss before income taxes for the first three months of fiscal 2023 was 1.4 million compared to net income before income taxes of 6.8 millionin the first quarter of fiscal 2022.Summary of Corporate DevelopmentsOn May 31, 2022, the Company, through CGWM UK completed its acquisition of the private client investment management business of PunterSouthall Wealth Limited (PSW) for a total purchase price on closing of 168.0 million ( 267.8 million). In connection with the completion of theacquisition, CGWM UK modified its existing banking arrangements and increased its bank loan by an additional 100 million (C 159.4 million asof the acquisition date of May 31, 2022). In addition, certain institutional investors made an additional investment in CGWM UK through thepurchase of a new series of Convertible Preferred Shares in the amount of 65.3 million ( 104.1 million as of the acquisition date of May 31,2022). With the issuance of the additional convertible preferred shares and ordinary shares by CGWM UK in connection with the transaction, theCompany’s equity equivalent interest in CGWM UK on an as-converted basis now stands at 66.9%.On June 1, 2022, the Company announced the reset of the dividend rate on its Cumulative 5-year Rate Reset First Preferred Shares, Series C(the “Series C Preferred Shares”). Quarterly cumulative cash dividends, as declared, were paid at an annual rate of 4.993% for the five years endedJune 30, 2022. Commencing July 1, 2022 and ending on and including June 30, 2027, quarterly cumulative dividends, if declared, will be paidat an annual rate of 6.837%. The dividend rate will be reset every five years at a rate equal to the five-year Government of Canada yield plus 4.03%.The Company did not exercise its right to redeem all or any part of the outstanding Series C Preferred Shares on June 30, 2022.Subsequent to the end of the quarter, on August 3, 2022, the Company announced that through its UK & Europe capital markets business,Canaccord Genuity Limited, it has entered into an asset purchase agreement to acquire the business of Results International Group LLP (Results).Results is an independent advisory firm headquartered in London, UK which provides M&A and corporate finance services to entrepreneurs,corporates, private equity firms and investors focused in the technology and healthcare sectors. This transaction complements recent investmentsby the Company to expand its global Advisory business with the acquisitions of Petsky Prunier (2019) and Sawaya Partners (2021) and expandsits European domain expertise in the Healthcare and Technology sectors. The transaction is expected to close in the second quarter of theCompany’s current fiscal year, subject to customary closing conditions.Results for the First Quarter of Fiscal 2023 were impacted by the following significant items: Fair value adjustments on certain illiquid or restricted marketable securities recorded for IFRS reporting purposes, but which are excluded formanagement reporting purposes and are not used by management to assess operating performance Amortization of intangible assets acquired in connection with business combinations Acquisition-related costs in connection with the acquisition of Punter Southall Wealth Limited Certain incentive-based costs related to acquisitions Certain components of the non-controlling interest expense associated with CGWM UKSummary of Results for Q1 Fiscal 2023 and Selected Financial Information Excluding Significant Items(1):Three months ended June 30(C thousands, except per share and % amounts)RevenueRevenue per IFRSSignificant items recorded in Corporate and OtherFair value adjustments on certain illiquid and restricted marketable securitiesTotal revenue excluding significant item20222021Quarter-overquarter change 317,370 518,831(38.8)% 11,447328,817 5,000523,881128.9%(37.2)%CANACCORD GENUITY GROUP INC.FIRST QUARTER FISCAL 20233
Three months ended June 30(C thousands, except per share and % amounts)ExpensesExpenses per IFRSSignificant items recorded in Canaccord Genuity Capital MarketsAmortization of intangible assetsIncentive-based costs related to acquisitions(2)Significant items recorded in Canaccord Genuity Wealth ManagementAmortization of intangible assetsAcquisition-related costsIncentive-based costs related to acquisitions(2)Significant items recorded in Corporate and OtherCosts in connection with redemption of convertible debentures20222021Quarter-overquarter change 315,476 419,130(24.7)% 1,264367 293—n.m.n.m. 4,3127,582586 3,148—35137.0%n.m.67.0%— 5,464(100.0)%Total significant items – expensesTotal expenses excluding significant items 14,111301,365 9,256409,87452.5%(26.5)%Net income before taxes excluding significant items(1)Income taxes – adjustedNet income excluding significant items 27,4527,51719,935 t items impacting net income attributable to common shareholdersNon-controlling interests – IFRSAmortization of equity component of the non-controlling interests in CGWM UK and other adjustment 7,1691,504 1,052—n.m.n.m.Non-controlling interests (adjusted)(1) 5,665 1,052n.m.Net income attributable to common shareholders, excluding significant items 11,879 81,251(85.4)%Earnings per common share excluding significant items – basicEarnings per common share excluding significant items – diluted 0.130.11 0.840.73(84.5)%(84.9)%(1) Figures excluding significant items are non-IFRS measures. See Non-IFRS Measures on page 7.(2) Incentive-based costs related to the acquisitions and growth initiatives in the US capital markets and UK & Crown Dependencies wealth management business.Diluted earnings per common share (diluted EPS) is computed using the treasury stock method, giving effect to the exercise of all dilutiveelements. The Convertible Preferred Shares issued by CGWM UK are factored into the diluted EPS by adjusting net income attributable to commonshareholders of the Company to reflect our proportionate share of CGWM UK’s earnings on an as converted basis if the calculation is dilutive.For the quarter ended June 30, 2022, the effect of reflecting our proportionate share of CGWM UK’s earnings is anti-dilutive for diluted EPS purposesunder IFRS but dilutive for the purpose of determining diluted EPS excluding significant items (1). Accordingly, net income attributable to commonshareholders excluding significant items(1) for the first quarter of fiscal 2023 reflects the Company’s proportionate share of CGWM UK’s netincome on an as converted basis.Financial Condition at the End of First Quarter Fiscal 2023 vs. Fourth Quarter of Fiscal 2022: Cash and cash equivalents balance of 1.0 billion, a decrease of 753.5 million from 1.8 billion Working capital of 730.6 million, a decrease of 63.8 million from 794.4 million Total shareholders’ equity of 1.1 billion, a decrease of 88.1 million from 1.2 billionCommon and Preferred Share Dividends:On August 4, 2022, the Board of Directors approved a dividend of 0.085 per common share, payable on September 15, 2022, with a recorddate of September 2, 2022.On August 4, 2022, the Board approved a cash dividend of 0.25175 per Series A Preferred Share payable on September 30, 2022 to Series APreferred shareholders of record as at September 16, 2022.On August 4, 2022, the Board approved a cash dividend of 0.42731 per Series C Preferred Share payable on September 30, 2022 to Series CPreferred shareholders of record as at September 16, 2022.Non-IFRS MeasuresCertain non-IFRS measures, non-IFRS ratios and supplementary financial measures are utilized by the Company as measures of financialperformance. Non-IFRS measures, non-IFRS ratios and supplementary financial measures do not have any standardized meaning prescribed byIFRS and are therefore unlikely to be comparable to similar measures presented by other companies.Management believes that these non-IFRS measures, non-IFRS ratios and supplementary financial measures allow for a better evaluation of theoperating performance of the Company’s business and facilitate meaningful comparison of results in the current period to those in prior periods andfuture periods. Non-IFRS measures presented in this earnings release include certain figures from our statement of operations that are adjustedto exclude significant items. Although figures that exclude significant items provide useful information by excluding certain items that may not beindicative of the Company’s core operating results, a limitation of utilizing these figures that exclude significant items is that the IFRS accountingeffects of these items do in fact reflect the underlying financial results of the Company’s business. Accordingly, these effects should not be ignored4CANACCORD GENUITY GROUP INC.FIRST QUARTER FISCAL 2023
in evaluating and analyzing the Company’s financial results. Therefore, management believes that the Company’s IFRS measures of financialperformance and the respective non-IFRS measures should be considered together.Non-IFRS Measures (Adjusted Figures)Figures that exclude significant items provide useful information by excluding certain items that may not be indicative of the Company’s coreoperating results. Financial statement items that exclude significant items are non-IFRS measures. To calculate these non-IFRS financial statementitems, we exclude certain items from our financial results prepared in accordance with IFRS. The items which have been excluded are referredto herein as significant items. The following is a description of the composition of the non-IFRS measures used in this earnings release (note thatsome significant items excluded may not be applicable to the calculation of the non-IFRS measures for each comparative period): (i) revenueexcluding significant items, which is composed of revenue per IFRS less any applicable fair value adjustments on certain illiquid or restrictedmarketable securities as recorded for IFRS reporting purposes but which are excluded for management reporting purposes and are not used bymanagement to assess operating performance; (ii) expenses excluding significant items, which is composed of expenses per IFRS less anyapplicable amortization of intangible assets acquired in connection with a business combination, acquisition-related expense items, certain incentivebased costs related to the acquisitions and growth initiatives in CGWM UK and US capital markets, and costs associated with the redemptionof convertible debentures; (iii) net income before taxes excluding significant items, which is composed of revenue excluding significant items lessexpenses excluding significant items; (iv) income taxes (adjusted), which is composed of income taxes per IFRS adjusted to reflect the associatedtax effect of the excluded significant items; (v) net income excluding significant items, which is composed of net income before income taxesexcluding significant items less income taxes (adjusted); (vi) non-controlling interests (adjusted), which is composed of non-controlling interestsper IFRS less the amortization of the equity component of non-controlling interests in CGWM UK; and (vii) net income attributable to commonshareholders excluding significant items, which is composed of net income excluding significant items less non-controlling interests (adjusted) andpreferred share dividends paid on the Series A and Series C Preferred Shares.A reconciliation of non-IFRS measures that exclude significant items to the applicable IFRS measures from the interim condensed consolidatedfinancial statements for the first quarter of fiscal 2023 can be found above in the table entitled “Summary of results for Q1 fiscal 2023 and selectedfinancial information excluding significant items”.Non-IFRS RatiosNon-IFRS ratios are calculated using the non-IFRS measures defined above. For the periods presented herein, we have used the following nonIFRS ratios: (i) total expenses excluding significant items as a percentage of revenue, which is calculated by dividing expenses excluding significantitems by revenue excluding significant items; (ii) earnings per common share excluding significant items, which is calculated by dividing netincome attributable to common shareholders excluding significant items by the weighted average number of common shares outstanding (basic);(iii) diluted earnings per common share excluding significant items which is calculated by dividing net income attributable to common shareholdersexcluding significant items by the weighted average number of common shares outstanding (diluted); and (iv) pre-tax profit margin which is calculatedby dividing net income before taxes excluding significant items by revenue excluding significant items.Supplementary Financial MeasuresClient assets are supplementary financial measures that do not have any definitions prescribed under IFRS but do not meet the definition of a nonIFRS measure or non-IFRS ratio. Client assets, which include both assets under management (AUM) and assets under administration (AUA), is ameasure that is common to the wealth management business. Client assets is the market value of client assets managed and administered by theCompany from which the Company earns commissions and fees. This measure includes funds held in client accounts as well as the aggregatemarket value of long and short security positions. The Company’s method of calculating client assets may differ from the methods used by othercompanies, and therefore these measures may not be comparable to other companies. Management uses these measures to assess operationalperformance of the Canaccord Genuity Wealth Management business segment.CANACCORD GENUITY GROUP INC.FIRST QUARTER FISCAL 20235
Contents7101213182630Management’s Discussion and AnalysisMarket Environment During Q1 Fiscal 2023Core Business Performance Highlights for Q1 Fiscal 2023Financial OverviewBusiness Segment Results – Three months ended June 30,2022 compared with three months ended June 30, 2021Quarterly Financial Information – Prior eight fiscal quartersto Q1/23Outstanding Share Data31313232323435Financial InstrumentsRelated Party TransactionsCritical Accounting Policies and EstimatesChanges in Accounting PoliciesFuture Changes in Accounting Polices and EstimatesAdditional InformationUnaudited Interim Condensed Consolidated FinancialStatementsCAUTION REGARDING FORWARD-LOOKING STATEMENTSThis document may contain “forward-looking statements” (as defined under applicable securities laws). These statements relate tofuture events or future performance and reflect management’s expectations, beliefs, plans, estimates, intentions and similarstatements concerning anticipated future events, results, circumstances, performance or expectations that are not historical facts.Forward looking statements include, but are not limited to, statements about the Company’s objectives, strategies, businessprospects and opportunities; the execution of management’s plans and potential outcomes; the impacts of global events andeconomic conditions on the Company’s operations and business; and the outlook for the Company’s business and for the globaleconomy. Such forward-looking statements reflect management’s current beliefs and are based on information currently available tomanagement. In some cases, forward-looking statements can be identified by terminology such as “may”, “will”, “should”, “expect”,“plan”, “anticipate”, “believe”, “estimate”, “predict”, “potential”, “continue”, “target”, “intend”, “could” or the negative of theseterms or other comparable terminology. Disclosure identified as an “Outlook” including the section entitled “Outlook” containsforward-looking information. By their very nature, forward-looking statements involve inherent risks and uncertainties, both generaland specific, and a number of factors could cause actual events or results to differ materially from the results discussed in theforward-looking statements. In evaluating these statements, readers should specifically consider various factors that may causeactual results to differ materially from any forward-looking statement.These factors include, but are not limited to, market and general economic conditions, the dynamic nature of the financial servicesindustry and the risks and uncertainties and the potential continued impacts of the coronavirus (COVID-19) pandemic on theCompany’s business operations and on the global economy, and the impact of the war in Ukraine and the resulting humanitariancrisis on the global economy, in particular its effect on global oil, agriculture and commodity markets. Additional risks and factorsthat could cause actual results to differ materially from expectations are described in the Company’s interim condensed and annualconsolidated financial statements and the Company’s Annual Report and Annual Information Form (AIF) filed on www.sedar.com aswell as the factors discussed in the sections entitled “Risk Management” in this MD&A and “Risk Factors” in the AIF, which includemarket, liquidity, credit, operational, legal, cyber and regulatory risks. Material factors or assumptions that were used by theCompany to develop the forward-looking information contained in this document include, but are not limited to, those set out in theFiscal 2023 Outlook section in the annual MD&A and those discussed from time to time in the Company’s interim condensed andannual consolidated financial statements and its Annual Report and AIF filed on www.sedar.com. Readers are cautioned that thepreceding list of material factors or assumptions is not exhaustive.Although the forward-looking information contained in this document is based upon what management believes are reasonableassumptions, ther
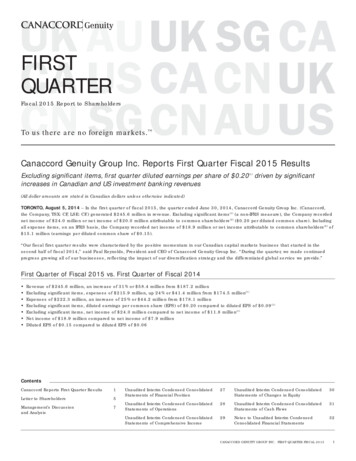
The following charts depict revenue, pre-tax net income(1) and earnings per share(1) contributions from our primary business segments for Q1/23 ended June 30, 2022: Capital Markets 50% Wealth Management 50% Capital Markets 14% Wealth Management 86% Capital Markets- 0.02 Wealth Management 0.13 Q1/23 EPS 0.11 (1) Figures excluding significant .