Transcription
Introduction2021 Capital Markets Fact BookJuly 20212021 Capital Markets Fact BookPage 1
IntroductionContentsIntroduction. 6Capital Markets Fuel Economies . 6US Capital Markets Are the Largest in the World . 7Highlights. 8US Capital Markets . 8Global Capital Markets . 8Investor Participation . 8Savings & Investment . 9US Securities Industry . 9US Capital Markets . 10US Fixed Income Securities Issuance - Value. 10US Fixed Income Securities Issuance – Number of Issues . 11US Equity Issuance – Value . 12US Equity Issuance – Number of Issues . 13US Corporate Bonds and Equity Issuance and Initial Public Offerings – Charts . 14US Private Placements – Value . 15US Private Placements – Number of Issues. 16US Long-Term Municipal Bond Issuance – Value . 17US Long-Term Municipal Bond Issuance – Number of Issues . 18US Long-Term Municipal Bond Issuance – Number of Issuers . 19Bank Qualified US Municipal Bond Issuance . 20US Equity and Debt Outstanding. 21US Stock Market Capitalization . 22US Stock Market Indices . 23US Interest Rates and Bond Yields . 24US Mergers and Acquisitions – Announced and Completed . 25US Fixed Income Securities Average Daily Trading Volume . 26Municipal Bond Average Daily Trading – Dollar Volume . 27Municipal Bond Average Daily Trading – Number of Trades . 28US Equity Markets Average Daily Trading Volume – Charts . 29Trading Activity of NYSE- and Nasdaq-listed Stocks . 30Futures Contracts Traded on US Exchanges . 31Options Contracts Traded on US Exchanges . 32US Mutual Fund Assets . 332021 Capital Markets Fact BookPage 2
IntroductionUS Mutual Fund Net New Cash Flow . 34Net Assets and Number of Exchange-Traded Funds (ETFs) - Chart . 35Global Capital Markets . 36Global Bond and Equity Issuance - Charts . 36Global Long-Term Bond Issuance . 37Global Equity Issuance . 38International Security Offerings by All Issuers - Market Value . 39International Security Offerings by All Issuers - Number of Issues . 40International Security Offerings by US Issuers - Market Value . 41International Security Offerings by US Issuers - Number of Issues . 42Global Bond Market Outstanding and Global Equity Market Capitalization - Charts . 43Global Bond Market Outstanding - Value . 44Global Bond Market Outstanding - Share of Total . 45Global Equity Markets Capitalization - Market Value. 46Global Equity Markets Capitalization - Share of Total . 47Global Derivatives Market Outstanding - Notional Principal . 48Global Investment Banking Net Revenues by Product - Charts . 49Global Investment Banking Net Revenues by Region . 50Global Mergers and Acquisitions – Announced and Completed. 51US Holdings of Foreign Securities. 52US Gross Activity in Foreign Securities . 53US Net Purchases of Foreign Securities . 54US Gross Activity in Foreign Equities by Region/Country . 55US Net Purchases of Foreign Equities by Region/Country. 56Foreign Holdings of US Securities. 57Foreign Gross Activity in US Securities . 58Foreign Net Purchases of US Securities . 59Foreign Gross Activity in US Equities by Region/Country . 60Foreign Net Purchases of US Equities by Region/Country. 61Major Global Stock Market Indexes . 62Foreign Exchange Rates . 63American Depositary Receipts (ADRs) . 64US Investor Participation . 65US Holdings of Equities – Market Value . 65US Family Holdings of Stock . 66US Household Equity Ownership . 67US Household Liquid Financial Assets - Market Value . 682021 Capital Markets Fact BookPage 3
IntroductionUS Household Liquid Financial Assets - Share of Total . 69US Holdings of Equities by Type of Holder - Market Value . 70US Holdings of Equities by Type of Holder - Share of Total . 71US Net Acquisitions of Corporate Equities by Type of Holder . 72Savings & Investment . 73US Retirement Assets . 73US Private Pension Funds Assets. 74US Private Pension Fund Assets Investment Mix . 75US Defined Benefit Plan Asset Investment Mix . 76US Defined Contribution Plan Asset Investment Mix. 77US Individual Retirement Account (IRA) Assets . 78US Individual Retirement Account (IRA) Assets . 79Household Saving Rates of Major Nations . 80US Economic Indicators . 81US Federal Receipts, Outlays, Deficit and Debt . 82Securities Industry . 83FINRA-Registered Broker-Dealers Financial Results . 83FINRA-Registered Firms and Registered Representative - Charts . 84NYSE Member Firms Aggregate Financial Results . 85NYSE Member Firms Aggregate Total Capital and Equity Capital - Charts . 86US Securities Industry Employment . 87US Investment Banking Net Revenues by Product - Charts. 88FINRA-Registered Broker-Dealers by State - Map . 89FINRA-Registered Representatives by State - Map . 90SEC- and State-Registered Investment Advisors by State - Map. 91Authors . 922021 Capital Markets Fact BookPage 4
IntroductionAssociated ReportsPlease also see the SIFMA Research databases and other publications at: https://www.sifma.org/ researchSIFMA Insights Primers: The SIFMA Insights primer series is a reference tool that goes beyond a typical 101 series. Byillustrating important technical and regulatory nuances, SIFMA Insights primers provide a fundamental understanding of themarketplace and set the scene to address complex issues arising in today’s markets. The SIFMA Insights market structureprimer series includes: global capital markets & financial institutions; U.S. fixed income markets; U.S. equity markets; U.S. multilisted options markets; U.S. ETF markets; and U.S. capital formation and listings exchanges. The primers and other Insightsreports can be found at: https://www.sifma.org/primersSIFMA is the leading trade association for broker-dealers, investment banks and asset managers operating in the U.S. and global capital markets. Onbehalf of our industry’s nearly 1 million employees, we advocate on legislation, regulation and business policy, affecting retail and institutional investors,equity and fixed income markets and related products and services. We serve as an industry coordinating body to promote fair and orderly markets,informed regulatory compliance, and efficient market operations and resiliency. We also provide a forum for industry policy and professionaldevelopment. SIFMA, with offices in New York and Washington, D.C., is the U.S. regional member of the Global Financial Markets Association (GFMA).For more information, visit http://www.sifma.org.This report is subject to the Terms of Use applicable to SIFMA’s website, available at http://www.sifma.org/legal. Copyright 20212021 Capital Markets Fact BookPage 5
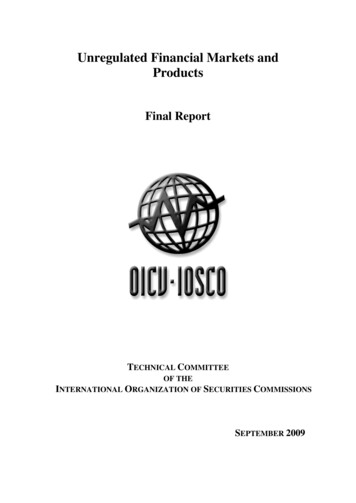
IntroductionIntroductionCapital markets recognize and drive capital to the best ideas and enterprises. Coupled with the free flow of capital,innovation is an integral component to a country for supporting job creation, economic development, and prosperity.Markets facilitate the transfer of funds from those who seek a return on their assets to those who need capital andcredit to expand.Clients benefiting from healthy capital markets include not just individual investors but also institutional investors,governments, and corporations. Capital, raised through equity and debt, can be used to grow businesses, financeinvestments in new plant, equipment and technology and fund infrastructure projects. This creates jobs and flowsmoney into the economy. Additionally, individuals and businesses can invest in securities to generate wealth.Capital Markets Fuel EconomiesIn the U.S., capital markets provided 73% of funding for economic activity, in terms of equity and debt financing ofnon-financial corporations. Capital markets enable debt issuance, which is a more efficient, stable, and lessrestrictive form of borrowing for corporations. The use of debt capital markets to fuel economic growth is moreprevalent in the U.S, at 80% of the total, whereas bank lending is more dominant in other regions, around 20% onaverage.On the equities side, companies need capital for various business purposes – to invest in growth, fund mergers andacquisitions, etc. – and firms have several ways they can generate capital, including issuing IPOs. IPOs allowbusinesses to grow, innovate and better serve their customers.In short, U.S. capital markets are the bedrock of our nation’s economy.Debt Financing of Non-Financial CorporationsFinancing of Non-Financial 5%79.2%97.7%50%79.8%30%7.7%Euro %ChinaSource: OECD, Federal Reserve, ECB, Bank of Japan, National Bureau of Statistics of ChinaNote: As of 2020, China 2017; Euro Area 19 EU-member states using the Euro; other financing (ex-China) insurance reserves, trade credits and tradeadvances; other financing (China) other, direct investments; economic activity defined as financing of non-financial corporations; EU 27 EU-member states;DCM debt capital markets corporate bonds only2021 Capital Markets Fact BookPage 6
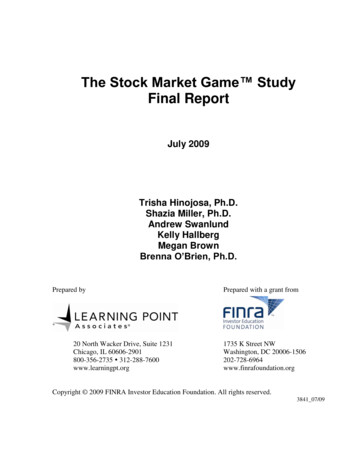
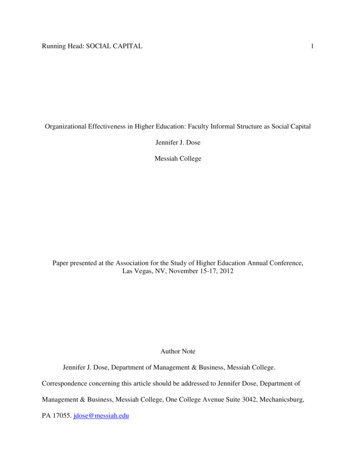
IntroductionUS Capital Markets Are the Largest in the WorldThe U.S. capital markets are largest in the world and continue to be among the deepest, most liquid, and mostefficient.Equities: U.S. equity markets represent 38.5% of the 105.8 trillion in global equity market cap, or 40.7 trillion; thisis 3.7x the next largest market, the EU.Global Equity Market Cap2020 - 105.8 6.3%3.8%Source: World Federation of Exchanges, SIFMA estimatesNote: For listed domestic companies; EM emerging markets, DM developed marketsFixed Income: U.S. fixed income markets comprise 38.3% of the 123.5 trillion securities outstanding across theglobe, or 47.2 trillion; this is 1.9x the next largest market, the EU.Global Bond Market Outstanding2020 - 123.5 U2720.4%Source: Bank for International Settlements, SIFMA estimatesNote: EM emerging markets, DM developed markets2021 Capital Markets Fact BookPage 7
HighlightsHighlightsUS Capital MarketsIn 2020, U.S. long-term fixed income issuance reached 12.2 trillion, a 48.1% increase from the previous year.Mortgage-backed securities issuance increased by 96.2% to 4.0 trillion, followed by corporate bonds ( 60.4% to 2.3 trillion) and Treasury securities ( 32.7% to 3.9 trillion). U.S. long-term municipal bond issuance increased13.6% to 484.5 billion, while federal agency securities increased 26.5% to 1.3 trillion. Asset-backed securitiesissuance volume fell 30.0% to 304.3 billion.Equity issuance, including common and preferred shares, totaled 390.0 billion in 2020, a 71.0% increase yearover-year. Initial public offering (IPO) volume, excluding closed-end funds, was 85.3 billion, up 74.7% from theprevious year. Follow-on, or secondary, issuance totaled 258.5 billion, up 77.8% from last year. U.S. merger andacquisition announced deals totaled 1.5 trillion in 2020, a 17.2% decrease from last year, while the value ofcompleted M&A deals decreased by 15.5% to 1.5 trillion.The U.S. stock markets recorded increases in 2020: the Dow Jones Industrial Average (DJIA) rose by 7.2%, endingthe year at 30,606.48; the S&P 500 Index was up 16.3% to close 2020 at 3,756.07; the Nasdaq Composite Indexincreased by 43.6% to 12,888.28; and the Russell 2000 Index gained 18.4% to end 2020 at 1,974.86. In 2020, theaverage daily trading volume for equities was 10.9 billion shares, up 55.4% year-over-year.Global Capital MarketsGlobal bond markets outstanding value increased by 16.5% to 123.5 trillion in 2020, while global long-term bondissuance increased by 19.9% to 27.3 trillion.Global equity market capitalization increased by 18.2% year-over-year to 105.8 trillion in 2020, while global equityissuance decreased by 52.9% to 826.8 billion.U.S. gross activity (purchases and sales) in foreign securities increased to 46.1 trillion in 2020, up 24.7% from2019. Foreign gross activity in U.S. securities increased by 19.6% to 98.3 trillion in 2020.Investor ParticipationFederal Reserve Board data showed the value of U.S households’ liquid assets increased by 16.7% to 58.5 trillionin 2020 from 50.2 trillion in 2019. Of total liquid assets held by U.S. households, 44.2% was in equities, 23.4% inbank depos-its and CDs and 19.2% in mutual funds, with the remaining 13.2% split between U.S. Treasurysecurities; agency & GSE securities; municipal bonds; money market funds; and corporate bonds.2021 Capital Markets Fact BookPage 8
HighlightsSavings & InvestmentTotal value of U.S. retirement assets increased by 8.1% to 41.8 trillion in 2020, according to Federal Reserve Flowof Funds accounts. Total pension assets rose 76.3% to 29.6 trillion while assets held in individual retirementaccounts increased by 12.5% to 12.2 trillion.US Securities IndustryThe number of FINRA-registered broker-dealers decreased by 2.3% to 3,435 in 2020.Pre-tax net income (profits) for FINRA-registered broker-dealers rose to 77.2 billion in 2020, up 75.7% from 43.9billion in 2019. Gross revenues totaled 362.0 billion in 2020, down 6.7% from the previous year, while totalexpenses declined by 17.3% to 284.8 billion.National securities industry employment, as reported by the U.S. Department of Labor, reached 975,600 jobs in2020, an increase of 0.9% from 967,300 year-over-year.2021 Capital Markets Fact BookPage 9
US Capital MarketsUS Capital MarketsUS Fixed Income Securities Issuance - Value BillionsFederalAgencySecuritiesABSTotal 5AverageY/Y % Change5-Year CAGR10-Year es: Bloomberg, Refinitiv, Treasury, US AgenciesNote: MBS mortgage-backed securities, ABS asset-backed securities. Includes long-term securities only. Corporate debt includes publicand private, convertible and non-convertible, investment grade and high yield bonds.2021 Capital Markets Fact BookPage 10
US Capital MarketsUS Fixed Income Securities Issuance – Number of IssuesNumber of 6267387337401,1667114,5482,988AverageY/Y % Change5-Year CAGR10-Year ources: Bloomberg, RefinitivNote: MBS mortgage-backed securities, ABS asset-backed securities. Includes long-term securities only. Corporate debtincludes public and private, convertible and non-convertible, investment grade and high yield bonds.2021 Capital Markets Fact BookPage 11
US Capital MarketsUS Equity Issuance – 017201820192020AverageY/Y % Change5-Year CAGR10-Year CAGRIPOsFollow-Ons 4%5.9%PreferredStockTotal EquitySource: DealogicNote: Includes rank eligible deals, exclu
2021 Capital Markets Fact Book Page 8 . Highlights . US Capital Markets . In 2020, U.S. long-term fixed income issuance reached 12.2 trillion, a 48.1% increase from the previous year. Mortgage-backed securities issuance increased by 96.2% to 4.0 trillion, followed by corporate bonds ( 60.4% to