Transcription
#044th issue 2018Implementing amulti-factorcommodity strategy:a practitioner’sapproachTail risk management for multi-assetmulti-factor strategiesESG integration for equities: evolvingour systematic investment processESG integration for fixed income: soundstewardship and social responsibilityWhat do corporate managers’ wordsreveal about their firms’ value?Risk & RewardResearch and investment strategiesThis magazine is not intended for members of the public or retail investors.Full audience information is available inside the front cover.
Important information: The publication is intended only for Professional Clients and Financial Advisers in Continental Europe (as defined in the importantinformation at the end); for Qualified Investors in Switzerland, Turkey and Russia; for Professional Clients in Dubai, Ireland, the Isle of Man, Jersey and Guernsey,and the UK; for Institutional Investors in Australia; for Professional Investors in Hong Kong; for Qualified Institutional Investors, pension funds and distributingcompanies in Japan; for Institutional Investors and/or Accredited Investors in Singapore; for certain specific Qualified Institutions/Sophisticated Investors only inTaiwan and for Institutional Investors in the USA. The document is intended only for accredited investors as defined under National Instrument 45–106 inCanada.It is not intended for and should not be distributed to, or relied upon, by the public or retail investors.Global editorial committeeChair: Kevin Lyman and Stephanie Valentine. Jutta Becker, Jessica Cole,Ann Ginsburg, Kristina Hooper, Marlene Konecny, Dr. Harald Lohre, SarahMumford, Paula Niall, Tracie M. Reinke, Stephen Smith, Dr. Henning Stein,Paul Unsworth.
Invesco is one of the world’s leading specialists in factor investing, andhas been using factor approaches to meet client needs for more than30 years – long before they became mainstream. For us, factorinvesting is indeed more than a fashion, so it will come as no surprisethat our feature article and the interview once again deal with thispopular investing approach.In this edition, my colleagues show that the factorapproach is by no means confined to equities.In their latest research, they apply it to commodities,where their profound knowledge of equity factorsprovided a number of synergies. Doubtless, however,commodity factors are different and specialized, sobeing a multi-asset class manager like Invescocertainly has its advantages.In another article on factors, we also looked at tailrisk management through the factor lens. Theirresults are as simple as they are compelling:diversification helps to mitigate tail risks, even in thefactor space.As important as it is, factor investing is only partof the comprehensive range of capabilities weoffer to help meet client needs. Another majortopic in today’s markets is ESG integration, i.e.mainstreaming of ecological, social and governanceconsiderations in investment processes. Wedemonstrate how two of our investment teamsoperationalize this concept: first, we report on ESGintegration in our systematic processes, then aboutESG integration in Fixed Income. While the detailsof the approaches differ, they share a commonphilosophy. This is one of the key strengths of ourmulti-product multi-style approach: individualconcepts based on shared values.Risk & Reward, #4/2018Finally, let me draw your attention to a specialhighlight in this issue: three colleagues haveinvestigated the predictive power of managers’ talkin financial results conference calls. They derive hardindicators from seemingly soft rhetoric – and showhow useful manager-tone can be when forecastingan individual stock’s return.We hope you enjoy this latest issue of Risk & Reward.Best regards,Marty FlanaganPresident and CEO of Invesco Ltd.1
ContentsFeature4Implementing a multi-factor commoditystrategy: a practitioner’s approachScott Hixon, Hua Tao, PhD, and Scott WolleInvesco has developed a factor-based commodity strategy whichtakes note of the particular features of this asset class. Learnmore about the motivations, potential issues and implementationconsiderations from a practitioner’s perspective.12“A practitioner’s approach should combine rigor withpragmatism”Interview with Scott Hixon, Hua Tao, PhD, and Scott WolleWe spoke to the authors of the commodity factor study in thisissue about their experiences adapting the factor approach tocommodities.Risk & Reward, #4/20182
In focus14Tail risk management for multi-assetmulti-factor strategiesDavid Chambers, PhD, Dr Harald Lohre andCarsten RotherThe authors explore how the risk parityparadgim can effectively navigate the nonnormality of factor returns and controloverall portfolio tail risk.21ESG integration for equities: evolving oursystematic investment processManuela von Ditfurth, Michael Fraikin andAlexander UhlmannInvesco Quantitative Strategies hasundertaken intensive research to identifythe potential benefits of integratingexternal ESG scores into its investmentprocess for equities.28ESG integration for fixed income: soundstewardship and social responsibilityPaul EnglishAt Invesco Fixed Income, we are convincedthat attention to sound environmental,social and governance (ESG) practices canlead to better value for our clients.32What do corporate managers’ wordsreveal about their firms’ value?Michael Fraikin and Xavier Gerard, PhDWe show how we derive hard indicatorsfrom seemingly soft rhetoric – and howuseful manager-tone can be whenforecasting an individual stock’s returns.Risk & Reward, #4/20183
Implementing a multi-factor commoditystrategy: a practitioner’s approachBy Scott Hixon, Hua Tao, PhD, and Scott WolleIn briefIn this paper we propose a commodity strategy thatincorporates cross-sectional factors grounded in therich research available on commodity futures pricing.Over the period studied, the strategy exhibited anattractive return profile with no significant correlationto general commodity markets. To the best of ourknowledge, the methodology employed differs fromexisting commodity factor research in two ways: First,rather than simply applying equity factor definitionsto commodity markets, we have incorporated theunique characteristics of commodity markets intofactor construction. Second, the final portfolio isconstructed using a risk parity framework along withseveral implementation considerations. Liquidity,leverage and turnover, which are largely overlookedin most factor research literature, are importantimplementation constraints.Risk & Reward, #4/20184
Factor investing has become mainstream, butmost approaches still focus on equites. We havedeveloped a factor-based commodity strategywhich takes note of the particular features of thisasset class. Read on to learn more about themotivations, potential issues and implementationconsiderations from a practitioner’s perspective.Since 1992, when Fama and French proposed sizeand value as powerful descriptors of cross-sectionalequity returns, factor investing research has generatedincreasing interest among both academics andpractitioners. Over the past twenty-five years, therehave been so many anomaly papers published that itis almost impossible for anyone to keep up with theentire scope of this research. Harvey, Liu and Zhu(2013) identify 316 different factors in 313 articles,representing just a sample of the universe of papers.1Whether described as smart beta, factor investing orenhanced indexing, these strategies are all derivedfrom the same idea: go long (overweight) assetswith high values in a particular metric and short(underweight) assets with low values in the samemetric. However, most of these studies and strategieshave one thing in common – they refer to equities.Commodities have a much shorter history as amainstream asset class. Institutional investors hadinvested only USD 18 billion in commodities in 2003according to a Barclays Capital survey.2 But due tothe growth in multi-asset strategies and the inflationhedging property of commodities, institutionalinvestors have become increasingly interested in theasset class. Therefore, we believe that the time hascome to look at commodities from a factor perspective.Four commodity factorsTo start with, commodity factors should satisfy thesame three properties as equity (or indeed currencyor bond) factors: first, their definitions should beintuitive and driven by a fundamental understandingof commodity markets instead of empirical results,in order to minimize the risk of mere data mining.Second, they should offer positive returns over time,3though achieving the highest in-sample return isnever the goal. Third, factors used in a multi-factorcommodity strategy should be differentiated in termsof their information content. In other words, thereshould be no strong positive correlations amongthem.With these properties in mind, we constructed threecross-sectional factors – momentum, value and carry– using 20 commodity futures. We also constructed afourth factor, which we identify as defensive, with asomewhat different structure described later in thisstudy. We will now discuss these four factors one byone.We construct three crosssectional factors – momentum,value and carry – and a fourthfactor, which we identify asdefensive, with a somewhatdifferent structure.MomentumMomentum was first proposed as a factor byJegadeesh and Titman in their seminal 1993 paper.It is based on the assumption of price continuation,i.e. stocks with the highest intermediate-term returns(winners) will outperform stocks with the worst pastOur commodity futures universeOur commodity futures universe is similar to that of the S&P GSCI Commodity Index, with some modifications due to l metalsPrecious metals—— Cocoa—— Coffee—— Corn—— Cotton—— Feeder Cattle—— Lean Hogs—— Live Cattle—— Soybeans—— Soybean Oil—— Soy Meal—— Sugar—— Wheat—— Wheat (KC)—— Brent Crude—— Gas Oil—— Gasoline—— Heating Oil—— Natural Gas—— WTI Crude—— Aluminum—— Copper—— Lead—— Nickel—— Zinc—— Gold—— SilverLegend: Included in GSCI, not in strategyNot included in GSCI, included in strategyWe exclude six of 24 commodities (lead, sugar, cotton, lean hogs, live cattle and feeder cattle) in the index and include twoadditional commodities (soybean oil and soy meal). The resulting universe of 20 commodities includes six energy commodities(crude oil, Brent crude oil, heating oil, gasoil, natural gas and gasoline), two precious metals (gold and silver), four industrialmetals (copper, aluminum, zinc and nickel) and eight agricultural commodities (cocoa, coffee, corn, wheat, wheat (KC), soybeans,soybean oil and soymeal).Source: Invesco, as at 30 June 2018.Risk & Reward, #4/20185
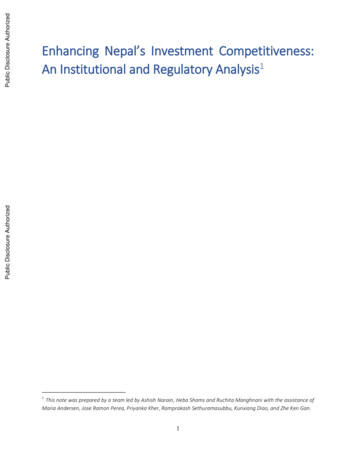
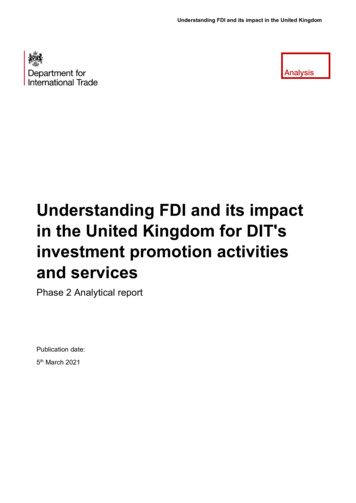
Figure 1The momentum factor—— The tendency for assets that have risen in valueto continue to rise—— Adjust for differences in asset volatilities—— Representative academic research: “MomentumStrategies in Commodity Futures Markets”Figure 2The carry factor—— The tendency for assets that have high impliedroll yields to produce higher total returns thanother assets—— Representative academic research: “The Strategicand Tactical Value of Commodity Futures”Simulated annualized excess return by factor rank, in %(30 June 1998 – 30 June 2018)Simulated annualized excess return by factor rank, in %(30 June 1998 – 30 June umLowSources: Bloomberg, Datastream, Invesco analysis. Joëlle Miffre,and Georgios Rallis, “Momentum Strategies in Commodity FuturesMarkets”, (5 August 2006). Journal of Banking and Finance,Vol. 31, No. 9, 2007. Available at SSRN: https://ssrn.com/abstract 702281 or http://dx.doi.org/10.2139/ssrn.702281.Returns based on changes in prices for future contracts which areby nature excess returns above cash. Figures refer to simulatedpast performance and past performance is not a reliableindicator of future performance.Sources: Bloomberg, Datastream, Invesco analysis. Claude B. Erband Campbell R. Harvey, 2005. “The Strategic and Tactical Valueof Commodity Futures”, NBER Working Papers 11222, NationalBureau of Economic Research, Inc.Returns based on changes in prices for future contracts which areby nature excess returns above cash. Figures refer to simulatedpast performance and past performance is not a reliableindicator of future performance.performance (losers) for up to 12 months. Muchlater, momentum strategies were applied tocommodity futures markets, e.g. by Pirrong (2005),Erb and Harvey (2006) and Miffre and Rallis (2007),and similar positive returns were observed.For many assets, carry and momentum are negativelyor, at best, weakly correlated. For example, a bondwith weak momentum will likely have improvedcarry. Commodities are different, as the same basicphenomena drive both momentum and carry. Forexample, when demand for a commodity outstripssupply, we should expect the price of a commodity torise. At the same time, the term structure will almostcertainly respond with positive carry (also described asbackwardation). Our research shows a 0.38 correlationbetween carry and momentum over the past twentyyears.6 Figure 2 depicts historical results for carry.Rather than raw one-year returns, a commonmeasure in the literature, we define momentum interms of risk-adjusted returns.4 Volatility can varywidely across commodities and focusing on riskadjusted returns will prevent simply selecting assetswith extreme volatilities. Figure 1 shows summaryresults for commodity momentum.We construct the momentum factor portfolio byranking the 20 commodities by their risk-adjustedmomentum signals, going long the top 40% andshort the bottom 40%. These thresholds were chosento balance the desire to have some buffer betweenlong and short assets and to avoid concentrating riskin a small number of positions; however, a range ofdefinitions produces similar results. We apply thesame ranking process to the carry and value factors.CarryA significant body of research supports the notionthat the futures price curve, also called the termstructure, contains information about the marketand its related economic fundamentals.5 All thingsequal, one should expect an upward-sloping termstructure since the futures curve needs to embedthe costs of holding the asset (e.g. financing andstorage costs). However, the curve will shift to adownward-sloping profile when market participantsascribe greater value to immediate delivery. This isgenerally referred to as the convenience yield.Risk & Reward, #4/2018ValueValue is often viewed as the natural complement tomomentum, given its contrarian nature. For equities,Conrad and Kaul (1998) concluded that contrarianstrategies tend to perform well over long horizons,while momentum strategies perform better overshort-to-intermediate horizons. In recent years, anumber of researchers have explored applying bothmomentum and value (reversal) metrics in the assetselection process. We construct the momentum andvalue factors separately in order to benefit more fullyfrom the available diversification among factors.Asness, Moskowitz and Pedersen (2013) proposed aquite reasonable definition of value for commodities:the five-year change in spot returns.7 Such a definitionpossesses the virtues of simplicity, negative correlationto momentum and at least some degree of efficacy.The challenge is that it also has a material negativeexposure to carry. Fundamentally, this makes sense.Asset prices generally fall due to a surplus of supplyover demand, a situation generally accompanied bysizable negative carry (also known as contango).6
Figure 3“Simple value” has substantial negative carryAnnualized carry loadings of a simple value strategy based onlyon the five-year change in the spot price, in %40Figure 4The value factor—— Assets that have fallen in value over an extendedperiod of time will tend to outperform otherassets—— Adjust for bias to have negative carry—— Representative research: “CombiningMomentum with Reversal in Commodity Futures”Simulated annualized excess return by factor rank, in %(30 June 1998 – 30 June 2018)-412-89-126-16-20 6/9836/026/066/106/146/18Sources: Bloomberg, Datastream, Invesco analysis. Data as at30 June 2018.0-3-6-9This means that, for commodities unlike most otherassets, value and carry will tend to have a negativecorrelation.While a negative correlation between factors iscertainly attractive, negative loadings on a factorwith positive expected returns is not (figure 3).Therefore, we augment our definition by neutralizingthe negative loadings on carry using negativecarry for an asset as an additional hurdle to itsclassification as an undervalued asset. For example,an asset with -10% annualized carry must havefallen more significantly over the past five years tobe considered inexpensive than one without negativecarry. The resulting definition has a near-zerocorrelation with both momentum and carry whileproviding a far more compelling return profile, asshown in figure 4.DefensiveDefensive strategies cover a range of approaches,including quality (Asness, Frazzini and Pedersen[2013]) and low volatility (Haugen and Heins[1975]). Although some research has explored across-sectional low volatility strategy in commodities(Lin [2017]), we chose to define our defensivestrategy based on contract selection for the sameasset. Instead of buying front month contracts,we buy contracts with a more distant expiration(deferred). Deferred contracts typically have lowervolatility than front month contracts (for example,the third available WTI crude oil contract has about90% of the volatility of the front month). Thisapproach is consistent with Szymanowska, De Roon,Nijman and Van Den Goorbergh (2014), who foundthat buying contracts with distant maturities insteadof front month contracts improved the Sharpe ratiofrom 0.48 to as high as 1.06. Figure 5 shows theresults for the defensive factor.From commodity factors to a factor portfolioFor each of the three cross-sectional factors, we applya risk parity framework to create a factor strategy.Both the long and short side of each factor strategyare weighted according to each asset’s volatility andcorrelation characteristics. In this case, more volatile,Risk & Reward, #4/2018HighMediumLowSources: Bloomberg, Datastream, Invesco analysis. R. Bianchi,M. Drew and J. Fan (2015). “Combining momentum with reversal incommodity futures”. Journal of Banking & Finance, 59, 423–444.Returns based on changes in prices for future contracts which areby nature excess returns above cash. Figures refer to simulatedpast performance and past performance is not a reliableindicator of future performance.highly correlated assets will tend to receive smallerweights than less volatile uncorrelated assets. In ourexperience, a risk parity approach helps to improveportfolio diversification versus a simple 1/N allocationapproach, particularly when there are wide variationsin the characteristics of the asset universe. Inaddition to the allocation framework, we have alsoincluded a risk target (10%) for both the long andshort side of each factor strategy.Figure 5The defensive factorThe tendency for lower volatility assets – in thecase of commodities, deferred contracts – tooutperform higher volatility onesSimulated annualized return by factor rank, in %(30 June 1998 – 30 June 2018)129630-3-6-9Deferred ContractFront MonthSources: Bloomberg, Datastream, Invesco analysis.Figures refer to simulated past performance and pastperformance is not a reliable indicator of future performance.7
For the defensive factor, trading two futures contractsin the same asset tends to lead to a strategy withrelatively low volatility. In order to maintain lowleverage, we have chosen to implement the strategyonly on the assets where we have a long positionbased on the three preceding factors rather than asa fully independent factor. Despite this more limitedexposure to the factor, the annualized return of themulti-factor portfolio improved by approximately 2%without increasing portfolio risk.Factor constructionThe goal of factor construction is to isolate theperformance of the factor in question, thus minimizingidiosyncratic risk exposures. In a relatively smallinvestment universe such as we have with commodities,standard approaches to portfolio construction canresult in risk concentration, especially when some ofthe assets possess vastly different volatilities thanthe average. For example, a highly volatile asset likenatural gas can have an outsized impact on resultsunder an equally weighted approach. Likewise, aweighting scheme based on ordinal rank presentsdifficulties due to both the small number of assetsand the wide range of volatilities.As a result, we use a risk parity framework for long/short factor construction. The process has two steps:First, we calculate the long-side asset weights, suchthat each individual asset has the same marginal riskcontribution to the long-side portfolio. We apply thesame process to create the short-side portfolio.Second, we scale the long and short sides so thateach has the same marginal risk contribution to thefactor portfolio.A key input to this risk parity framework is the assetcovariance matrix, which determines both thecorrelation structure of commodity assets and therisk estimation of individual assets. Investors needto balance two considerations when deciding howto construct the covariance matrix. A shorter-termmatrix will tend to have greater accuracy on averagebut will tend to be wrong at inconvenient times.A longer-term matrix will have the opposite propertiesalong with lower turnover unrelated to changes in thefactors. We have a bias toward the latter in order toincorporate the full-cycle behaviour of the assetsand therefore apply a matrix with a seven-year halflife.Portfolio allocation on factorsThe next phase focuses on constructing a multi-factorportfolio using three cross-sectional factors:momentum, value and carry. We again apply a riskparity approach to achieve this goal. We could havechosen to do so based on historic returns of eachfactor or the current holdings of each factor. Manypeople naturally gravitate to the former. Despite theappeal of its simple and straightforward nature, ithas a material flaw: factor portfolios are dynamic.For example, the momentum and value factors maytypically have a negative correlation but in aparticular month may have similar holdings and thusbe highly correlated. This results in at least twochallenges: (1) value and momentum contributemore than the targeted level of risk relative to carryin this example and (2) the overall portfolio risk risesabove the target due to the reduced diversificationbenefit.Risk & Reward, #4/2018Figure 6Holding-based factor correlationsEx-ante factor correlationsMomentum – value1.0Average 86/136/18Momentum – carry1.0Mom-valueAverageAverage 86/136/18Carry – value1.0mom-carryColumn2Average 86/136/18Sources: Bloomberg, Datastream, Invesco analysis. Data as at 30 June 2018.carry-valueColumn2To alleviate these challenges, we look through eachfactor to the underlying holdings and weigh the factorsin a way that results in an equal risk contributionfrom each. This means changing the factor weightseach month based on changes in their holdings. Asshown in figure 6, the fact that factor correlationscan change from quite high (2018) to very low (late2010 – early 2011) means that this approach is theonly realistic means of maintaining a consistentstrategy risk target and factor risk contribution.8
Occasionally, all three factors may buy or sell thesame assets at the same time, which means themulti-factor portfolio may have very large exposureto individual assets. Even though the multi-factorportfolio has equal risk contributions from underlyingfactors, we may find a concentration of risk in a fewassets. We address this issue by limiting the exposureto any single asset to a maximum of 20% of theportfolio’s net asset value.By combining three diversified factors, the multifactor portfolio can offer much better performancethan any of the factors individually. The returnprofile is also very attractive due to low correlationto traditional commodity, equity and bond returns.Simulated resultsBacktested results always merit a skeptical eye. Thisis all the more true when the strategy exhibits highturnover. As described so far, the process wouldrequire more than 30% monthly turnover, which couldlimit strategy capacity, incur unnecessarily hightransaction costs and generally reduce the reliabilityof the backtests.Of course, some turnover is simply noise. Changes ofone or two percent in commodity weights in any givenmonth may have very limited influence on resultsbut still have a large cumulative effect on turnoverand costs. Accordingly, we explored how limitingtrades to only the most meaningful ones would impactperformance. The answer – consistent with ourexperience in other strategies – is that limiting tradesdoes not have a meaningful impact on performance,even on a pre-transaction cost basis. We thereforeapply a turnover threshold to the strategy.Investors understandably care about leverage aswell. In this sense, commodities fit well within afactor strategy. Their high volatility and relativelylimited correlations mean that little or no leverageis required to implement a strategy at 10% volatility.As highlighted in figure 7, the gross exposure (longpositions plus short positions) seldom breaches200% and is often closer to 100% (though with muchless volatility than a long-only investment).The historical performanceof the strategy lends strongsupport for factor investingin commodities.Figure 7Simulated exposuresLong weightsShort weightsNet urces: Bloomberg, Datastream, Invesco analysis. Data as at 30 June 2018.LongShortNetFigure 8Returns and correlationsSimulated strategySharpe ratio(30 June 1998 –30 June 2018)Simulated calendar year returns, in %(1999 – 131517Simulated rolling 12m correlation with Bloomberg Commodity Index (30 June 1998 100)1.00.80.60.40.20.0-0.2The historical performance of the strategy, even afterimposing the constraints described above, lendsstrong support for factor investing in commodities.As shown below, the high Sharpe ratio for the fullperiod studied is driven by consistent returns bycalendar year (top right panel in figure 8). In addition,the strategy has a slightly negative correlation to theBloomberg Commodity Index over the full period,though this is punctuated by episodes of moderatelyhigh and low correlations, peaking at an absolutevalue of just above 0.5. In all, the performance fitswell with our initial objectives.Risk & Reward, #4/2018-0.4Average /156/17Sources: Bloomberg, Invesco analysis. Data as at 30 June 2018. Figures refer to simulatedpast performance and past performance is not a reliable indicator of future performance.Full StrategyAverage9
ConclusionFactor investing research to date has generallyfocused on equities. However, commodities are anatural next frontier given the deep roots of researchinto pricing anomalies. Based on the results of thisresearch, factor investing in commodities appearsto offer the potential to extend the asset class froma reliable inflation hedge to a consistent returngenerator, irrespective of the economic environment.As we have found in virtually all of our research,the inputs – underlying factors in this case – areimportant but require a sound portfolio constructionprocess to achieve the desired results: in this case,attractive prospective returns and low expectedcorrelation to traditional financial markets.ReferencesAsness, C., Moskowitz, T., and Pedersen, L. (2013).“Value and momentum everywhere”, Journal ofFinance, 68, 929–985.Conrad, J. and Kaul, G. (1998). “An anatomy oftrading strategies”, Review of Financial Studies,11(3), 489–519.Erb, C., and Harvey, C. (2006). “The strategic andtactical value of commodity futures”, FinancialAnalysts Journal, 26, 69–97.Fama, E., and French, K. (1987). “Commodityfutures prices: some evidence on forecast power,premiums, and the theory of storage”, Journal ofBusiness, 60, 55–7.Fama, E., and French, K. (1992). “The Cross-Sectionof Expected Stock Returns,” Journal of Finance 47,427–465.Hirshleifer, D. (1989). “Determinants of hedging andrisk premia in commodity futures markets”, Journalof Financial and Quantitative Analysis, Vol. 24, No.3, 313–331.McCallum, A., and Wu, T. (2005). “Do oil futuresprices help predict future oil prices?”, FRBSFEconomic Letter, 2005–38.Miffre, J. (2016). “Long-short commodity investing:a review of the literature”, Journal of CommodityMarkets, Vol. 1, No. 1, 3–13.Miffre, J. and Rallis, G. (2007). “Momentumstrategies in commodity futures markets”, Journal ofFinancial Economics 104, 228–250.Mouakhar, T., and Roberge, M. (2010). “The optimalapproach to futures contract roll in commodityportfolios”, Journal of Alternative Investments,Winter, 51–60Pirrong, C. (2005). “Momentum in futures markets”,Unpublished working paper, University of Houston.Swanson, N., and White, H. (1995). “A modelselection approach to assessing the information inthe term structure using linear models and artificialneural networks”, Journal of Business & EconomicStatistics, 13.3, 265–275.Szymanowska, M., De Roon, F., Nijman, T., and VanDen Goorbergh, R. (2014). “An anatomy ofcommodity futures risk premia”, Journal of Finance,69, 453–482Working, H. (1949). “The Theory of the price ofstorage”, American Economic Review, 39, 1254–1266.Fuertes, A.-M., Miffre, J. and Fernandez-Perez, A.(2015). “Commodity Strategies Based onMomentum, Term Structure, and IdiosyncraticVolatility”, Journal of Futures Market, 35, 274–297.Gao, Lin, Commodity Option Implied Volatilities
This magazine is not intended for members of the public or retail investors. . additional commodities (soybean oil and soy meal). The resulting universe of 20 commodities includes six energy commodities . i.e. stocks with the highest intermediate-term returns (winners) will outperform stocks