Transcription
FREIGHT ANALYSIS FRAMEWORK VERSION 5Getting Started Guide for the Data Tabulation Tool (DTT)July 20, 2021Prepared byOak Ridge National Laboratory
TABLE OF CONTENTS1Introduction to Data Tabulation Tool (DTT) . 32Data Tabulation . 332.1Tabulation of Total Flows . 32.2Tabulation of Domestic Flows . 62.3Tabulation of Foreign Trade Flows . 6Data Visualization . 83.1Visualization of Total Flows . 93.2Visualization of Domestic Flows . 163.3Visualization of Foreign Trade Flows . 17Appendix A: Glossary of Terms . 222
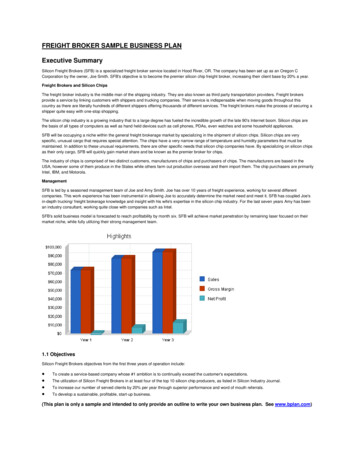
1 Introduction to Data Tabulation Tool (DTT)The Data Tabulation Tool (DTT) is a web-based interface that allows FAF users to createcustomized subsets of FAF5 data through easy-to-use pull-down menus. Users can choose oneof the three types of FAF5 data: Total Flows, Domestic Flows, and Foreign Trade Flows (Flowsof Imports and Exports). See Appendix A for further definitions of these flows. In addition todata extraction via DTT, an enhancement was made to the FAF5 webtool that allows users tovisualize their extracted data.2 Data Tabulation2.1Tabulation of Total FlowsBy default, the DTT provides a selection for Total Flows. The following additional dataselection categories are available in the DTT. A short description of a menu is displayed whenusers hover mouse pointer over it. To make multiple selections from a menu, hold the controlkey while making a selection (by clicking on the menu item). Year: The FAF5 synchronized historical base years (1997-2012) are available only whenusers select the data at state level. As future FAF5 products (annual and forecast) aredeveloped and become available, selection of other years will be activated, and resultswill be provided for each year selected.Measure: The options are “tons”, “value”, “tmiles”, and “current value.” The “tmiles”represents ton-miles and “current value” represents value in current US dollar. Note thatthe estimate for “tmiles” is not yet available; thus, this option is inactive at the currenttime.Origin-Destination Geography:o Domestic Origin: Hover your mouse pointer over “Domestic Origin” button andselect from options “All Domestic Origins Combined” or “Select All/SpecificDomestic Origins” to obtain data on associated shipments at the desired domesticorigin geography. All Domestic Origins Combined is not origin specific; it provides the totalof freight movements originated within the United States, including bothdomestic shipments and domestic legs of foreign trade shipments. Select All/Specific Domestic Origins allows selection from options “FAFzone (sort by state)”, “FAF zone (alphabetical order)”, or “State.” FAFzone selections provide a pull-down menu for the 132 FAF regions. Bydefault, all regions are selected; you can select one or multiple regions ifneeded. For ease of use, two options are provided for the listing of FAFregions (one by state name and another by alphabetical order of the FAFzone name). State selection provides a pull-down menu for the 50 Statesand Washington, D.C. By default, all states are selected; you can selectone or multiple states if needed. Both FAF regions and states can also beselected from a map. To do this, first you need to click on the US mapicon and then click on the desired zone or state. Figure 1 shows cases3
where (a) FAF zones “061 – Los Angeles CA” and “062 – SacramentoCA” are selected as Domestic Origin from the pull-down menu, (b) thesetwo FAF regions are selected using the map; (c) Arkansas and Connecticutare selected as Domestic Origin from the pull-down menu, (d) these twostates are selected using the map.(a)o(b)(c)(d)Fig. 1. Selection of Domestic OriginDomestic Destination: Hover your mouse pointer over “Domestic Destination”button and select from options “All Domestic Destinations Combined” or “SelectAll/Specific Domestic Destinations” to obtain data on associated shipments at thedesired domestic-destination geography. All Domestic Destinations Combined is not destination specific; itprovides the total freight movements terminated within the United States,including domestic shipments and domestic legs of foreign tradeshipments. Select All/Specific Domestic Destinations allows selection from options“FAF zone (sort by state)”, “FAF zone (alphabetical order)”, or “State.”FAF zone selections provide a pull-down menu for the 132 FAF regions.By default, all regions are selected; you can select one or multiple regionsif needed. As with the domestic origin selection, two options are providedfor the listing of FAF regions (one by state name and another byalphabetical order of the FAF zone name). State selection provides a pulldown menu for the 50 States and Washington, D.C. By default, all statesare selected; you can select one or multiple states if needed. Both FAFregions and states can also be selected from a map. To do this, first youneed to click on the US map icon and then click on the desired zone orState.4
Commodity: Hover your mouse pointer over “Commodity” button and select fromoptions “All Commodities Combined” or “Select All/Specific Commodities.”o All Commodities Combined is not commodity specific and provides total freightmoved of all commodities as a whole.o Select All/Specific Commodities provides a pull-down menu for commodity types.By default, all commodities are selected; you can select one or multiplecommodities if needed. Figure 2 shows a case where “05 – Meat/seafood” and“08 – Alcoholic beverages” are selected as the commodity.Fig. 2. Selection of Commodity Mode & Distance:o Domestic Mode: Hover your mouse pointer over “Domestic Mode” button andselect from options “All Domestic Modes Combined” or “Select All/SpecificDomestic Modes.” All Domestic Modes Combined is not mode specific and provides totalfreight moved by all modes as a whole. Select All/Specific Domestic Modes provides a menu for domestic modes.By default, all modes are selected; you can select one or multiple modes ifneeded. Figure 3 shows a case where “1 – Truck” and “3 – Water” areselected as the domestic mode.Fig. 3. Selection of Domestic Modeo Distance Band: Hover your mouse pointer over “Distance Band” button and clickto activate the option to select the range of estimated routed distance for thedomestic portion of shipment. The estimates for distance ranges are not yetavailable; thus, these options are inactive at the current time.Display Output Labels as Descriptive: This button provides the option to select how theoutput labels will be displayed. The options for labels are either descriptive (e.g., “truck”for mode) or numeric (e.g., “1” for mode). By default, descriptive labels are selected.You can slide the button to the left should you need the output labels as numeric.Once all desired selections are made, click the Run button and the results will be shown on thescreen under “Extracted Data” tab with an option to download a CSV file. Note that, you canclick on a column heading of the resulting table shown on the screen to reorder the displayed5
values by that selected variable (column). A second click on the same variable heading willreverse the ranking order.2.2Tabulation of Domestic FlowsTo obtain Domestic Flows, select “Domestic Flows” from the “Flow Type” pull-down menu.The procedure for tabulation is similar to that of Total Flows. Please refer to Section 2.1 fordetails.2.3Tabulation of Foreign Trade FlowsThe DTT can also be used to obtain specific flows of foreign trade (Imports and Exports). Toactivate the options for Import Flows in the DTT, users need to select “Import Flows” from“Flow Type” pull-down menu. The following additional data selection categories are availablefor Import Flows. Year: The FAF5 synchronized historical base years (1997-2012) are available only whenusers select the data at state level. As future FAF5 products (annual and forecast) aredeveloped and become available, selection of other years will be activated, and resultswill be provided for each year selected.Measure: The options are “tons”, “value”, “tmiles”, and “current value.” Note that theestimate for “tmiles” is not yet available; thus, this option is inactive at the current time.Origin-Destination Geography:o Foreign Origin: Hover your mouse pointer over “Foreign Origin” button andselect from options “All Foreign Origins Combined” or “Select All/SpecificForeign Origins.” All Foreign Origins Combined is not origin specific; the option presentsthe total volume of freight entering the United States from all foreigncountries as a whole. Select All/Specific Foreign Origins provides a menu for foreign origins.By default, all foreign origins are selected; you can select one or multipleforeign origins if needed.o US Entry Region: Hover your mouse pointer over “US Entry Region (DomesticOrigin)” button and select from options “All US Entry Regions Combined” or“Select All/Specific US Entry Regions.” Please refer to Section 2.1 for moredetails related to these options.o Domestic Destination: Hover your mouse pointer over “Domestic Destination”button and select from options “All Domestic Destinations Combined” or “SelectAll/Specific Domestic Destinations.” Please refer to Section 2.1 for more detailsrelated to these options.Commodity: Hover your mouse pointer over “Commodity” button and select fromoptions “All Commodities Combined” or “Select All/Specific Commodities.” Pleaserefer to Section 2.1 for more details related to these options.Mode & Distance:6
o Foreign In-Mode: Hover your mouse pointer over “Foreign In-Mode” button andselect from options “All Foreign In-Modes Combined” or “Select All/SpecificForeign In-Modes.” All Foreign In-Modes Combined is not mode specific; it provides data fortotal freight volume moved from the selected Foreign Origin to theselected zone of entry (i.e., US Entry Region). Select All/Specific Foreign In-Modes provides a menu for foreign inmodes. By default, all modes are selected; you can select one or multiplemodes if needed.o Domestic Mode: Hover your mouse pointer over “Domestic Mode” button andselect from options “All Domestic Modes Combined” or “Select All/SpecificDomestic Modes.” Please refer to Section 2.1 for more details related to theseoptions.o Distance Band: Please refer to Section 2.1 for details related to this option.Display Output Labels as Descriptive: Please refer to Section 2.1 for details related tothis option.Once all desired selections are completed, click the Run button and the results will be shown onthe screen under “Extracted Data” tab with an option to download a CSV file.To activate the options for Export Flows in the DTT, users need to select “Export Flows” from“Flow Type” pull-down menu. The following additional data selection categories are availablefor Export Flows. Year: The FAF5 synchronized historical base years (1997-2012) are available only whenusers select the data at state level. As future FAF5 products (annual and forecast) aredeveloped and become available, selection of other years will be activated, and resultswill be provided for each year selected.Measure: The options are “tons”, “value”, “tmiles”, or “current value.” Note that theestimate for “tmiles” is not yet available; thus, this option is inactive at the current time.Origin-Destination Geography:o Domestic Origin: Hover your mouse pointer over “Domestic Origin” button andselect from options “All Domestic Origins Combined” or “Select All/SpecificDomestic Origins.” Please refer to Section 2.1 for more details related to theseoptions.o US Exit Region: Hover your mouse pointer over “US Exit Region (DomesticDestination)” button and select from options “All US Exit Regions Combined” or“Select All/Specific US Exit Regions.” Please refer to Section 2.1 for moredetails related to these options.o Foreign Destination: Hover your mouse pointer over “Foreign Destination”button and select from options “All Foreign Destinations Combined” or “SelectAll/Specific Foreign Destinations.” All Foreign Destinations Combined is not destination specific; the optionpresents the total volume of freight leaving the United States as a whole. Select All/Specific Foreign Destinations provides a menu for foreigndestinations. By default, all foreign destinations are selected; you canselect one or multiple foreign destinations if needed.7
Commodity: Hover your mouse pointer over “Commodity” button and select fromoptions “All Commodities Combined” or “Select All/Specific Commodities.” Pleaserefer to Section 2.1 for more details related to these options.Mode & Distance:o Domestic Mode: Hover your mouse pointer over “Domestic Mode” button andselect from options “All Domestic Modes Combined” or “Select All/SpecificDomestic Modes.” Please refer to Section 2.1 for more details related to theseoptions.o Foreign Out-Mode: Hover your mouse pointer over “Foreign Out-Mode” buttonand select from options “All Foreign Out-Modes Combined” or “SelectAll/Specific Foreign Out-Modes.” All Foreign Out-Modes Combined is not mode specific; it provides datafor total freight volume moved from the selected zone of exit (i.e., US ExitRegion) to the selected Foreign Destination. Select All/Specific Foreign Out-Modes provides a menu for foreign outmodes. By default, all modes are selected; you can select one or multiplemodes if needed.o Distance Band: Please refer to Section 2.1 for details related to this option.Display Output Labels as Descriptive: Please refer to Section 2.1 for details related tothis option.Once all desired selections are completed, click the Run button and the results will be shown onthe screen under “Extracted Data” tab with an option to download a CSV file.A NOTE OF CAUTION about determining value and tons for an individual region or stateThe DTT was designed to aid users in selecting customized subsets of the FAF5 database (whichincludes over 1.6 million records) for further analysis or usage in other applications. That is,instead of downloading the rather large database, users can select specific records of interests, orobtain data at higher aggregated levels as needed.Caution should be exercised when using this online tool to generate summary “tabulations,”however. As an example, when using the DTT to generate a combined total flow for domesticshipments originated from Kansas (i.e., Kansas to all states), the results produced from DTTinclude (1) freight that is moving within the region (e.g., Kansas to Kansas), and (2) all freightleaving the region (e.g., Kansas to all other states). Therefore, if you want to identify only thefreight that is moving out of a specific region, you will need to perform two separate processes.First, identify the totals for shipments moving from the desired origin (or to a destination).Second, obtain the within-region total by selecting the region or state of interest as both theorigin and destination, and then subtract those results from the total results obtained in the firststep.3 Data VisualizationThe visualization feature requires extracted data from DTT as input. To activate thevisualization feature, click on “Interactive Tabulation and Chart” button located below theextracted data table. There are different types of tabulations and charts that can be generated in8
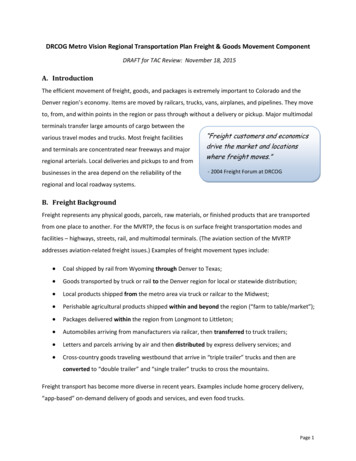
the visualization feature. These include two-way pivot table, table barchart, horizontal andvertical barcharts, area chart, pie chart, Sankey diagram (a flow diagram in which the width ofarrows is proportional to the flow quantity), and O-D flow map. The DTT webpage alsoprovides pre-generated quick charts to demonstrate how the visualization feature can be usedeffectively. These quick charts vary based on the selection of flow types and can be found on thecorresponding DTT webpage under “Quick Chart Generation” tab.3.1Visualization of Total FlowsAn example is provided below to demonstrate how to use the visualization feature and generatevarious charts and tables for Total Flows. We use the following inputs in DTT and showvisualization based on the extracted data.Flow Measure Domestic OriginTypeTotal TonsNew York NY-NJ-CT-PAFlows(NY Part)Atlanta GAChicago IL-IN-WI (ILPart)Phoenix AZCharlotte NC-SC (NCPart)North DakotaDomesticDestinationNashville TNKnoxville TNCommodityAll CombinedDomesticModeTruckRailMultiplemodes & mailOnce data is extracted from DTT (see Section 2.1), click on “Interactive Tabulation and Chart”button. Now you can see a flow map (Figure 4) where origin and destination FAF zone centerpoints are connected through lines. The thickness of lines varies based on the volume of flows(tonnage) going from origin to destination. Also, the size for origin and destination center pointsvary based on the volume of flows corresponding to each respective zone. Origin zone centerpoints are displayed in red and destination zone center points are displayed in blue. Click on“Show Legend” button located at the top-right corner to see the legends. To hide the legend,click on “Hide Legend” button.9
Fig. 4. O-D Flow MapYou can filter your selection further using a pull-down menu next to variable name. Forexample, Figure 5(a) shows a selection of “Knoxville TN” as the destination zone and Figure5(b) shows a selection of Rail and Truck as the domestic modes. Once you are done with yourdesired selection, click on “Apply” button. The flow map will be updated.(a)(b)Fig. 5. Selection of Domestic Destination and Domestic ModeIf you click on any zone that is in your selection of origin and destination zones, the flow mapwill be updated to show only flows coming to or going out of that zone. In particular, if the zoneis in the destination zone list, the flow map will show all flows coming to it; and if the zone is inthe origin zone list, the flow map will show all flows going out of it. Figure 6 shows the updatedmap when you click on “Knoxville TN” zone. Note that this zone is a destination zone in ourexample.10
Fig. 6. O-D Flow Map for Knoxville TN FAF ZoneUsing the pull-down menu at the top left corner, you can generate other tables and charts. Select“Table” from the menu and you can see a two-way pivot table (Figure 7(a)). By default, cellvalue is selected as sum of all records. You can change it to show value in percentages. Threetypes of percentage values can be obtained—percent of total, percent of rows and percent ofcolumns. Figure 7(b) shows the value when “percent of total” is selected. The data can bedownloaded as CSV for further processing as well.(a)(b)Fig. 7. Two-way Table for Domestic Origin and DestinationIt is possible to include more than one variable in the tabulation. You need to drag your desiredvariable and place it in the list of row or column variables. Figure 8 shows the updated tablewhen “dms mode” variable is considered as a column variable in addition to “dms dest”variable.11
Fig. 8. Two-way Table for Domestic Origin, Destination and ModeAnother table option available in the visualization feature is a table with barchart. To generatethis table, select “Table Barchart” from the pull-down menu. Figure 9 shows the output for thisselection.Fig. 9. Table Barchart for Domestic Origin and DestinationThe visualization feature provides the capability to generate both vertical and horizontalbarcharts. For the horizontal barchart, select “Bar Chart (Horizontal)” from the pull-down menu.This will generate a barchart where origin FAF zones are shown on the Y-axis (Figure 10). Thestacked bars for each origin FAF zone show flows associated with destination FAF zones. Youcan add/edit title and axis labels by double-clicking on the associated texts. There are additionaloptions available (at the top right corner) when you hover your mouse pointer on the plot area.These include zoom, pan, saving plot as png, etc.12
Fig. 10. Horizontal BarchartFor the vertical barchart, select “Bar Chart (Vertical)” from the pull-down menu. This willgenerate a barchart where destination FAF zones are shown on X-axis (Figure 11). The stackedbars for each destination FAF zone show flows associated with origin FAF zones.Fig. 11. Vertical Barchart13
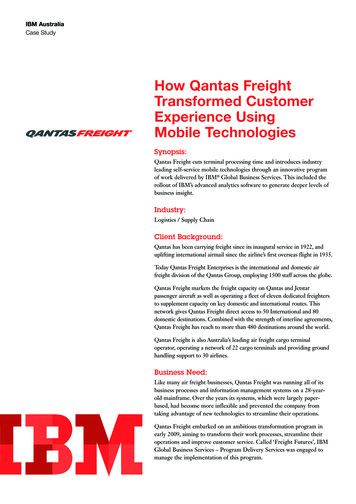
Area chart is a line chart that displays quantitative data using colored areas between the axis andlines. To generate this chart, select “Area Chart” from the pull-down menu. Figure 12 shows thegenerated plot. The destination FAF zones are shown on X-axis. This chart shares the samedisplay options as barcharts.Fig. 12. Area ChartTo generate a pie chart, select “Pie Chart” from the pull-down menu. You can see two pie chartsfor two destination FAF zones (Figure 13). Sections in each pie represent origin FAF zoneshares in terms of flow tonnage.Fig. 13. Pie Chart14
Lastly, to generate a Sankey diagram, select “Sankey” from the pull-down menu. You can see aflow diagram where the width of each flow from origin FAF zone to destination FAF zone isproportional to the tonnage (Figure 14).Fig. 14. Sankey DiagramThe DTT webpage provides six pre-generated charts; available under “Quick Chart Generation”tab. These charts were designed to be used as tutorials or guides on how you can use thevisualization feature effectively. For “Total Flows”, the charts are Total tonnage by commodity and mode,Total tonnage by commodity,Mode share by commodity (tons),State level origin-destination flows (tons),Sankey diagram by mode and distance for two commodities (live animals/fish,meat/seafood),Pie chart by commodity and mode for shipments coming into D.C.Hover your mouse pointer over your desired chart and click on it to generate the chart. Inaddition to the chart, its corresponding pre-extracted data will be displayed on the webpage.Figure 15 shows the chart (partially) when you click on “mode share by commodity (tons).”15
Fig. 15. Mode Share by Commodity3.2Visualization of Domestic FlowsA similar procedure used in the Total Flows can be applied to generate various charts and tablesfor the Domestic Flows. Please refer to Section 3.1 for details. Additionally, when you select“Domestic Flows” from the “Flow Type” pull-down menu, the DTT webpage provides six pregenerated charts. These are Total tonnage by domestic origin,FAF zone level origin-destination table within CA (tons),Total tonnage by commodity with mode share,Pie chart by commodity and mode for coal, gasoline, fuel oils, crude oil, etc. (tons),Sankey diagram by mode and distance for coal, gasoline, fuel oils, crude oil, etc. (tons),State level origin-destination flows for coal, gasoline, fuel oils, crude oil, etc. (tons).Note that the above charts show flows associated with domestic freight. Figure 16 shows thechart for “FAF zone level origin-destination table within CA (tons).”16
Fig. 16. FAF Zone Level Origin-Destination Table within CA3.3Visualization of Foreign Trade FlowsFor imported shipments, we use the following inputs in DTT and show visualization based on theextracted data.FlowMeasure ForeignTypeOriginImport TonsCanadaFlowsSW &CentralAsiaUS EntryRegionNorthDakotaCorpusChristi TXHouston TXRest of WADomesticDestinationRest of LACommodity lCombinedChicago ILIN-WI (ILPart)Houston TXRest of TXSeattle WARest of WAOnce data is extracted from the DTT (see Section 2.3), click on “Interactive Tabulation andChart” button. Now you can see a two-way pivot table where the row variable is fr orig and thecolumn variable is dms orig. Edit the table to include fr orig and dms orig as the row variables,and dms dest as the column variable. Figure 17 shows the updated table.17
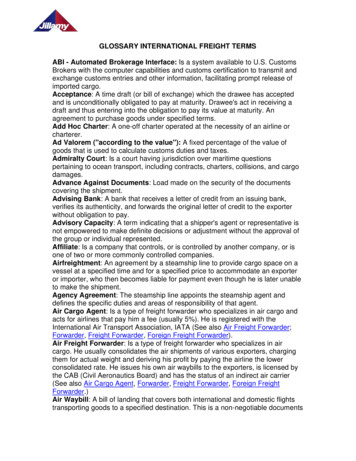
Fig. 17. Two-way Table for Foreign Origin, Domestic Origin and Domestic DestinationYou can follow the procedures presented in Section 3.1 to generate other tables and charts (i.e.,table barchart, horizontal and vertical barcharts, area chart, pie chart, Sankey, and O-D flow)using the extracted data. Figure 18 shows the O-D flow map.Fig. 18. O-D Flow MapThe DTT webpage provides six pre-generated charts for Import Flows. These are Pie chart by foreign origin and foreign mode (value),State level import flows (tons),18
Total tonnage of imports by US entry region,Value of imported shipments by commodity and foreign region,Sankey diagram by foreign region, foreign in-mode, and domestic mode for electronics(value),State level import flows for electronics (value).Figure 19 shows the chart for “pie chart by foreign origin and foreign mode (value).”Fig. 19. Pie Chart by Foreign Origin and Foreign ModeFor exported shipments, we use the following inputs in DTT and show visualization based on theextracted data.FlowTypeMeasure DomesticOriginExport TonsFlowsAlaskaLos AngelesCARest of TXUS ExitRegionForeignDestinationCommodity DomesticModeAlaskaLos AngelesCACorpusChristi TXHouston tModeAllCombinedOnce data is extracted from the DTT (see Section 2.3), click on “Interactive Tabulation andChart” button. Now you can see an O-D flow map where the row variable is dms orig and thecolumn variable is dms dest. Edit the map to include dms orig as the row variable, anddms dest and fr dest as the column variables. Figure 20 shows the updated O-D flow map.19
Fig. 20. O-D Flow MapYou can follow the procedures presented in Section 4.1 to generate other tables and charts (i.e.,table, table barchart, horizontal and vertical barcharts, area chart, pie chart, and Sankey) usingthe extracted data. Figure 21 shows the table barchart.Fig. 21. Table BarchartThe DTT webpage provides six pre-generated charts for Export Flows. These are Pie chart by foreign destination and foreign mode (value),State level export flows (tons),Total tonnage of exports by US exit region,20
Value of exported shipments by commodity and foreign region,Sankey diagram by domestic mode, foreign out-mode, and foreign region for electronics(value),State level export flows for electronics (value).Figure 22 shows the chart (partially) for “total tonnage of exports by US exit region.”Fig. 22. Total Tonnage of Exports by US Exit Region21
Appendix A: Glossary of TermsTotal FlowsContains the data associated with freight moved between domestic origins anddomestic destinations and includes both domestic and foreign shipments. Forimport shipments, the origin of the flow is zone of entry (the FAF region or stateof entry), and for export shipments, the destination of the flow is zone of exit (theFAF region or state of exit). Mode of transportation for Total Flows is the modeused within domestic regions or states.Domestic FlowsContains only shipments associated with domestic freight moved betweendomestic origins and domestic destinations. No foreign trade flows are included,and the mode of transportation is the mode used within and between domesticregions or states.Import FlowsContains data associated with freight moved from foreign origins to domesticdestinations. Geographies for this flow data include Foreign Origin, US EntryRegion (Domestic Origin), and Domestic Destination. Mode of transportationconsists of two parts: (1) foreign mode used between a foreign origin zone and azone of entry in the United States and (2) domestic mode used between the zoneof entry and its domestic destination.Export FlowsContains data associated with freight moved from domestic origins to foreigndestinations. Geographies for this flow data include Domestic Origin, US ExitRegion (Domestic Destination), and Foreign Destination. Mode of transportationconsists of two parts: (1) domestic mode used between the domestic origin of theshipment and its zone of exit and (2) foreign mode used between the zone of exitand foreign destination.US Entry RegionFAF region or state where an import enters the United States, i.e., domestic originof the given shipment. This term refers to the entire region or state and does notlimit the entry to any single location.Foreign In-ModeMode used between a foreign origin region and the US entry region for theimported goods.US Exit RegionFAF region or state where an export leaves the United States, i.e., domesticdestination of the given shipment. This term refers to the entire region or state anddoes not limit the exit to any single location.Foreign Out-ModeMode used between a foreign destination region and the US region of exit for theexported goods.22
5 Commodity: Hover your mouse pointer over "Commodity" button and select from options "All Commodities Combined" or "Select All/Specific Commodities." o All Commodities Combined is not commodity specific and provides total freight moved of all commodities as a whole. o Select All/Specific Commodities provides a pull-down menu for commodity types.