Transcription
Academy of Strategic Management JournalVolume 20, Special Issue 5, 2021ORGANIZATIONAL CULTURE ASSESSMENT OF ASAUDI PUBLIC UNIVERSITY: EVIDENCE FROMPRINCESS NOURAH BINT ABDULRAHMANUNIVERSITYSanjeevni Gangwani, Princess Nourah Bint Abdulrahman UniversityGhadah Alarifi, Princess Nourah Bint Abdulrahman UniversityABSTRACTOrganizational culture is a vital component of any organization as it affects theorganization’s performance, effectiveness, success and sustainability. Evaluation ofOrganization Culture is needed to bring improvement in the individual and group behavior. Theobjective of present study was to find out prevailing organizational culture of Princess NourahBint Abdulrahman University, Riyadh and to suggest the course of actions for improving theorganizational culture. The present study included a survey of 819 employees of PNU randomlydrawn using Organizational Culture Assessment Questionnaire (OCAQ). This instrumentassessed five functions of organizational culture. It included managing change, achieving goals,coordinating teamwork, building a strong culture and customer orientation. Factor analysis wasundertaken (using SPSS 25 version) yielded three factors accounting for 54% of the variance inthe data. These factors were identified as Organization objectives, organization process andorganization policy. The findings of the study are useful in identifying organization factorsinfluencing the organization culture.Recommendations are included at the end of the research.Keywords: Organization Culture, University, Organization, Employees, Workplace Culture,Organizational Culture Assessment Questionnaire (OCAQ).INTRODUCTIONOrganization Culture is an important component which holds the organizationtogether.Organizational culture is the core competency for an organization that influences theeffectiveness or performance of the individuals, the groups and the whole organization.Organization Culture guides the employee behavior, corporate communication, helps inorientation of new employees. The employees cultivate and share the organization goals andvalues to new employees. These shared values guide employees in maintaining inter personalrelations, understanding the work procedures and systems, developing skills for problem solvingand decision making in various activities of the university. Kuh & Whitt (1988), defineduniversity culture as collective mutually shaping patterns of norms, values, practices, beliefs, andassumptions that guide behaviour of individuals and group. Salonda (2008) described universityculture as a distinct type of organizational culture whose values and beliefs and basicassumptions are held by all universities. Further, Fletcher & Jones (1992) explained that aproblematic organizational culture can lead to organization problems such as poor performanceof employees, poor work quality, low levels of employee loyalty and commitment to theorganization, high levels of absenteeism, high employee turnover rate. It can also create jobLeadership & Organization Management11939-6104-20-S5-054
Academy of Strategic Management JournalVolume 20, Special Issue 5, 2021dissatisfaction among employees and job stress. Blunt (1991); George & Jones (1996) andZakaria (1997) argued that all organizations function within a specific culture, and that managersand other practitioners have to understand their cultural settings if their organizations are toperform effectively. According to Peters (1982) success of the organization depends on theradiance or excellence of the culture.Researchers has been studying organizational culture tocreate effective and efficient organizations in today’s competitive environment. Folch & Ion(2009) stated that the analysis of a university’s organizational culture is important in order tobring improvement in behavior of people in organizations. The results from this study will beuseful for educational institutions and university policy makers to increase the efficiency oforganizational processes and systems.Objectives1.2.3.To examine the prevailing organizational culture in Princess Nourah Bint Abdulrahman Universityusing Organizational Culture Assessment Questionnaire (OCAQ).To identify the significant factors that influences the organization culture of the university.To suggest interventions this can improve the organization culture in Princess Nourah BintAbdulrahman University.LITERATURE REVIEWConcept of Organization CultureOrganizational culture can be described as a set of beliefs, behaviors, artifacts, symbols,practices and values. Smircich (1983) explained Culture as an environment in which behaviours,institutions and social engagements take place. Smircich (1983) stated that organisations can beunderstood as a collection of cultures (Young, 1989; Van Maanen & Barley, 1985; Kunda, 1995;Ogbonna & Harris, 2015); this view favors the assumption that culture is something anorganisation “is” and not what organization has. Gjuraj (2013) considered culture to be atangible or intangible environment in which a group of people live and work together.Types of Organization CulturePareek (1983) introduced the OCTAPACE model. He explained this model can be usedto identify the extent to which values can be promoted in the organization. These values includeopenness, confrontation, trust, authenticity, pro-activity, autonomy, collaboration andexperimentation. Cameron (1985) suggested that there is no one best type of culture ratherdifferent culture types are related to higher levels of performance on different effectivenessdimensions. Nystrom & Starbuck (1984) conducted a survey of 375 university lecturers fromeight public universities in Saudi Arabia found that employees in strong cultures tended toexpress greater organizational commitment as well as higher job satisfaction. McNay (1995)developed a model to describe organizational culture of higher education institutions. His modelhighlighted dimensions: intensity of control and the focus on policy and strategy. Deal &Kennedy (2008) explained that a strong culture is a system of rules that spells out how peopleshould behave. An organization with a strong culture has common values and codes of conductfor its employees, which helps them to accomplish their missions and goals. Kezar & Eckel(2002) explained the myths and rituals of university stakeholders. They believed that universityculture is different from other types of institutions. Bartell (2003) explained the need of strongculture as it improves the quality of decision making and problem solving. A strong cultureLeadership & Organization Management21939-6104-20-S5-054
Academy of Strategic Management JournalVolume 20, Special Issue 5, 2021permits debate and discussion, alternative views and strategies. Prajogo & McDermott (2011)found that the type of culture impacts the organization performance. Studies by Kotter & Heskett(1992); Sørensen (2002) cited in Prajogo & McDermott (2011) focused on two major dimensionsof culture: content and strength of culture.They concluded that both are important factors forachieving a high level of performance. Content signifies the types of values and behaviors heldby employees, and strength means depth of those behaviors embedded among the employees.Significance of Assessment of Organization Culture to IndividualsCulture influences individual’s attitudes such as commitment, motivation, morale, andsatisfaction. Waterman & Peters (1982) claim that OC has a powerful impact on individualbehaviour as well as performance and effectiveness. Wallach (1983) suggested thatorganization’s culture affects the individual job performance, job satisfaction, propensity toremain with the organization, and job involvement. Harris & Mossholder (1996) stated thatorganizational culture acts as a foundation that influences other factors of human resourcemanagement. Yusof & Juhary (2000) confirmed that organizational culture influences thethought, feeling, communication and performance in the organization. Studies of McKinnon etal. (2003) concluded that organizational culture has been an important theme in management andbusiness research for the past few decades due to its potential impact on commitment, loyalty,and intent to turnover and job satisfaction. Lok & Crawford (2003) organizational culture caninfluence how people in an organization set personal and professional goals, perform tasks andadminister resources to achieve them. Jones et al. (2005) demonstrated that organizationalculture enables employees to create, acquire, share and manage knowledge. Engman &Thörnlund (2008) the culture of an organization, influences the daily activities at work andmotivates the company's work.Significance of Assessment of Organization Culture to OrganizationsWaterman & Peters (1982) and Kotter & Heskett (1992) reported a significant linkbetween a particular type of strong culture and superior financial performance. Cameron &Quinn (2011) investigated the relationship among three dimensions of organizational culture;congruence, strength and organizational effectiveness. Research by Ritchie & Sabourin (2001)shows that organizational culture influences productivity, effectiveness, performance,commitment, self confidence, ethical behavior and job satisfaction. Kezar & Eckel (2002) statedthat the organization culture is associated with effectiveness. Lund (2003) concluded that strongorganizational culture increases job satisfaction, efficiency, organization performance. Gray et al.(2003) stated that organizational culture is used as a powerful tool to quantify the way a businessfunctions. Aidla & Vadi (2007) stated that Organizational culture as an important factor thatinfluences the performance of an organization. Fralinger & Olson (2007) stated that the mostsuccessful campus cultures support both group cooperation and individual achievement.Karatepe & Kilic (2007) organizational culture has the ability to rearrange everyday functioningof the organization in order to adapt to changing conditions. Berson et al. (2008) explained theassociation between work culture and growth in sales and overall profits. According to Deal &Kennedy's (1988) approach, strong culture can have a major impact on the success of thebusiness Karatepe & Kilic (2007) describes eight effects organizational culture has onperformance: i) Communication effect, ii) Decision making effect, iii) Trust effect, iv) Stresseffect, v) Conflict effect, vi) Alienation effect, vii) Motivation effect, viii) Organizational changeeffect. Kutanis et al. (2012) conducted a study on full time employees of a five star hotelLeadership & Organization Management31939-6104-20-S5-054
Academy of Strategic Management JournalVolume 20, Special Issue 5, 2021chain.They found that organizational culture affects the organizational performance, customers,employees and environment.How to Measure Organization CultureAccording to Schein (1984), the strength of culture can be defined in terms of thestability of group membership and the intensity of shared experience of the group. Anorganization with stable group members will represent a strong culture however an organizationwith unstable group members will display a week culture. Cameron & Ettington (1988) statedthat a strong culture is more effective and is associated with organizational excellence. Gordon &DiTomaso (1992) found that a strong culture was predictive of short-term company performance.In a study carried out for developing a model for the relationship between organizational cultureand organizational performance, Marcoulides & Heck (1993) and Uzun (2007) concluded thatorganizational culture variables are determinants in organizational performance. Sporn (1999 &2001) identified two types of university organizational cultures: strong and weak. Ribière & Sitar(2003) stated that Organizational culture is a feature of an organization, that provides direction toemployees regarding their daily working relationships and guides them on how to behave andcommunicate within the organization. Antić & Cerić (2008) focused on different ways to assessthe university culture. According to Antić & Cerić (2008) Strong university culture ischaracterized by shared values, strong norms of behavior and willingness of faculty to obey thesenorms. In contrast, weak culture is characterized by disagreement about main values, absence ofnorms and violation of written and unwritten norms of university. de Hilal et al. (2009)concluded that culture is a key variable that affects performance. Work culture helps todetermine how employees are organized and howthey operate within the structure. From thereview it can be concluded that organization culture affects individual behavior and overallperformance, hence this research can be useful for university administrators and policy makers tomodify the individual and group behavior and make organization effective.METHODOLOGYThe main purpose of this descriptive research was to find out prevailing organizationalculture of Princess Nourah Bint Abdulrahman University, Riyadh and to suggest the course ofactions for improving the organizational culture. This study implemented a survey to find outprevailing culture of PNU University by using the Organizational Culture AssessmentQuestionnaire OCAQ, based on the work of Dr. Talcott Parsons, a sociologist at Harvard. Thisinstrument assessed five organization functions managing change, achieving goals, coordinatingteamwork, building a strong culture and customer orientation. Thirty questions includingdemographic variables were used. The Questionnaire Included five different scales: Scale I of theOCAQ included total six items. The objective of this scale was to examine the degree to whichrespondents see the organization as effective in adapting to and managing change.Scale II of theOCAQ included total six items. The objective of this scale was to identify the degree to whichthe organization is effective in achieving goals. OCAQ Scale III included total six items. Theobjective of this scale was to assesses the extent to which an organization is effective incoordinating the work of individuals and groups.Scale IV of the OCAQ included total sixitems.The objective of this scale was to assesses the extent to which organizational activities aredirected towards identifying and meeting the needs and goals of clients and customers.Scale V ofthe OCAQ included total five items. The objective of this scale was to assess the strength of theLeadership & Organization Management41939-6104-20-S5-054
Academy of Strategic Management JournalVolume 20, Special Issue 5, 2021organization's culture, asking respondents to report on the extent to which people agree onvalues. Reliability tests were conducted to test the reliability of each scale. Cronbach’scoefficient alpha was used to calculate the internal consistency of the 30 factors of five scales.The alpha values are presented in Table 8.Reliability coefficient (Cronbach’s alpha) greaterthan.7 is normally acceptable. The study was applied to 819 employees to determine theorganizational culture of the PNU University. The data was collected during 2020 educationalsemester. Randomly selected 819 members participated in the study. The study targetedemployees of PNU in different work levels (high, middle, and low) and across severaldepartments. It also targeted different employees who seemed to have different individualcharacteristics (e.g. age, gender, and work experience.).Descriptive statistics of gender, age,marital status, Qualification, Job field, experience, Managerial level/academic rank/were run toexamine representativeness of the sample of this study.Examination of Suitability of Data andCriteria for factoranalysis was checked with the following study. Thompson (2004) advised that,for factor analysis, the ratio between the number of participants (N) and the number of measuredvariables (p) should be at least 3:1 (N:p). In this study, having the sample size of 819(N 819)and number of measured variables (p) was 30. The ratio approximately 27:3, such requirementswere deemed met. Factor analysis and correlational analysis, were employed in this research.According to Tabachnick & Fidell (2013), correlation coefficients would be more reliablyestimated when having a sample size of at least 300. The analysis was conducted in thefollowing order: First, factor analysis was done to decide clean data and best-related items foranalyses. This analysis aimed to delete unrelated items in the questionnaire. Then, such factorswere used in the correlational analysis. Second, the correlational analysis was conducted topreliminarily examine the relationship between the variables. Rotation is used in factor analysisto accommodate the correlations between extracted factors. Regarding the method of rotation,the Varimax with Kaiser Normalization was used because this method produces factors whichcontain items that are well correlated to each other. This method has been specially used as acommon method in social sciences which involves examination of human behaviours, as in thepresent study, Rotation converged in 7 iterations. According to Tabachnick & Fidell (2013), thenumber of rotation times will maximise the opportunities of loading well-connected variablestogether. Regarding the criteria for removing a variable, any variable which has a small factorloading of below 0.4 was removed. Also, any variable that had cross loadings with othervariables was carefullyexamined to decide case by case to determine if it needs removing. Theabove decisions have been made thoroughly for all principal axis factoring analyses in thisstudy.Factor analysis was undertaken (using SPSS 25 version) to extract factors of OrganizationCulture. Bartlett’s test of spherecity and Kaiser-Meyer-Olkin (KMO) was computed. Themeasure of sampling adequacy (KMO 0.967) was appropriate, implying that the principalcomponent factor is a reliable tool in a given situation.HypothesisH0There is no correlation between five dimensions of Organization Culture.H1There exists a significant correlation between five dimensions of Organization Culture.Leadership & Organization Management51939-6104-20-S5-054
Academy of Strategic Management JournalVolume 20, Special Issue 5, 2021RESULTS AND DISCUSSIONDemographic and Psychographic CharacteristicsInterpretation: Among the total 819 respondents, 97 percent were female and 3 percentwere male (Table 1).GenderFemaleMaleTotalFrequency79722819Table 1GENDERPercent Valid Percent9797.32.72.7100.0100.0Cumulative Percent97.3100.0Source: Primary Data Analysis using SPSS 25.0Frequency23345TotalPercent45379131876819Table 2AGEValid Percent5.546.30.138.89.3100.0Cumulative Percent5.551.95.690.7100.0100.0Source: Primary Data Analysis using SPSS 25.0Interpretation: 6 percent were in 20-30 year age group, 46 percent in 30-40 year agegroup, 39 percent in 40-50 year age group, and 9 percent in 50-60 age groups (Table 2).Marital StatusMarriedWidowSingleDivorcedTotalTable 3MARITAL STATUSFrequency Percent Valid 0.0100.0Cumulative Percent76.978.693.3100.0Source: Primary Data Analysis using SPSS 25.0Interpretation: In addition, 77 percent were married, 2 percent were widow, 14 percentwere single and 7 percent were divorced (Table 3). Interpretation: The respondents were fromvaried educational background such that 6 percent were Secondary School passes out, 40 percentwere Diploma Holders, 16 percent were BA and 38 percent hold masters degree (Table 3).QualificationSecondary SchoolDiplomaBAMasterTotalTable 4QUALIFICATIONFrequency Percent Valid 9100.0100.0Cumulative Percent5.645.861.4100.0Source: Primary Data Analysis using SPSS 25.0Leadership & Organization Management61939-6104-20-S5-054
Academy of Strategic Management JournalDesignationValidAcademic staffAdministrativeHealth staffOtherTechnical staffTotalVolume 20, Special Issue 5, 2021Table 5JOB FIELDFrequency Percent Valid 162.02.0819100.0100.0Cumulative Percent0.147.596.597.498.0100.0Source: Primary Data Analysis using SPSS 25.0Table 6EXPERIENCEYears of experienceFrequency PercentValid10.120 Years and Over16420.0Less than one year131.6More than 10 years but less than 15 years13917.0More than 15 years but less than 20 years14717.9More than 3 years but less than 5 years445.4More than 5 years, but less than 10 years27533.6More than a year, but less than 3 years364.4Total819100.0Source: Primary Data Analysis using SPSS 25.0Table 7MANAGERIAL LEVELManagerial LevelFrequency PercentAdministration manager12315.0Administrative20.2College of Community services10.1Consultant10.1Dean81.0Dean Assistant10.1Deputy Assistant10.1Deputy Director10.1Director of the Graduate Program, Department of10.1BiologyEmployee30437.1Employee ةوحده 11Head of department364.4Head of the Communication Committee10.1Manager10.1Office manager40.5Professor كرسي 11Research Assistant10.1secretary30.4secretary قسم 11Valid Percent0.120.01.617.017.95.433.64.4100.0Cumulative Percent0.120.121.738.756.762.095.6100.0Valid Percent15.00.20.10.11.00.10.10.1Cumulative 9.660.060.1Staff Member29235.735.795.7Technical job ةمختبر Vice Dean in college or Deanship طالبة مسؤولةشؤونال Employee ات 899.899.9100.0Source: Primary Data Analysis using SPSS 25.0Leadership & Organization Management71939-6104-20-S5-054
Academy of Strategic Management JournalVolume 20, Special Issue 5, 2021Interpretation In addition respondents were from various Job fields including, 47 percentwas Academic Staff, 49 percent was Administrative staff, 1 percent was from health staffwhereas 2 percent was technical Staff and others were less than 1 percent (Table 4). Tables 5-8illustrates the frequency of variables Job Field, Current Job, Years of Experience, ManagerialLevel and respondent’s affiliated college respectively.Table 8RELIABILITY TESTCronbach's Alpha No of items0.76730SexAgeMarital StatusQualificationValid N (listwise)Table 9DESCRIPTIVE STATISTICSNMinimum Maximum Mean819121.03818253.52819141.51819142.87818Std. Deviation0.1620.7390.9730.998Source: Primary Data Analysis using SPSS 25.0Interpretation: Table 9 illustrates the descriptive Statistics of the primary data. Themeans, SDs, number of items pertaining to the dimensions of Gender, Age, Marital Status andQualification are presented in Table 9.Table 10KMO AND BARTLETT'S TESTKMO and Bartlett's TestKaiser-Meyer-Olkin Measure of Sampling AdequacyApprox. Chi-SquareBartlett's Test of : Bartlett’s test of sphericity tests the hypothesis that correlation matrix is anidentity matrix, which would indicate that variables are unrelated and therefore unsuitable forstructure detection. Small values (less than 0.05) of the significance level indicate that a factoranalysis may be useful for current data. In the present analysis as the significance level is foundto be 0.00 clearly indicates that factor analysis is useful for analysis. If the Kaiser-Meyer-OlkinMeasure of Sampling Adequacy has High values (close to 1.0) generally indicate that a factoranalysis may be useful with the following data. If the value is less than 0.50, the results of thefactor analysis probably won't be very useful. In the present research as the KMO measure is0.965, this can be interpretated that factor analysis would prove to be useful in this case. So, nowFactor Analysis could be applied to the data (Table 10).Interpretation: In the total variance explained table it can be seen that on applying Factoranalysis 30 variables which were included in the questionnaire were reduced to only 3 factors(Table 11). The first factor depicts maximum variance of around 42%, followed by around 8%variance by second factor, followed by 4% variance depicted by third factor. This clearly showsthat these 3 factors show around 54% cumulative variance and the rest 27 factors fall in thecategory of the remaining 47%.Leadership & Organization Management81939-6104-20-S5-054
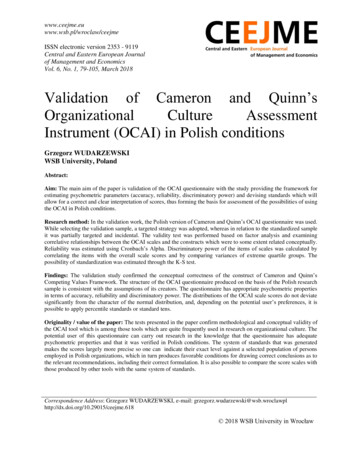
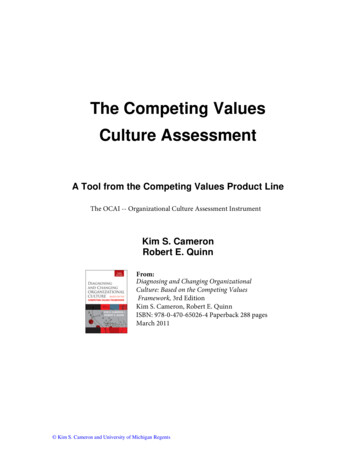
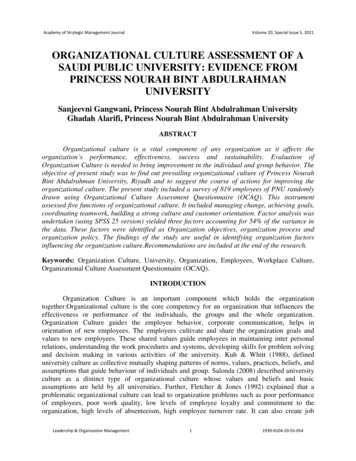
Academy of Strategic Management JournalVolume 20, Special Issue 5, 2021Extraction Method-Principle Component AnalysisInterpretation: From 30 variables, 3 factors were extracted with principle componentanalysis whose Eigen values are found to be greater than one. Eigen values represent variancesof the factors. A flat line after 4th variable indicates that there is a very small variation in the data(Figure 1).Table 11TOTAL VARIANCE EXPLAINEDInitial EigenvaluesComponentExtraction Sums of SquaredLoadingsRotation Sums of SquaredLoadings1% ofCumulative% ofTotalVariance%Variance12.668 42.22742.22712.668 0.2500.83399.179300.2460.821100.000TotalLeadership & Organization Management9Cumulative% ofCumulativeTotal%Variance%42.22711.982 39.94039.9401939-6104-20-S5-054
Academy of Strategic Management JournalVolume 20, Special Issue 5, 2021FIGURE 1SCREE PLOTTable 12ROTATED COMPONENT MATRIXaPeople are flexible and adaptable when changes are necessaryPeople feel that most change is the result of pressures imposed from higher up in thePeople have a clear idea of why and how to proceed throughout the process of changeMost people believe that change happens too quickly and causes too much disruptionPeople believe they can influence or affect their work place through their ideas andinvolvementPeople believe that their concerns and anxieties during periods of change are heard andtaken into considerationsIndividuals and teams have clearly defined goals that relate to the goals or mission of theorganizationPeople and teams are often expected to reach goals which they believe are unattainableIndividuals and teams are measured and rewarded according to how well goals areachievedIndividuals and teams participate in defining specific goals.We constantly stretch our goals, to continuously improveIndividuals, teams, and functional areas often have incompatible goals.*Teams often lack the authority needed to get the job effectively.*People believe in teamwork, the “what’s in it for us” approach rather than “what’s in itfor mePeople lack the interpersonal and technical skills they need to work effectively in teamsPeople know what is expected of them and understand their impact on other people,teams, and functionsPeople believe in working together collaboratively, preferring cooperation overcompletionManagers at all levels work together as a team to achieve results for the organization.Leadership & Organization .1640.17531939-6104-20-S5-054
Academy of Strategic Management JournalVolume 20, Special Issue 5, 2021We give the highest priority and support to meeting the needs of clients and customersand solving their problemsOur policies and procedures help us to provide the service our customers and clientswant and needsPeople often see customer and client problems as someone else’s responsibilityPeople are always looking for new ways to better serve clients and customersEmployees who do the best job of serving customers are more likely than otheremployees to be recognized or rewardedWhen customers have problems with the products or services they receive, thoseproblems are almost always resolved to their satisfactionPeople value and make use of one another’s unique strengths and different abilitiesEveryone knows and understands our objectives and prioritiesPeople sometimes compromise company policy and procedures to reach operationalgoalsBusiness decisions are most often made on the basis of facts, not just perceptions orassumptionsIndividuals obtain information about the course of work and its causes within theorganization in an accurate and timely mannerEvery individual in the organization strongly believes in the existence of a set of sharedvalues about individuals' cooperation together to solve traditional business problems andachieve common 712-0.0760.1830.6690.0870.3580.786-0.2060.03Table 13EXTRACTED s under FactorEvery individual in the organization strongly believes in the existence of a setof shared values about individuals' cooperation together to solve traditionalbusiness problems and achieve common goalsManagers at all levels work together as a team to achieve results for theorganization.Our policies and procedures help us to provide the service our customers andclients want and needsPeople believe in teamwork, the “what’s in it for us” approach rather than“what’s in it for mePeople value and make use of one another’s unique strengths and differentabilitiesIndividuals and teams have clearly defined goals that relate to the goals ormission of the organizationPeople know what is expected of them and understand their impact on otherpeople, teams, and functionsIndividuals and teams participate in defining
organizational culture increases job satisfaction, efficiency, organization performance. Gray et al. (2003) stated that organizational culture is used as a powerful tool to quantify the way a business functions. Aidla & Vadi (2007) stated that Organizational culture as an important factor that influences the performance of an organization.