Transcription
VOLUME 3TOTAL CONSUMER REPORTCopyright 2017 The Nielsen Company (US), LLC. All Rights Reserved.
WELCOMEWhile we’ve escaped the worst of the slowdown from early 2017, thatdoesn’t mean we can lose momentum in the pursuit of growth in today’sflat market conditions.CHRIS MORLEYPresident, FMCG and RetailNielsenThe U.S. fast-moving consumer goods (FMCG) industry is no lesscompetitive, nor is it likely that future growth will be arrived at with ease.That said, the search for white space opportunity and the fight for shareof consumers’ wallets is still within reach. It’s just a matter of carefulguidance in selecting the moves to prime optimal success. That’s what weand our Connected Partners hope to support as you head into the newyear and beyond.You see, growth is achievable, it’s just harder to find than it may have beenin past. Traditional categorical barriers across the industry are fading. Withthe rise of healthful ingredients strategically placed in consumables, or theuse of superfoods in natural ailment remedies, so collides the worlds ofhealth and packaged foods.The expanded competitive sets across center of store and fresh foods areanother example. From agave nectar to kefir, or the expanse of alternativegrains like cauliflower rice it begs the question: What defines somethingas produce or a source of grain product for consumers? Which foods nowact as medicines? Considering the health and wellness implications, are weall in the health business? The comparisons are seemingly endless and theboundary lines fewer and far between.I hope you’ll continue to join us on our journey to total consumermeasurement. We’re excited to share our latest perspectives on navigatingthe fluid landscape of today to help guide your next steps forward.Copyright 2017 The Nielsen Company (US), LLC. All Rights Reserved.2
CONTENTSOVERVIEW. 4TOTAL STORE. 5RETAIL. 13HEALTH & WELLNESS. 18E-COMMERCE. 22MULTICULTURAL. 29Copyright 2017 The Nielsen Company (US), LLC. All Rights Reserved.3
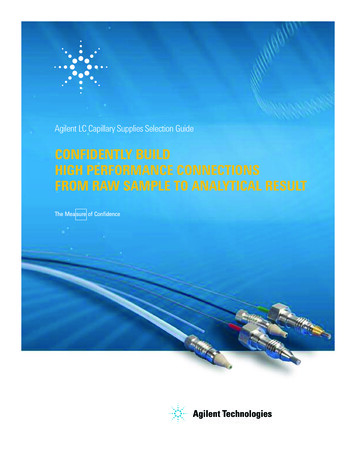
OVERVIEWOVERVIEWThe third quarter of 2017 saw yet another uptick in optimism. Well abovethe global average of 105, U.S. consumer confidence climbed an additionalthree points from last quarter, reaching new heights with an index scoreof 121. The overall confidence score is backed by a number of factors,including optimism about the job market. For instance, the majority (64%)of Americans are feeling positively about their job prospects over thenext year, up 14% from the third quarter of 2016. Additionally, 72% ofAmericans feel good about the state of their personal finances for the next12 months.The top two issues of concern across the nation remain the same: Thestate of the economy (28% of respondents, down three points from thethird quarter of 2016) and the threat of terrorism (21% of respondents,unchanged) claim the top spots. However, the scores for health and thethreat of war have risen by three and 10 percentage points, respectively,becoming top-of-mind among the fastest rising concerns, versus lastyear’s sentiment figures (Q3 2016).NIELSEN CONSUMER CONFIDENCE INDEX12111911846Putting into savingsHolidays/vacations442436North AmericaUnited States117Q2 2017TOP AREAS FOR SPENDING SPARE MONEYQ3 2017Paying off debts/credit cards/loans353328New clothes24Home improvements/decorating2423Q3 2016Q3 2017Source: Nielsen Consumer Confidence Survey, Q3 2017Americans are feeling positive as we head into the final stretch of theyear, so it’s perhaps not surprising that many have taken that confidencedirectly to stores to start their holiday shopping early. This year, 26%of surveyed U.S. consumers began their holiday shopping as early asSeptember—more early shoppers than we’ve seen over the past fiveyears.1 As we begin to reflect—and in many cases celebrate—another yearpassed, the intent to spend on vacations and holiday excursions has alsoincreased. After covering one’s living expenses, 36% of Americans wouldspend their spare cash on a getaway, up 12% from a year ago.1Nielsen Homescan online survey of 25,241 respondents, surveyed in Sept. 2017Copyright 2017 The Nielsen Company (US), LLC. All Rights Reserved.4
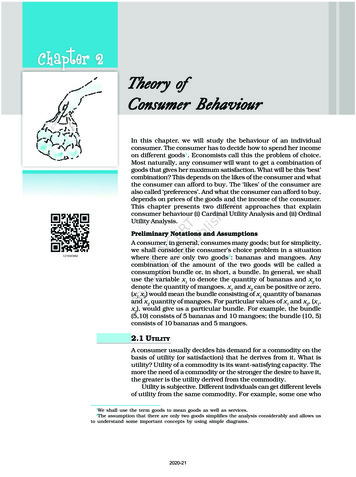
TOTAL STORETOTAL STOREPHYSICALDIGITALOMNICHANNELREQUIRES:Seamless retail capabilitiesCost-effective infrastructureIt’s imperative that we challenge ourselves to re-imagine the notionswe hold about the “store.” While sales growth in the third quarter wasmoderate at 0.2%, that uptick represents just over 500 million indollar sales. This is proof that we’ve weathered many of the storms fromearly 2017, but it’s also a warning sign that the in-store environment iscompetitive, and the tactics that have allowed the market to return to abreakeven state won’t be sufficient to generate sustainable growth.Copyright 2017 The Nielsen Company (US), LLC. All Rights Reserved.5
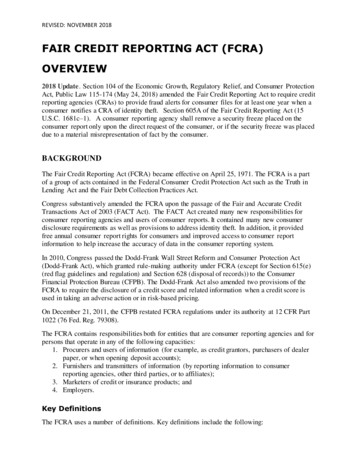
TOTAL STOREQUARTERLY TREND - BRICK & MORTAR 228.0B 0.2% VS. Q272.1B 1.1% VS. Q2DollarsQ1 2017UnitsQ2 2017Q3 2017Source: Nielsen Retail Measurement Services, Core syndicated hierarchy, and Nielsen FreshFacts,Total U.S., 13 weeks ended Sept. 30 2017 vs. previous period, UPC-coded Random-weight (*)See EndnotesIn today’s fragmented environment, the brick-and-mortar experienceis a blend of physical items, tangible attributes and decisions that areinfluenced, learned and brought to life through digital technologies. Thestore experience needs to be amenable to new consumer preferencesand habits of shopping and discovery in order to convert shopperopportunities. On Cyber Monday, a pivotal online shopping opportunity,60% of surveyed respondents said they planned to use their phone toshop, up 21% from 2015, while shopping via computers dropped 3%.2 Thedigital shelf is now in consumers’ pockets, giving shoppers a chance to buywherever, whenever. But this digital interaction can also drive engagementback to one’s local store. More on that a little later.2Nielsen online survey of 1,179 respondents, surveyed in Oct. 2017Copyright 2017 The Nielsen Company (US), LLC. All Rights Reserved.6
TOTAL STORE% WHO PLAN TO USE DEVICE FORCYBER MONDAY SHOPPING201581%% WHO WILL USE SOURCE TO GETCYBER MONDAY SALES hone33%Cyber Mondaydeal sitesRetailerwebsitesSource: Nielsen online survey of 1,179 respondents, surveyed in Oct. 2017Consumers desire and demand local, personal, convenience and easein their shopping so retailers should consider remodeling their storeformats—both online and offline—to meet those needs. This year, just33% of consumers who were seeking Cyber Monday sales informationused a retailer’s website. Conversely, 70% planned to use “Cyber Monday”deal sites for their shopping intel.3 This leaves retailers and relatedmanufacturers with much room to grow in enticing consumer traffic instore via online real estate. Be mindful to who is entering your storesand what they’ve now become accustomed to seeing and thinking acrossplatforms as they browse and ultimately purchase.3Nielsen online survey of 1,179 respondents, surveyed in Oct. 2017Copyright 2017 The Nielsen Company (US), LLC. All Rights Reserved.7
TOTAL STOREFMCG DEPARTMENT PERFORMANCE - BRICK & MORTAR Vol (Billions) % GrowthUnit Vol (Billions)Unit % iry68.1-3.226.1-3.0Frozen .2Household care58.20.113.5-1.7Health care44.02.46.60.5Personal care42.9-0.68.6-1.1Beauty care16.3-2.03.1-3.5138.80.325.9-1.0Tobacco alternatives73.71.713.20.1General merchandise44.6-2.27.1-2.4Pet care20.51.05.6-1.8CENTER STORE EDIBLESFRESH PERISHABLES*HOME & PERSONAL CARE (HPC)NON GROCERYSource: Nielsen Retail Measurement Services, Core syndicated hierarchy, and Nielsen FreshFacts, Total U.S., 52 weeks ended Sept. 30, 2017 vs. year-ago, UPC-coded Random-weight (*) See EndnotesSales across much of the store remain flat, but sales across the fresh andperishable foods are experiencing positive performance. In the latestyear, fresh departments have grown by nearly 1.5 billion, an influxrepresenting 1% in overall sales. Fresh offerings remain heavily associatedwith the immediate and tangible when it comes to store experience.Online sales of fresh offerings have yet to breakthrough, as just 12% ofshoppers report having purchased these products online.4 Being driversof growth and triggers to in-store traffic, fresh food performance andpotential influence on other in-store purchases should be on the radar ofall retailers trying to capitalize on white space opportunities.4Nielsen, Digital Shopping Fundamentals, 2017Copyright 2017 The Nielsen Company (US), LLC. All Rights Reserved.8
TOTAL STOREFRESH GAINS IN THE LATEST QUARTERUnderstanding the drivers of growth in the perimeterFRESH PERISHABLES 2.0%Year-Ago 2.0% 0.5% 0.6% 1.1% 2.4% 2.6%BakeryDeliSeafoodProduceMeatCurrentSource: Nielsen FreshFacts, Total U.S., 13 weeks ended Sept. 30, 2017 vs. year-ago, UPC-coded Random-weight (*) See EndnotesWhile performance across the fresh area was strong in the third quarter of2017, the meat department posted the most growth. Escaping consecutivequarters of deflationary price pressures, this quarter marks a break intrend, as average department prices for meat grew 3% compared tothird-quarter 2016.5 Produce was the next highest growth driver in thefresh foods space, seeing a 295 million boost in quarterly sales, whichrepresents 2.4% in growth. As healthful intentions among consumersshow no sign of slowing, the emergence of innovative produce offeringsare driving category performance. From the arrival of snack-sizedminiature produce for on-the-go consumers, to the transformation ofproduce into alternative grains or noodles, produce is transcendingtraditional store borders in its uses.5Nielsen FreshFacts, Total U.S., 13 weeks ended Sept. 30, 2017, UPC-coded Random-weight (*) See EndnotesCopyright 2017 The Nielsen Company (US), LLC. All Rights Reserved.9
TOTAL STOREGROWTH TRENDS IN FRESH & PERISHABLE FOODSReady prepared meal items drive growth in the fresh perimeterWHAT’S HOTCategoryWHAT’S NOT % GrowthVol. % GrowthSushi15.315.4Avocados13.8Cherries % GrowthVol. % GrowthPizza-7.5-4.7-7.5Pre-sliced deli meat-7.2-13.712.223.6Crustaceans-7.2-15.4Meat - packaged meals8.17.1Melons-5.5-7.9Value-added 20.2Packaged salad5.86.7Tomatoes-2.70.0Specialty fruits5.50.6Stone Fruit-2.4-10.5Bacon5.21.1Breads-2.2-2.9Herbs, spices and seasonings4.93.9Grapes-2.21.2(ex: guava, persimmon, star fruit)CategorySource: Nielsen FreshFacts, Total U.S., 52 weeks ended Sept. 30, 2017 vs. year-ago, Annual Sales 500 million, UPC-coded Random-weight (*) See EndnotesIn analyzing both the fastest-growing and sharpest-declining categoriesacross fresh foods, we see some interesting juxtapositions emerge.From the perspective of meats, we see contrast in items that are closerand further from the point of consumption. For example, sales of meatsthat are easily consumed as part of packaged meals are on the rise, as isbacon, another fairly quick meat option to prepare. Pork and crustaceans,on the other hand, which have struggled in the latest year, requiremore time to cook and consume. We see another point of contrast inthe perceived healthful benefits of the various prepared food options.Notably, those that consumers perceive as the most fresh and offerthe most health benefits have seen growth: sushi and packaged saladare good examples. Comparatively, pizza and pre-sliced deli meat, theconvenient but less-healthful of prepared foods, have struggled.Copyright 2017 The Nielsen Company (US), LLC. All Rights Reserved.10
TOTAL STORETRENDS SPREAD ACROSS THE STORECapitalizing on CauliflowerOver the last few quarters, UPC-coded fresh foods have consistentlyoutperformed random-weight and other non-UPC perishables.6 Thisgrowth of UPC-coded perishable foods—many of which are brandedsimilarly to what we might expect to see in packaged goods—is blurringthe lines we’ve conventionally drawn between areas of the store. And evenfurther, it may change the way we view performance of certain categories,as well as the opportunities for growth across the store.Take cauliflower for instance. At a total category level, dollars havecontracted. But when we look closer, we see that the non-UPCperformance is affecting top line sales. While performance is challengedin fresh/random weight cauliflower sales, there is opportunity aboundin recognizing key growth areas where packaged varieties can drivesustainable impacts. Produce used as alternatives for grains is a perfectexample. Sales of vegetable-based rices, noodles, crumbles and thelike posted sales of 47 million this year. Sales of cauliflower variantsin particular, such as cauliflower rice, have doubled over the past year,reaching over 17 million. Squash, zucchini and sweet potatoes are alsodriving growth as alternatives to carbs.7CAULIFLOWERDollar % GrowthVolume % Growth-1.2 1.5Non-UPC-7.2-6.4UPC 2.5 7.2Source: Nielsen FreshFacts, Total U.S., 52 weeks ended Sept. 30, 2017 vs. year-ago, UPC-coded Random-weight (*) See Endnotes6Nielsen, Total Consumer Report, Volume 27Nielsen FreshFacts, Total U.S., 52 weeks ended Sept. 30, 2017, UPC-coded Random-weight (*) See EndnotesCopyright 2017 The Nielsen Company (US), LLC. All Rights Reserved.11
TOTAL STOREDESPITE SOME DECLINES,IT ISN’T ALL MELAN-“CAULI”Cauliflower shines as an ingredient in select categoriesCATEGORIES WITH CAULIFLOWER INGREDIENTS: DOLLAR GROWTH VS YAGOREFRIGERATEDSIDE DISHES36 DIFFERENT CONSUMER CATEGORIESHAVE CAULIFLOWER ACROSS THE STORE 108% GETABLESNon food 5.5%BakeryHBCSHELF STABLEVEGETABLEDeliSeafoodAlcoholic beverageBABY FOODMeat-10%FROZEN ENTREES 0.6%RxDairySource: Nielsen Product Insider, powered by Label Insight, 52 weeks ended March 25, 2017CREAM CHEESE 3.5%With the promise and demand for cauliflower as a rice alternative, it begsthe question as to what other opportunities exist for cauliflower as aningredient. While the possibilities may seem endless, it’s important to beaware of the areas of the store that are seeing the most impact in thisspace, notably, refrigerated side dishes and baby food. The upside fromcapitalizing on new market offerings can be huge. In today’s flat market,investing in planned and research-driven innovation can drive pivotalreturns.Copyright 2017 The Nielsen Company (US), LLC. All Rights Reserved.12
RETAILRETAILWhile there’s still a fierce battle amongst retailers trying to win trips, thetraditional shopping trip is a thing of the past. In order to win—both todayand in the long term—retailers need to engage shoppers along today’spath to purchase—one that is no longer linear or straightforward. Today,consumers are constantly connected. Collaboration is a prolific theme thatintertwines channels and technologies that we’re not used to seeing usedin concert together. Retailers and manufacturers need to understandconsumer’s modern path with clear insight and science-minded action.FROMTOLINEARNETWORKEDCopyright 2017 The Nielsen Company (US), LLC. All Rights Reserved.13
RETAILTRIP ANALYTICS BY CHANNELDeclines in grocery traffic extend the drop in overall consumer tripsTrips/ShopperTrips/Shopper% Change Spend/Trip Spend/Trip% Change165-1.331-0.2Online68.240-5.1Drug stores20-2.0201.3Dollar stores300.2130.1Warehouse club14-1.666-2.1Pet stores7-3.735-3.6Mass merch & supers370.941-1.0Value grocery180.2260.5Conventional grocery59-2.5330.5Premiere fresh grocery14-2.3222.4TOTAL CHANNELSSource: Nielsen Homescan, Trip Projected Data, Total U.S., 52 weeks ended Sept. 30, 2017 vs. year-ago, UPC-codedConsumer trips within grocery channels have contracted, while trips viaonline channels have increased quite substantially, at 8%. It’s common toview the online and offline worlds separately, and often in competing ways.But in order to survive in today’s market, it’s imperative to think of the twoworking inter-dependently. Grocery stores, and retail stores in general, arestill integral to today’s path to purchase. There’s simply been a change inhow they’re integrated with consumer behavior and decision making.“Showrooming” is a term used to describe consumers’ interaction witha physical store to examine products before they buy them online. Thisphenomenon will be key to retailer sustainability. Nearly 75% of groceryshoppers have used a physical store to “showroom” before purchasingonline. The store is still pivotal to the shopper experience, and there’sopportunity to convert showroomers or drive online purchases throughone’s own online retail platforms. As the number of shopping trips declines,the cost of missed conversion opportunities rises. Becoming well versedin digital shopping fundamentals and optimizing price and promotionalfactors can unlock the hidden potential in a matrixed retail landscape. Nowis the time to nail the basics.But, it’s also imperative that you think about what’s next for the digitallyenabled in-store experience. Not too far from now, it’s likely that shopperswill be able to hear from the farmer that grew the organic produce in frontof them, via an augmented reality experience. How would you tell your storywith that technology in shoppers’ hands?Copyright 2017 The Nielsen Company (US), LLC. All Rights Reserved.14
RETAILTHIS ISN’T THE END FOR GROCERY STORESOnline and in-store shopping behavior go hand in hand% RESPONDENTS, WHILE GROCERY SHOPPING, WHO HAVE:13%52%35%WEBROOMINGResearch products online,but then buy them in a store.Never26%Once in awhileRegularly47%27%SHOWROOMINGVisit a physical store in order to examine aproduct before buying it online.Source: Food Marketing Institute (FMI) Survey of 1,979 respondents, conducted as part of the Nielsen & FMI Digitally Engaged Food Shopper Study, 2017Copyright 2017 The Nielsen Company (US), LLC. All Rights Reserved.15
RETAILPRIVATE LABEL PERFORMANCEPrivate label growth trajectory rises beyond all branded tiers GROWTH OF FMCG MANUFACTURERS 3.2% 2.4% 1.9% 1.4% 1.1%Private labelTop 2021-1000.0%-0.3%-0.6%0.0%-0.4%Q4 2016Q1 2017Q2 2017101-200RemainingQ3 2017Source: Nielsen Retail Measurement Services, Core syndicated hierarchy, Total U.S., 52-week periods vs. year-ago, latest period to Sept. 30, 2017, UPC-codedOver the last year, we’ve seen a performance reversal among private-labeland manufacturer-branded products. While manufacturers of all sizes sawflat or positive performance in the fourth quarter of 2016, store-brandedproducts took the lead a year later, growing at 2%.The discount grocery channel continues to invest in private-brandedproducts. With over half of dollar volume sourced by retailer-brandeditems, manufacturers seeking entrance into this channel need to vocalizethe premium- or value-added differentiators of their offering. Or, likemany manufacturers, consider working with retailers on their private labelofferings.Copyright 2017 The Nielsen Company (US), LLC. All Rights Reserved.16
RETAILPRIVATE LABEL CHANNEL PERFORMANCEDiscount grocers hold private brands close to their strategy SHARE BY CHANNELPrivate roceryPetstoresMass merch& supersDrugstoresDollarstores-2%-5% 7%PRIVATE LABEL % GROWTH 2% 7% 7% 4% -2%-3% 8%9OnlineSource: Nielsen Homescan, Trip Projected Data, Total U.S., 52 weeks ended Sept. 30, 2017 vs. year-ago, UPC-codedCopyright 2017 The Nielsen Company (US), LLC. All Rights Reserved.17
HEALTH & WELLNESSHEALTH & WELLNESSWHAT’S DRIVING WELLNESSCONSIDERATIONSAs we’ve seen across the grocery retail landscape in the last severalyears, consumer appetites for transparency in the foods they consumehave continued to rise, and that trend is heightened during the holidayseason. Whether that involves shopping to meet specialty diet constraints,choosing to purchase meats with animal welfare claims or manifests in theform of purchasing superfoods, these trends show a promising period forretailers, especially during the holiday season.SOME PERTINENT DRIVERS AFFECTING THELANDSCAPE THIS QUARTER, INCLUDE:Grain-free productsTransparencyAlternative sweetenersCopyright 2017 The Nielsen Company (US), LLC. All Rights Reserved.18
HEALTH & WELLNESSTOP WELLNESS CLAIMS - Q3 2017Grain-free products continue to win on both annual and quarterly horizonsFASTEST GROWING HEALTH & WELLNESS CLAIMS BY DOLLAR GROWTHLATEST 52 WEEKS VS. YEAR-AGOQ3 2017 VS. Q2 2017H&W ClaimDollars % GrowthH&W ClaimDollars % GrowthGrain free706M45.5Grain free211M13.4Cruelty free864M33.2Calorie claim328M8.9Grass fed638M28.5Free range102M8.7Corn free1.36B22.1Mineral presence1.00B7.5Stevia2.18B20.8Oil presence392M5.6Source: Nielsen Retail Measurement Services, Core syndicated hierarchy, Total U.S., periods ended Sept. 30, 2017, UPC-codedDuring both the last year and latest quarter, products with grain-freepackage claims have led in dollar growth. Much if not all of this growth isconcentrated in pet food. Consumers are keen on purchasing productswith simpler ingredients, naturally or responsibly sourced components,and to avoid those that have been overly processed or include unwantedingredients, even for their canine and feline companions. With heightenededucation and awareness, transparency is critical to driving purchasedecisions across a wider range of categories.Copyright 2017 The Nielsen Company (US), LLC. All Rights Reserved.19
HEALTH & WELLNESSCLEAN LABEL SALES GROWTHBY MANUFACTURER TIERAs we noted previously, manufacturer-branded products have struggledto keep pace with private-labels from a sales growth perspective.Additionally, the data shows that manufacturers will need to differentiatetheir offerings, particularly among store-brand-centric channels like valuegrocery. Clean label products present a huge opportunity for developingvalue-added innovations. While the largest of brands have struggled tofind growth with conventional products, a world of new opportunitiesexists for manufacturers of all sizes by catering to consumers’ desire forclean and sustainable goods.SMALL MANUFACTURERS ARE CAPITALIZINGON THE CLEAN LABEL OPPORTUNITYPERCENTAGE DOLLAR SALES 6%SmallestPrivate labelClean9.0%-0.5%7.2%Source: Nielsen, Clean Label Report, 2017, See EndnotesCopyright 2017 The Nielsen Company (US), LLC. All Rights Reserved.20
HEALTH & WELLNESSSWEET TREND: WINNING WITH STEVIABeverages with Stevia are seeing strong performanceStevia has consistently ranked among the top growing health and wellnessclaims this year. Across all categories touting the alternative sweetener onproduct packaging, Stevia claims have driven nearly 2.2 billion in sales. Itis also a sweetener commonly integrated within the beverage space, andhas done well to drive tremendous performance there. In fact, sales ofbeverages with Stevia claims have grown nearly 21% in the latest year. Theimpact on an individual category basis has been even more staggering.Kombucha, while wildly successful on its own ( 43% in dollars vs. yearago), has seen a huge spike from the allure of Stevia. Sales of Kombucha,where Stevia was claimed to be included, reached over 42 million—anincrease of more than 100% from sales a year ago.BEVERAGES WITH STEVIA 20.5%Sales with SteviaSparkling juiceKombuchaLiquid teaSoft drinks Growth 313% 35.3M 42.5M 51.0M 111% 45% 73.6M 32%Fruit drinks 406.3M 23%Source: Nielsen Retail Measurement Services, Core Rewrite syndicated hierarchy, Total U.S., 52 weeks ended Nov. 4, 2017, UPC-codedCopyright 2017 The Nielsen Company (US), LLC. All Rights Reserved.21
E-COMMERCEE-COMMERCEE-commerce is upon us, and further, it’s driving the lion’s share of growthin the FMCG market.8 While it’s important to note the differences betweenonline and offline metrics, it’s even more imperative to remember thatthe key will not be in bricks versus clicks or one channel versus another.Instead, success in the future will depend on the seamless integration ofretail infrastructure with the technologies in consumer hands to enableshopping and pre-shopping research across both worlds.Understanding the role that digital plays in shopping habits begins withuncovering the rate to which product categories have been shoppedonline to-date.FMCG DEPARTMENTS PURCHASED ONLINEWHAT TYPES OF PRODUCTS ARE SHOPPERS BUYING ONLINE TODAY?59%Ever purchased online57%Purchased online in the past 3 %8%HealthPersonal HouseholdcareproductsPetcareSnacksGrocery e: Nielsen, Digital Shopping Fundamentals, 20178Nielsen, Total Consumer Report, Volume 2Copyright 2017 The Nielsen Company (US), LLC. All Rights Reserved.22
E-COMMERCEWhile many departments, like health and personal care, have quite thepresence online, many food-related areas of the store have yet to maketheir mark in the online world. To help shoppers along, you’ll need toalso understand how they want to shop, and online shopping behaviorsoften look quite distinct from what you’d expect to see in store. In fact, theaverage number of departments purchased per shopper inside a store isstill nearly double that of the departments purchased online.9In terms of online order fulfillment, delivery to one’s home is by far themost popular of options. Eighty-seven percent of orders are completedvia home delivery, while 8% are fulfilled via in-store pick up, and 4% bycurbside pick-up. Nonfood categories are among the top purchasedonline; however, when it comes to curbside pick-up, there is hugeopportunity with food, particularly with fresh and perishable items. Freshcategories have the highest consideration of curbside pick-up fulfillment(50% would consider it, and 35% even prefer this type of fulfillment forfresh).10Though there is promise across both food and nonfood domains withregard to online shopping, the need for seamless integration withretailers is further underlined. As part of the Digitally-Engaged FoodShopper analysis we completed with FMI, we found that over one-thirdof surveyed retailers (36%) do not provide online purchasing, and 33%are not equipped to support online purchases (via click and collect, storedelivery or home delivery).11 This leaves much possibility. It also highlightshow much progress still lies ahead in the evolution to a true omnichannelenvironment for all.TOP ONLINE CATEGORIES PURCHASED BY FULFILLMENTDELIVERYIN-STORE PICK-UPCURBSIDE PICK-UPVitaminsToilet paperChips etc.Pet treatsVitamins etc.Fresh fruit/vegToilet paperLaundry careCanned foodsPet suppliesPaper towelsMilk/creamerCosmeticsCleanersPackaged breads etc.Source: Nielsen, Digital Shopping Fundamentals, 20179Nielsen, Digital Shopping Fundamentals, 201710Nielsen, Digital Shopping Fundamentals, 201711FMI survey of 64 retailers, 2017Copyright 2017 The Nielsen Company (US), LLC. All Rights Reserved.23
E-COMMERCEE-COMMERCE - DEPARTMENT INSIGHTSPet Care categories have largest and fastest-growing presence onlineE-COMMERCE % GROWTHE-COMMERCE SHARE OF SALES30.0%Hand & body lotion21.9%Facial cleanser & moisturizer18.3%Dog foodDisposable diapers & training pantsCat food13.2%12.6%-3.2% 6.8% 92.2% 2.7% 63.2%Source: Nielsen E-commerce measurement, Total US, Latest 52 weeks ended Aug. 12, 2017At a category level, pet care strongholds like dog and cat food have seenoutsized growth via e-commerce. Valued at nearly 28 billion dollarsacross both e-commerce and mainstream brick-and-mortar channels, petcare has seen overall sales growth of 25%, with e-commerce driving thevast majority of growth, outperforming in-store rates this year.Looking at dog food alone, e-commerce adds an additional 2.2 billionto the 10 billion dollar valuation of the category in stores and is drivingdollar growth of 92.2%, notably above the in-store dollar growth at 1%.What’s more, at a manufacturer level, the addition of e-commerce to thetraditional landscape broadens opportunities for both small and largebrands. You see, the online space is choc full of smaller niche brands,giving length (and virtual real estate) to an even longer tail of brands thanwe’re used to seeing in traditional retail.Copyright 2017 The Nielsen Company (US), LLC. All Rights Reserved.24
E-COMMERCEONLINE OPPORTUNITY FOR LARGE BRANDSTop dog food manufacturers from B&M see outsized growth onlineTOP 20 MANUFACTURERSDOG FOODTop 20 manufacturersRemaining 1.29B 1.82B 8.13B82% Share 1.1% 0.94B42% Share Growth 114% GrowthTraditional retail (billions)E-Commerce (billions)Source: Nielsen Retail Measurement Services, Core syndicated hierarchy, and Nielsen E-commercemeasurement, Total U.S., 52 weeks ended Aug. 12, 2017And the upside for big players? Currently, the top 20 manufacturers intraditional retail comprise 82% share of dog food and are seeing salesgrowth of 1%. Those same 20 manufacturers are seeing an impressive114% sales growth online. While their online share is half the size of theirshare in traditional channels (42% compared to 82% in brick-and-mortar)due to the many additional competitors in the online space, there is alsoample room to grow. One thing to keep in mind, however, is that growthonline shouldn’t come at the cost of growth in-store. Unfortunately, thereality is that, for many companies, finding growth online comes at thesacrifice of performance in stores. For the top 20 brick-and
The U.S. fast-moving consumer goods (FMCG) industry is no less competitive, nor is it likely that future growth will be arrived at with ease. . Source: Nielsen Consumer Confidence Survey, Q3 2017 1 Nielsen Homescan online survey of 25,241 respondents, surveyed in Sept. 2017 Q2 2017 North America United States Q3 2017 117 118 119 121 Q3 2016