Transcription
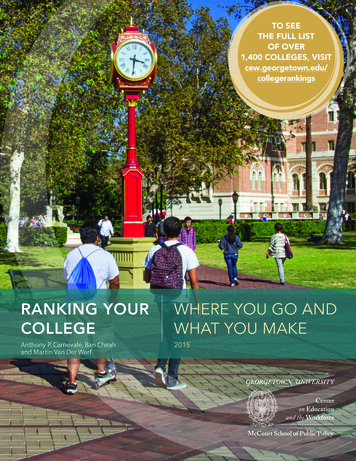
TO SEETHE FULL LISTOF OVER1,400 COLLEGES, VISITcew.georgetown.edu/collegerankingsRANKING YOURCOLLEGEWHERE YOU GO ANDWHAT YOU MAKEAnthony P. Carnevale, Ban Cheahand Martin Van Der Werf2015
AN ANALYSIS OFTHE COLLEGE SCORECARDIn September 2015, the U.S. Department of Education released its redesigned College Scorecard,a web tool that allows users to access a vast array of information about the quality of colleges anduniversities throughout the country. For the first time, users can easily find how much studentswho have taken courses in thousands of colleges across the United States earn 10 years afterenrolling, which is essential information for students deciding where to go to college and howmuch debt to take on.1 The Department of Education designed the College Scorecard to beused by prospective students evaluating their college options.The following tables use the College Scorecard data to rank colleges and universities strictly onearnings, but then test how sensitive the ranking of a university is when adjustments are madeto earnings.2 The analysis attempts to help answer several questions: How important is studentpreparation? How much are average earnings skewed by choice of majors and by the selection ofmajors available at a particular university? If a university, such as Stevens Institute of Technology,ranks high strictly in earnings but much lower after adjusting for composition of majors, it wouldindicate that the distribution of majors at the university is of primary importance. If anotheruniversity, such as Harvard, retains its ranking even after adjusting for expected earnings based onits share of majors, it might indicate that the quality of the university matters as much as the majorsit offers.The academic preparation of the students is another important factor. If a university, such asPepperdine University, rose in the rankings based on this factor, it is a clear indication that theuniversity was able to produce a higher quality of students than would have been expected basedon the students' academic preparation. In other words, a university helped students to becomebetter and earn more money in their future.1The data is limited to students who file for federal financial aid and includes both graduates and non-graduates. Earnings data were derived from tax returns.2We exclude special focus institutions and tribal colleges and only include predominantly Bachelor’s degree-granting institutions. The College Scorecard sometimes poolsthe median earnings of colleges with multiple locations into one aggregate median earnings figures. For instance, students at the University of Phoenix all earn 53,400regardless of whether they are on the Hawaii Campus or in southern Arizona. This is also true for Pennsylvania State University. However, median earnings for IndianaUniversity and the University of Wisconsin are different for students at different campuses.
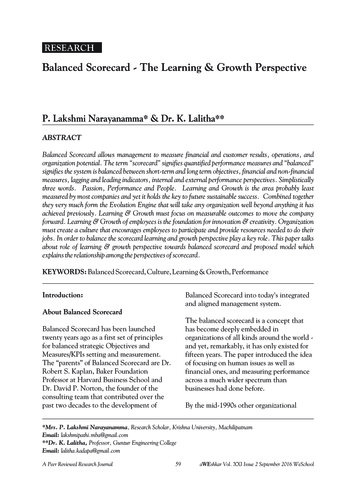
To see the full listof over 1,400 colleges, le 1 shows the 20 four-year colleges whose students go on to earn thehighest salaries in the labor market 10 years after beginning their studies.Students at the Massachusetts Institute of Technology (MIT) earn 91,600 per year,the highest among four-year colleges and universities, followed by the United StatesMerchant Marine Academy and Harvard University.The list of the top 20 institutions with the highest earnings consists of two types of institutions:1) elite private universities and liberal arts colleges, such as Harvard University and Washington andLee University, and 2) institutions that primarily focus on technology and engineering, such as MIT and Harvey MuddCollege, business, such as Bentley University, or training students for jobs in specific industries, such as the fourmaritime academies and the Colorado School of Mines.Table 1. Students who attend the Massachusetts Institute of Technology (MIT) earn 91,600annually 10 years after initially enrolling, the highest among four-year colleges.ANNUALEARNINGSGRADUATIONRATEMassachusetts Institute of Technology 91,60093%United States Merchant Marine Academy 89,00075%MAHarvard University 87,20097%DCGeorgetown University 83,30093%5NJStevens Institute of Technology 82,80078%6NYRensselaer Polytechnic Institute 81,70085%7CACalifornia Maritime Academy 81,10058%8CAStanford University 80,90095%9MAMassachusetts Maritime Academy 79,50064%10CAHarvey Mudd College 78,60090%11PAUniversity of Pennsylvania 78,20096%12MAWorcester Polytechnic Institute 77,60082%13VAWashington and Lee University 77,60090%14NYSUNY Maritime College 77,30048%15PALehigh University 76,80087%16NCDuke University 76,70094%17NJPrinceton University 75,10096%18MABentley University 74,90086%19MIKettering University 74,90059%20COColorado School of Mines 74,70068%RANKSTATE1MA2NY34INSTITUTIONSource: Georgetown University Center on Education and the Workforce analysis of data from the U.S. Department of Education’s College Scorecard, 2015.
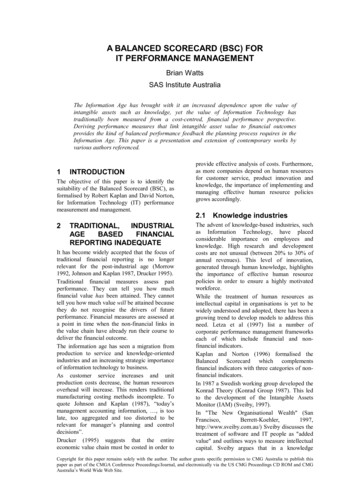
EARNINGS AND MAJOR/PROGRAM DIFFERENCESOne of the chief reasons that some college graduates earn more than others is their major or program of study. For example,petroleum engineering majors earn 136,000 annually at mid-career, while early childhood education majors earn 36,000.Colleges differ substantially in terms of the majors they offer to their students. Some colleges have high concentrations ofhigh-earning majors like engineering and business, while others have high concentrations of low-earning majors like educationand social work.For example, based on the unadjusted earnings data, Lehigh University ranks 15th. Its students earn 77,000 annually, 10years after starting their studies. Lehigh also has a large share of engineering and business majors: 30 percent of Lehighundergrads study engineering and 27 percent study business.3 Are Lehigh’s high earnings figures driven by the overallquality of the education Lehigh provides or the large share of students enrolled in majors that tend to lead to high earningsin the labor market?In an effort to isolate the effects of the quality of the colleges, as opposed to differences in majors, we adjust for differencesin the composition of majors within each institutions’ undergraduate student population.4 Attending Harvard University,Georgetown University, and the Massachusetts Institute of Technology leads to the highest earnings relative to what wewould expect based on their composition of majors (Table 2). Notably, relative to the unadjusted rankings, MIT moves fromfirst to third in these rankings and many of the maritime colleges drop out of the top 20. Molloy College and the University ofthe Pacific move into the top 20, while the California Maritime Academy falls from seventh to 19th.5Table 2. Former Harvard University students earn 29,200 more thanwould be expected based on their choice of majors.RANK STATE CE INEXPECTED ANDGRADUATIONMEDIAN EARNINGSRATE1MAHarvard University 57,900 87,200 29,20097%2DCGeorgetown University 54,00 83,300 29,00093%3MAMassachusetts Institute of Technology 65,800 91,600 25,80093%4CAStanford University 55,400 80,900 25,50095%5MABentley University 50,000 74,900 24,90086%6PAUniversity of Pennsylvania 53,600 78,200 24,60096%7NCDuke University 52,400 76,700 24,30094%8VAWashington and Lee University 54,600 77,600 23,00090%9CAUniversity of the Pacific 45,700 66,400 20,70057%10NYMolloy College 37,300 57,500 20,20064%11PAVillanova University 53,800 73,700 19,90089%12NYCornell University 51,100 70,900 19,80093%13MABoston College 48,200 67,000 18,80092%14CTFairfield University 50,400 69,000 18,60081%15MNMartin Luther College 22,500 40,400 17,90075%16PACarnegie Mellon University 54,300 72,000 17,70087%17NYSaint Joseph's College-New York 34,500 51,800 17,30070%18RIProvidence College 43,100 59,600 16,50086%19CACalifornia Maritime Academy 64,900 81,100 16,20058%20MDJohns Hopkins University 53,400 69,200 15,80092%Source: Georgetown University Center on Education and the Workforce analysis of data from the U.S. Department of Education’s College Scorecard, 2015.*Based on the composition of undergraduates’ majors at the institution.3Business is the most common undergraduate major among Bachelor’s degree-holders.4The composition of major data includes all undergraduates enrolled at the respective college or university.5The composition of majors explains half of the overall variation in median earnings across schools.
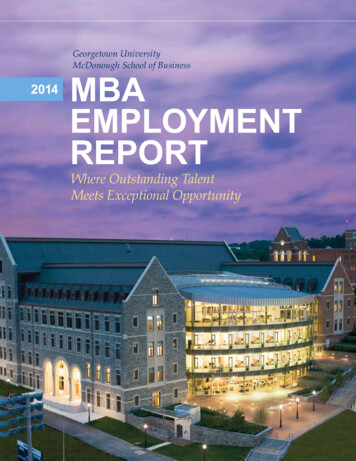
EARNINGS AND ACADEMIC PREPARATION ANDGRADUATE DEGREE ATTAINMENTTwo other factors that result in differences in earnings among four-year colleges are students’ academic preparation andwhether they go on to earn a graduate degree after completing their Bachelor’s degree. If a college enrolls highly-preparedstudents and they go on to have high earnings in the labor market, how much should we credit the quality of the educationthe university provides relative to the quality of students it selects?Similarly, many college graduates go on to earn graduate degrees, which lead to 28 percent higher earnings than Bachelor’sdegrees alone. If students attend a four-year college and then go on to earn graduate degrees, how much credit shouldthe college which these students attended as undergraduates receive for their earnings relative to the college where theyattended graduate school?Neither of these questions have simple answers. To isolate these effects, we modify major-adjusted rankings to account fordifferences in academic preparation and graduate degree attainment (Table 3). Former students of Georgetown Universityearn the most relative to what we would expect them to earn given their level of academic preparation and graduate degreeattainment, followed by University of the Pacific and Harvard University.Table 3. Former students of Georgetown University earn the most relative to what we would expectthem to earn given their majors, level of academic preparation, and graduate degree attainment.RANK STATE NCE INEXPECTED ANDGRADUATIONMEDIAN EARNINGSRATEDCGeorgetown University 61,700 83,300 21,60093%2CAUniversity of the Pacific 45,700 66,400 20,70057%3MAHarvard University 67,000 87,200 20,20097%4VAWashington and Lee University 60,400 77,600 17,20090%5CAStanford University 63,900 80,900 17,00095%6CACalifornia State University-Bakersfield 31,700 48,100 16,40039%7MAMassachusetts Institute of Technology 75,900 91,600 15,70093%8NCDuke University 61,800 76,700 14,90094%9PAUniversity of Pennsylvania 63,800 78,200 14,40096%10PAHoly Family University 36,700 49,900 13,20058%11MNSaint John’s University 42,700 55,900 13,20078%12MAMassachusetts Maritime Academy 66,300 79,500 13,20064%13CAPepperdine University 48,300 61,400 13,10081%14CAMount St. Mary's College 37,320 50,200 13,00061%15CANational University 42,200 54,800 12,60043%16NYMolloy College 45,000 57,500 12,50064%17CAChapman University 39,600 51,800 12,20074%18MABentley University 62,900 74,900 12,00086%19CACalifornia State University-Stanislaus 32,900 44,900 12,00050%20CACalifornia State University-SanBernardino 33,600 45,500 11,90042%Source: Georgetown University Center on Education and the Workforce analysis of data from the U.S. Department of Education’s College Scorecard, 2015.*Based on students’ ACT composite scores and likelihood of earning a graduate degree.
METHODOLOGY AND DATA SOURCESThis report relies on data from the U.S. Department of Education’s College Scorecard. The data are available fordownload here: https://collegescorecard.ed.gov/data/Students who applied for financial aid were matched to their tax returns 10 years after initially filing for financial aid. Themedian earnings for these students were in turn matched to the university for which they sought financial aid.We restricted the data to Bachelor’s degree-granting institutions and excluded special focus institutions and tribal colleges.We used regression analysis to predict former students’ median earnings 10 years after first enrollment based on theshare of students in different majors. The complete list of majors is: Agriculture, agricultureoperations, and related sciences English language andliterature/letters Architecture andrelated services Family and consumersciences/human sciences Area, ethnic, cultural,gender, and group studies Foreign languages,literatures, and linguistics Biological andbiomedical sciences Health professions andrelated programs Business, management,marketing, and relatedsupport services History Communication, journalism,and related programs Communicationstechnologies/techniciansand support services Computer and informationsciences and support services Homeland security, lawenforcement, firefighting andrelated protective services Legal professions and studies Liberal arts and sciences,general studies,and humanities Multi/interdisciplinary studies Natural resourcesand conservation Parks, recreation, leisure,and fitness studies Personal and culinary services Philosophy andreligious studies Physical sciences Precision production Psychology Public administration andsocial service professions Science technologies/technicians Library science Social sciences Construction trades Mathematics and statistics Education Mechanic and repairtechnologies/technicians Theology and religiousvocations Engineering Engineering technologies andengineering-related fields Military technologiesand applied sciences Transportation andmaterials moving Visual and performing artsSeveral majors include agriculture, agriculture operations, and related sciences; personal and culinary services; andtransportation and materials moving are offered at only a few institutions. They are also included in the regressionequation in order to more completely differentiate high- versus low-paying majors.In Table 2, we subtracted the predicted earnings of the given composition of majors from the scorecard earnings, whichis then used to rank the schools. Although we do not include the confidence intervals around the predictions, the readershould note that there may not be statistically significant differences in the earnings between the top and second rankedinstitutions if their earnings are very similar.In Table 3, we adjust for student characteristics. We use the median ACT score and the share of holders of graduate andprofessional degrees in the student’s zip code to adjust for different levels of college preparation and the possibility that thestudents went on to obtain a graduate degree. If those student characteristics were not reported in the scorecard data, amean was substituted. The predicted earnings were subtracted from the reported earnings and the difference was used torank the schools.
ACKNOWLEDGEMENTSWe would like to express our gratitude to the individuals and organizations whose generoussupport has made this report possible: Lumina Foundation (Jamie Merisotis and Holly Zanville),The Bill & Melinda Gates Foundation (Daniel Greenstein and Jennifer Engle) and The JoyceFoundation (Matthew Muench). We are honored to be partners in their mission of promotingpostsecondary access and completion for all Americans.Many have contributed their thoughts and feedback throughout the production of this report.We are grateful for our talented designers, meticulous editorial advisors, and trusted printerswhose efforts were vital to our success. In addition, the dedication of the Georgetown Center'seconomists, analysts, writers, communications team, and operations staff was instrumental toproduction of this report, from conceptualization to completion. Jeff Strohl provided the initial impetus and research direction Andrea Porter provided strategic guidance Artem Gulish and Andrew Hanson contributed insightful comments and writing Ana Castanon, Monet Clark, Vikki Hart, and Hilary Strahota led the communications efforts,including design, editorial review, and public relations Coral Castro and Joe Leonard assisted with logistics and operationsTHE VIEWS EXPRESSED IN THIS PUBLICATION ARE THOSE OF THE AUTHORS AND DO NOTNECESSARILY REPRESENT THOSE OF LUMINA FOUNDATION, THE BILL & MELINDA GATESFOUNDATION, THE JOYCE FOUNDATION, OR THEIR OFFICERS OR EMPLOYEES.REPRINT PERMISSIONThe Georgetown University Center on Education and theWorkforce carries a Creative Commons license, which permitsnon-commercial re-use of any of our content when properattribution is provided.You are free to copy, display, and distribute ourwork, or include our content in derivative works,under the CEW’s following conditions:Attribution: You must clearly attribute the workto the Center on Education and the Workforceand provide a print or digital copy of the work tocewgeorgetown@georgetown.edu.Our preference is to cite figures and tables as follows:Source: Georgetown University Center on Education andthe Workforce, Ranking Your College.Noncommercial: You may not use this work forcommercial purposes. Written permission mustbe obtained from the owners of the copy/literaryrights and from Georgetown University for any publicationor commercial use of reproductions.Approval: If you are using one or more of ouravailable data representations (figures, charts,tables, etc), please visit our website at cew.georgetown.edu/publications/reprint-permission for moreinformation.For the full legal code of this Creative Commons license,please visit creativecommons.org.Should you need a form to be filled out by us, pleaseemail cewgeorgetown@georgetown.edu and we willrespond in a timely manner.
Ranking Your College: Where You Go and What You Makecan be accessed online at cew.georgetow.edu/collegerankingsThe Georgetown University Center on Education and the Workforce3300 Whitehaven Street, NW, Suite 3200Washington, D.C. 20007Find out how much students earn 10 years afterenrolling at more than 1,400American colleges and universities.ANALYSIS OF THE COLLEGE SCORECARDcew.georgetown.edu
THE COLLEGE SCORECARD In September 2015, the U.S. Department of Education released its redesigned College Scorecard, a web tool that allows users to access a vast array of information about the quality of colleges and universities throughout the country. For the first time, users can easily find how much students