Transcription
Direct Auto ProgramInvestor PresentationOneMain Holdings, Inc.
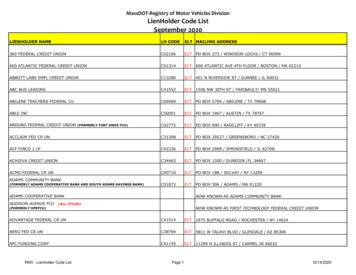
The Leading Consumer Finance Company 13.2B of branch receivables to over 2 million customers(1)National Footprint 87% of Americans live within 25 miles of one of OneMain’s 1,837 branches(2) Four central servicing center facilities complement branch networkDisciplinedUnderwritingCollateral Ability-To-Pay underwriting backed by centralized proprietary scoring modelsand 100 years of disciplined lending experience Direct Auto receives an additional layer of collateral focused underwritingincluding LTV, vehicle year, make, and mileage Extension of our highly successful Secured Personal Loan program; Springleafhas decades of experience and consistently low losses Program focuses on recent vintage automobiles (aged 8 years or less)100%Direct Auto 100% Direct Auto program (vs. indirect loans originated by auto dealers) Planned routine issuer of Direct Auto only ABS transactions(1) As of March 31, 2016(2) Reflects the acquisition of OneMain Financial Holdings, LLC (“OneMain Financial” or “OMFH”) in November 2015 and includes pro forma branch sale of 127 branches to Lendmark in May 20162
OneMain Overview OneMain Holdings brings together two leading branch-based personal finance companies Successful Direct Auto business launched in 2014 at Springleaf and in 2016 at legacy OneMain With 1,800 locations and 10,000 team members OneMain serves the financial needs of millions of Americans NYSE listed (OMF) current market cap of 3.4bn(1)Leading National Footprint(1)Overview(2)(3)87% of Americans live within 25 miles of a OneMain branch 13.2 billion in consumer finance receivables and over 2 million customers 8.7 billion of finance receivablesOneMainFinancial(“OMFH”) 1,140 branches in 43 states In business for over 100 years 4.5 billion of finance receivablesSpringleafFinancial 697 branches in 27 states digitalplatform In business for nearly 100 yearsLegacy SpringleafFootprintCurrent ExpandedFootprint(2)28 states16 states(1) As of June 13th 2016(2) Reflects the acquisition of OneMain Financial Holdings, LLC (“OneMain Financial” or “OMFH”) in November 2015 and includes pro forma branch sale of 127 branches to Lendmark in May 2016(3) As of March 31st 20163
Strong Business Model Built onSimple ConceptsOur Lending Model Local branch based lending with personal service‒ Borrowers visit branch to close loan‒ Verify Income‒ Inspect and photograph collateral Sophisticated underwriting and extensive credit data/models‒ 100 years of consumer lending‒ Underwrite to each customer’s ability to pay Fully licensed in every state we do business Experienced servicing through multiple economic cycles‒ Four state of the art centralized servicing facilities Extensive footprint and scale drives operating leverage and returns– 87% of Americans live within 25 miles of one of our 1,837 branches(1)(1) Reflects the acquisition of OneMain Financial Holdings, LLC (“OneMain Financial” or “OMFH”) in November 2015 and includes pro forma branch sale of 127 branches to Lendmark in May 20164
Significant Addressable ConsumerMarket Americans have over 3.4T in consumer debt(1) 63% of U.S. households do not have at least 1,000 in savings(2), and more than 40% of households haveno emergency savings(3) OneMain offers crucial access to credit for a large portion of the American populationOur target consumer market is huge - 2T(1)Over 100M Americans with FICO 700(4) 13%(750-799)18%(700-749)17%(1) Federal Reserve Board of New York, Household Debt and Consumer Credit Report, Q12016(2) Bankrate.com – Money Pulse Poll – December 2015(3) Federal Reserve Bank of New York; Federal Student Aid/U.S. Department of Education, Q12015(4) Data from FICO Analytics blog, entry from April 2015 – Non-Prime defined as less than 700 FICO5
Customer Demographics Customer base representative of Americanpopulation OneMain and Springleaf have similar borrowerprofiles Borrowers typically have stable job andresidence history and consistent income Favorable employment trendsAgeHomeownersTime in ResidenceGross Household Income (est.)Average Years on JobFICO(1)51 yr.59%12 yrs. 46,00011 yrs.63549 yr.50%11 yrs. 46,0008 yrs.602Customer Survey Results(2)Personal Loan PurposeEmploymentFinancial Product UsageHigh Concentration of Stable nsolidation37%HouseholdBills21%Q1 2016 Originations active as of March 31st 2016.Results from legacy Springleaf Customer Survey taken during Q2 nting, Finance or Insurance6%Construction or Transportation6%Have a Checking Account95%Have Credit Cards62%50%6
Loan ProductsSpringleaf Q1 2016 Originations(1)Springleaf Direct Auto Portfolio Top 10 VehiclesDirectAutoHardSecuredUnsecuredAvg. Loan Size 14,930 6,662 4,592Orig. Term54 mos46 mos44 mosAvg. APR17.8%26.9%29.1%Avg. Age Vehicle5.5 yrs12.5 yrsn/aOrigination FICO610595605% of Total Book18.2%38.4%43.4%(1) Legacy Springleaf only: represents Q1 2016 originationsRankModelMakeAvg. AgeVehicle12345678910SILVERADOFORD F150RAM 1500 PSIERRA 150CAMRY-4 CYTUNDRATAHOE-V8300F250 10Avg LoanBalance 15,224 14,691 15,090 15,932 10,698 16,491 14,378 10,848 16,288 12,6307
Direct Auto Lending Direct Auto was launched in 2014 as an extension of Springleaf’s Hard Secured Personal Loan Product;offering borrowers a larger, lower rate product Business led by a team of seasoned leaders hired primarily from Wells Fargo Auto Finance Borrowers must pass our personal loan underwriting and our incremental centralized auto underwriting Direct origination model (not at dealership) and budget based ability-to-pay underwriting has producedconsistently low lossesProduct Type(1)Direct vs. Indirect AutoOne MainDirect AutoPurposeInterest RateUnderwritingClosing(1)Predominantly refi/cashout refiInterest rate set centrallyby risk grade (no branchinput)Indirect AutoVehicle purchase19%Dealer ability to markupinterest rateScore based lending,Budget based cash-flowcompeting for autolending at a personal leveldealers businessLoan made directly toborrower at local branchQ1 2016 Direct Auto Originations : Vehicles 0-8 years old only72%Free and Clear6%Purchase2%RefinanceRefinance PlusLoan closes at dealer8
Experienced Auto Management TeamLeadership TeamBackgroundResponsibilitiesRobert Hurzeler, COOand EVP Auto LendingOperations COO for Global Lending Services (2012-2014)(automotive subprime lender) President Wells Fargo Auto Finance (2008-2012) Wells Fargo Direct Lending Operations from 19862008Rick HeinrichCentral Underwriting 21 years in various leadership positions at WellsFargo Auto Finance Led Indirect and Direct Auto OriginationCenters for Wells Fargo North AmericaManages all aspects of Underwritingfor Auto and Personal loansBrian PetrichCentral Verifications 25 years in Indirect and Direct Auto Financeleadership roles in Underwriting, Servicing andAcquisitions 13 of the 25 in Operational Risk Managementleading teams in Fraud Monitoring, RegulatoryAudits and QAManages the Auto title perfectionprocess, utilizing a third partyvendor, to complete verification ofpotential borrower information, andfulfillment of loans 22 years of Consumer Lending Experience inOriginations, Operations, Product and RiskManagement 7 years of Auto Specific Experience in rolessuch as Operations, Product and RiskManagementManages Auto and Merchant ReferralBusiness Development opportunitiesas well as Managing the sales processfor Central OriginationsRobert ButtermoreCentral Sales, Auto &Personal Loan ReferralManages the Direct Auto Product,all Springleaf Central ServicingOperations, and Branch Network9
Nationwide Centralized OperationsPre-Acq. Footprint28 states Centralized Operational HighlightsOver 1,200 central underwriting andservicing FTEs compliment our 1,800 branch network 5 geographically diverse centers All 60 delinquent loans servicedcentrallyCurrent ExpandedFootprint(1)16 statesCentral Support CenterMinneapolis,MN Sales UnderwritingandVerification Auto BusinessHeadquartersLondon, KYEvansville, INTempe, AZ 60 DayCollections SpringCastle Run-OffServicing Out of FootprintServicing Non-CoreServicing Bankruptcy andLitigation Central Sales Verifications 60 DayCollections SpanishServicing Sales UnderwritingFort Mill, SC(Previously OMF) 60 DayCollections ProjectManagement(1) Reflects the acquisition of OneMain Financial Holdings, LLC (“OneMain Financial” or “OMFH”) in November 2015 and includes pro forma branch sale of 127 branches to Lendmark in May 201610
Rigorous Borrower UnderwritingCapacityIncome/ability to payApplicationSourcingCollateralAdditional loan support Customer information is collected in person, over the phone or onlineCredit Scoring Traditional and non-traditional data used to build the strongest underwriting tools Custom scoring models leverage the following key attributes– Bureau inquiries, recent payment behavior, stability, debt utilization, delinquencyAbility to Pay Ability to pay is determined using verified sources of income to calculate a consumer’smonthly payment obligations (including new loan)– Only lend against a portion of the borrower’s free cash flowCentralizedAutoUnderwriting Combination of Branch and Centralized underwriting(1)– Senior underwriters average 11 years of auto loan underwriting experienceVerification(1)CharacterWillingness to payApplies to Direct Auto originations only Verified application information (includes income, employment, identity, address,and telephone number) Confirm vehicle attributes including mileage, year of vehicle, insurance coverage, etc.11
Highly Effective Servicing ModelEffective Hybrid Operating ModelBranch Processes Local presence and personalrelationships Merchant referrals Loan applications/processingDocumentation and verificationPersonal loan underwritingLoan closing and funding Relationship management 60 days past due collections Payoff processingFunctionCentralized ProcessesMarketing Branding and advertisingDirect mailOnline marketingCustomer retention strategiesOriginations/Underwriting PricingCredit policy and scoringUnderwriting policyAuto underwritingServicing/EarlyStage CollectionsLate StageCollectionsPost Charge-Off Lockbox for centralizedpayments Insurance administration 60 days past due collections Default management services Charge-off collections12
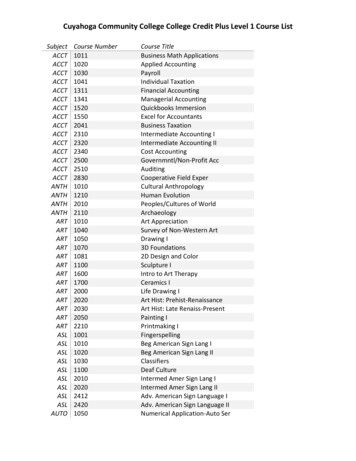
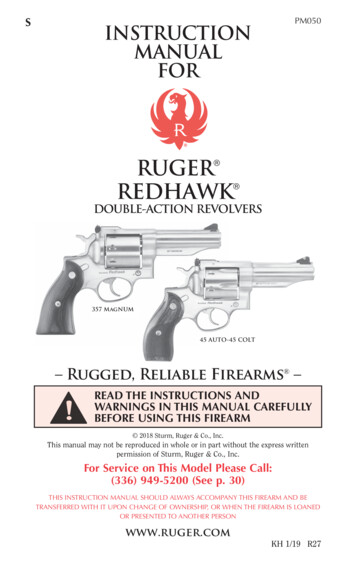
Direct Auto: All 30 Day DelinquencyOutcomes(1)(2)(1)(2)Other includes loans whose delinquency was affected by some other means than borrower assistance including judgment, insurance claim, etc.Percentage of 30 portfolio13
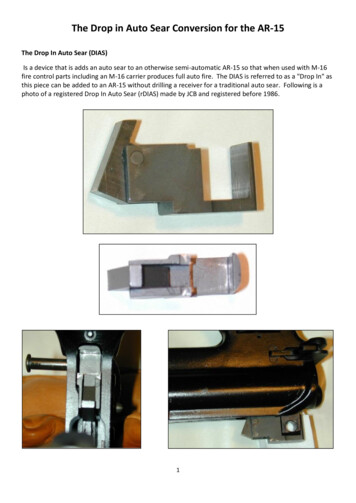
Time Tested PerformanceOur extensive underwriting and servicing experience has generated robust credit performancethrough cyclesNet 003200420052006(1)S&P Subprime Auto20072008200920102011Secured Personal Loans2012201320142015(2) Direct Auto is an extension of our secured personal loan product with newer vehicles and lower borrower rates Incremental underwriting vs. hard secured personal loans utilizing LTV, vehicle year, mileage, DTI, PTI Leverages existing infrastructure (over half of total Springleaf portfolio is auto secured) Historically Auto secured loans historic losses exhibit 50% lower loss vs. our traditional hard secured personal loans–(1)(2)Lower frequency of loss more impactful than collateral value/severityS&P Subprime Auto TrackerLegacy Springleaf Hard Secured Personal Loans and Direct Auto Loans14
Auto ABS Industry CompsOneMainQ1 2016Originations (1)CPS 2016-BWLAKE 2016-2AMCAR 2016-2FCAT 2016-2FIOAT 2016-1CFCAT 2015-1Origination 0.0%14.7%85.3%25.6%74.4%28.1%71.9%Collateral CharacteristicsAvg. Curent Loan BalWA APRWA FICOWA LTV (2)WA Orig Term (months)WA Rem Term (months)WA Seasoning (months) 14,93017.78%610114.6%54.053.30.7 15,87919.74%564114.0%67.466.80.6 10,94519.80%604111.7%52.048.04.0 18,71212.19%574110.0%71.062.09.0 18,71715.37%589119.0%71.070.00.6 21,65413.15%584124.8%71.069.02.0 11.4%TX (14.2%)CA (9.6%)NC (7.7%)TX (31.4%)CA (17.7%)FL (6.8%)Original Term0 -3637 -4849 -6060 (3)FICO Distribution500 & Lower501-550551-600601-650651 & HigherGeographic ConcentrationTop 3 States(1)(2)(3)3.3%13.5%24.8%34.5%23.8%23.44% (thin)-16.0% ( 540)24.0% ( 540)20.6% (540-599) 44.0% (540-599)25.4% (600-659) 31.0% (600-659)14.6% ( 660)2.0% ( 660).CA (8.7%)TX (7.9%)IL (7.1%)Springleaf originations as of Q1 2016Clean trade-in value no additionsOriginal term buckets for FCAT 2016-1 represent the FCAT 2015-3TX (7.8%)CA (7.4%)OH (6.9%)CA (26.4%)FL (13.8%)NY (4.14%)TX (19.14%)FL (7.62%)CA (6.77%)TX (15.2%)FL (11.2%)CA (10.3%)15
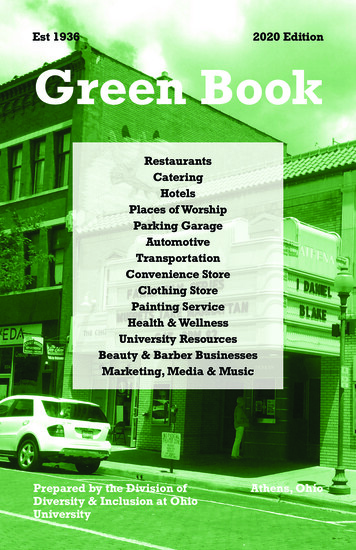
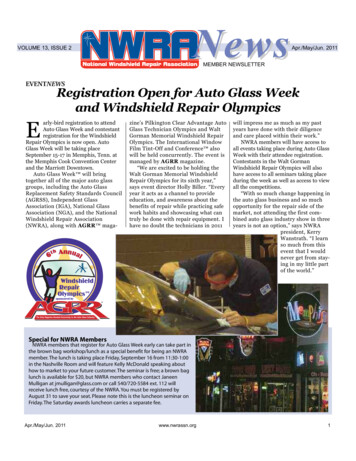
Springleaf Direct vs. IndirectPerformance Direct Auto collateral across various originators has significantly outperformed Indirect autoCumulative Net Loss: Direct vs. Indirect (1)(2)(3)(4)(1)(2)(3)(4)First Investors loss data represents blended average of Q1 – Q2 2014 vintage losses; CarFinance loss data represents a blended average Q1-Q3 2014 vintage losses; Source: Offering DocumentsSDART loss data represents SDART 2014-1 through 2014-4 cumulative loss performance : Offering DocumentsOneMain Direct Auto – blended average of Q3 and Q4 2014 vintage losses: Vehicles 0-8 years old onlyLosses are weighted averages of quarterly vintages/trusts and exclude months where loss data is not fully seasoned for a given quarter16
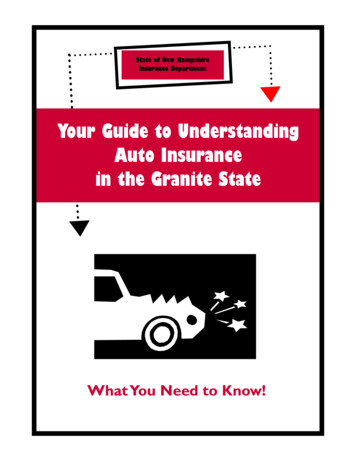
Springleaf Direct Auto PerformanceDirect Auto Cumulative Losses by Quarterly 0.77%0.65%1.00%0.00%123Q3 2014QuarterlyOriginations456Q4 201478910Q1 20151112Q2 2015131415Q3 20151617Q4 201518192021Q1 2016 85M 162M 165M 214M 220M 236M 175MCNL(2)1.7%1.2%0.8%0.7%0.2%0.0%0.0%Current %Outstanding (2)34.2%39.7%52.4%64.0%75.2%84.1%91.7%( millions)(1)(2)Losses are weighted averages and exclude months where loss data is not fully seasoned for a given quarter: Vehicles 0-8 years old onlyCumulative Net Loss and Current % Outstanding reflect the most recent month on book, as of May 201617
Appendix18
Direct Auto Loan Illustration The charts below illustrate the four product types using estimated depreciation on an average vehicle(1)Free & Clear (19%)Cash-Out Refi (72%)80% 32,000 28,00070% 28,00060% 24,000 20,000 16,00050%40% 20,00030%20% 8,00020%10% 4,00010% 4,0000% 00.0 0.5 1.0 1.5 2.0 2.5 3.0 3.5 4.0 4.5 5.0 5.5 6.0 6.5 7.0 7.5 8.0 8.5 9.0 9.5 10.0Years0%0.0 0.5 1.0 1.5 2.0 2.5 3.0 3.5 4.0 4.5 5.0 5.5 6.0 6.5 7.0 7.5 8.0 8.5 9.0 9.5 10.0YearsPrior Loan Balance (LHS)Depreciation% (RHS)Value of Car (LHS)New OMF Loan Balance (LHS)Purchase (6%) 28,000 32,00070% 28,00060% 24,00060% 20,00050% 16,00040% 12,00030%20%10%50% 16,00040% 12,00030% 8,00020% 8,000 4,00010% 4,0000%0.0 0.5 1.0 1.5 2.0 2.5 3.0 3.5 4.0 4.5 5.0 5.5 6.0 6.5 7.0 7.5 8.0 8.5 9.0 9.5 10.0YearsValue of Car (LHS)Depreciation% (RHS)(1) For illustrative purposes onlyNew OMF Loan Balance (LHS)80%70% 0Depreciation % 20,000 0Avg. Balance: 15,923Avg. WAC: 15.9%Avg. LTV: 123%Avg. Mileage: 67,36380%Depreciation %Value of Car 24,000Prior Loan Balance (LHS)Depreciation% (RHS)Refinance (2%)Value of Car 32,00050%40% 8,000Avg. Balance: 13,850Avg. WAC: 16.1%Avg. LTV: 104%Avg. Mileage: 80,74460% 12,00030%Value of Car (LHS)New OMF Loan Balance (LHS)70% 16,000 12,000 080%Avg. Balance: 11,553Avg. WAC: 18.0%Avg. LTV: 100%Avg. Mileage: 76,404Depreciation %Value of Car 24,000Depreciation %Avg. Balance: 16,632Avg. WAC: 16.9%Avg. LTV: 119%Avg. Mileage: 69,605Avg. Cash-Out: 3,735Value of Car 32,0000%0.0 0.5 1.0 1.5 2.0 2.5 3.0 3.5 4.0 4.5 5.0 5.5 6.0 6.5 7.0 7.5 8.0 8.5 9.0 9.5 10.0YearsValue of Car (LHS)New OMF Loan Balance (LHS)Prior Loan Balance (LHS)Depreciation% (RHS)19
Servicing and Loss Mitigation ToolsCustomer Service / Loss MitigationCureDeferral One month payment extensionLoan Servicing KitDescription Addresses short term cash flowissueTarget% of UPB(2)(1)(2) Delinquent loan is made current Short-term modification of loanterms Customer must demonstrateability to resume making full Borrowers must be able topayments consistentlydemonstrate they suffered areduction of income Cannot exceed 1 cure in a 12month rolling period 1 time per life of loan Risk team must clear any 60 days delinquent loan for deferral No more than 2 in rolling 12months Certain payment requirementsmust be met to defer(1)Short-term ModificationDelinquent customersRecovered from TemporaryHardship which causeddelinquency, but now able tomaintain payment Delinquent Customers Requires Risk approval Requires Risk approval0.2%Payment requirements: Interest bearing requires a 50% payment where precomputed loans are calculated per state law gridsRepresent the average monthly utilization of the respective borrower assistance tools from July 15 through May-160.3%0.02%20
CFPB Compliance and RegulationRegulatory Approach1.Licensed in every state we do business2.Voluntarily cap loans at 36%3.No Madden v. Midland riskFair LendingFair ServicingFair ProductsCFPB Consumer Lending Larger Participant Rules June 2015: the CFPB finalized its rules on “larger participant” non-bank auto finance lenders–CFPB has highlighted ability-to-pay OneMain underwrites on a ability-to-pay basis–CFPB has shown sensitivity around rates above 36% OneMain voluntarily caps loans at 36% rate21
Liquidity and FundingDiverse funding sources: Unsecured Debt, Revolving Term ABS, and multi-year revolving Bank ConduitsFunding Diversity(1)Liquidity 0.8B in cash and cash equivalents as of 3/31/2016– Add’l 0.6B cash from Lendmark sale in 2Q16 Forward funding from existing revolving term ABS 4.75B of committed revolving conduit facilitieswith 6 money-center banks (none begin amortizingprior to January 2018)(1)Unsecured Debt MaturitiesFunding Sources Issued 1B 8.25% Senior Notes due Dec. 2020 1.3– Exchanged 600M of 2017s Raised more than 1.5B via three ABS deals in 2016– OMFIT 2016-2 was upsized from 331M to 734M– OMFIT 2016-3 featured a five year revolving period22
3 OneMain Overview OneMain Holdings brings together two leading branch-based personal finance companies Successful Direct Auto business launched in 2014 at Springleaf and in 2016 at legacy OneMain With 1,800 locations and 10,000 team members OneMain serves the financial needs of millions of Americans NYSE listed (OMF) current market cap of 3.4bn(1)