Transcription
Evaluation of large-scale complete vehicle trajectories dataset ontwo kilometers highway segment for one hour duration:Zen Traffic DataToru Seo (The University of Tokyo, the corresponding author, seo@civil.t.u-tokyo.ac.jp)Yusuke Tago (Regional Futures Research Center, tago@refrec.jp)Norihito Shinkai (Regional Futures Research Center, shinkai@refrec.jp)Masakazu Nakanishi (Regional Futures Research Center, nakanishi@refrec.jp)Jun Tanabe (Regional Futures Research Center, tanabe@refrec.jp)Daisuke Ushirogochi (OMRON SOCIAL SOLUTIONS Co.,Ltd, daisuke.ushirogohchi@omron.com)Shota Kanamori (OMRON SOCIAL SOLUTIONS Co.,Ltd, shota.kanamori@omron.com)Atsushi Abe (OMRON SOCIAL SOLUTIONS Co.,Ltd, atsushi.abe@omron.com)Takashi Kodama (Hanshin Expressway Company Limited, takashi-kodama@hanshin-exp.co.jp)Satoshi Yoshimura (Hanshin Expressway Company Limited, satoshi-yoshimura@hanshin-exp.co.jp)Masaaki Ishihara (Hanshin Expressway Company Limited, masaaki-ishihara@hanshin-exp.co.jp)Wataru Nakanishi (Tokyo Institute of Technology, nakanishi@plan.cv.titech.ac.jp)Keywords: Vehicle trajectories, Benchmark dataset, Traffic flow theory, Image recognition1. IntroductionComplete vehicle trajectories datasets are very useful for empirical analysis of traffic flow. NGSIM dataset (U.S.Department of Transportation Federal Highway Administration 2016) would be the most well-known example ofsuch dataset. It includes 6 separate datasets, and each of them contains approximately 600 veh trajectories on 600 mhighway segment for 15 min. NGSIM dataset have been extensively utilized by transportation research communities.For example, roughly 3000 research papers have refer to NGSIM dataset according to Google Scholar(https://scholar.google.co.jp/) as of Dec. 2019. Examples of the applications of the dataset are development andvalidation of macroscopic or microscopic traffic flow models (Laval and Leclercq 2010), accuracy evaluation oftraffic state estimation methods and short-term traffic forecast methods (Seo et al. 2017), development of automatedvehicle control schemes (Yang et al. 2018), to name a few.Complete vehicle trajectories datasets are difficult to collect. This is because traffic flow is a wide-ranging spatialtemporal phenomenon, and it is very challenging to collect continuous data from such wide-ranging domain. Forexample, usual loop detectors only collect data at a specific point. Probe vehicles or connected vehicles are useful tocollect sampled vehicle trajectories data from wide-ranging domain (Herrera et al. 2010), but they are not completebecause of their small penetration rate. In 2005, NGSIM dataset were collected by deploying 7 or 8 synchronizedcameras with image recognition system. However, the spatial-temporal coverage is still limited to 600 m and 15 min.
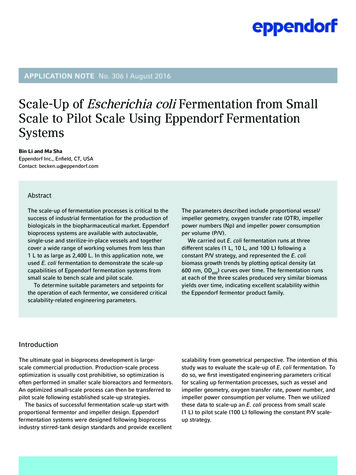
Given the advancement of data collection and image recognition technology, it would be possible to collect furtherlarge-scale datasets.In this paper, we provide an overview of a new, large-scale complete vehicle trajectories dataset, named Zen TrafficData (ZTD), provided by Hanshin Expressway Co. Ltd. in 2018. As of 2019, it includes 5 separate datasets, and eachof them contains approximately 3600 veh trajectories on 2 km highway segment for 1 hour. To our knowledge, thisis currently the most large-scale dataset for this kind. ZTD is available at https://zen-traffic-data.net/english/ with freeof charge. The scope of this paper is to present the methodology used to collect ZTD and basic evaluation results ofZTD from traffic flow theoretical perspectives in order to provide preliminary information for further specificanalyses.2. Methodology2.1. Data collectionThe attributes of trajectories in ZTD are anonymized vehicle ID, time, vehicle type, velocity, lane, longitude, latitude,position (i.e., longitudinal distance, kilopost), vehicle length, and detection flag with 0.1 s interval. The attributes andthe data format are similar to NGSIM data.The current datasets were collected at an urban highway: Ikeda Route, Hanshin Expressway, Osaka, Japan. See Fig.1 for the map of the highway segment. The length of the segment is approximately 2 km. The number of lanes is two.It has a merging section with major on-ramp, two slight curved sections, and a sag section. Due to the merging andsag sections, recurrent congestion was observed. Detailed specifications on this section are included in ZTD. Thedata collection duration was 1 h for one dataset, and ZTD currently has 5 datasets in total. The number of vehicles ineach dataset is approximately from 3200 to 3800.Fig. 1: Data collection site (modified from https://zen-traffic-data.net/english/outline/).
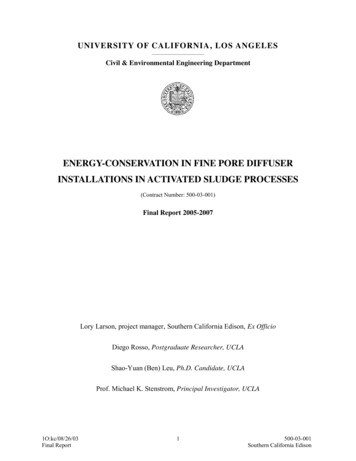
The data collection and extraction process is illustrated in Fig. 2. To collect traffic data, 38 video cameras were placedso that the 2 km section was fully covered. The interval between most of the neighboring cameras were approximately40 m. The cameras were attached to existing poles (for lighting) on the highway and recorded traffic from above-rear.The specification of each camera is as follows: 1280 960 pixels resolution, 10 frames per second, and approximately80 m field of view. The internal timers of cameras were synchronized by Network Time Protocol. One of the notablefeatures of this data collection system is that it is not fixed on infrastructure. They can also be used to collect datafrom other sections.Vehicle trajectories are extracted from the video footages by machine learning. First, it detects vehicles using a deepneural network (c.f, Goodfellow et al. 2016). Properties of vehicles (e.g., length, type, color) are also estimated. Then,trajectories recognized by different cameras are matched, undetected vehicles due to occlusion are interpolated, andnoises are eliminated. During interpolation and elimination processes, the error in the initial detection is corrected.Fig 2. Data collection and extraction process.2.2. Evaluation methodsWe use following methods to evaluate the accuracy of ZTD. First, the vehicle detection accuracy is evaluated usingsmall amount, manually prepared ground truth data. Second, the vehicle tracking accuracy is evaluated by using
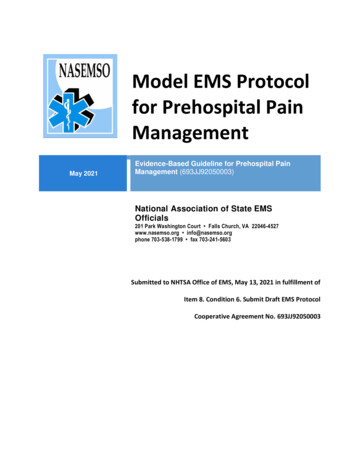
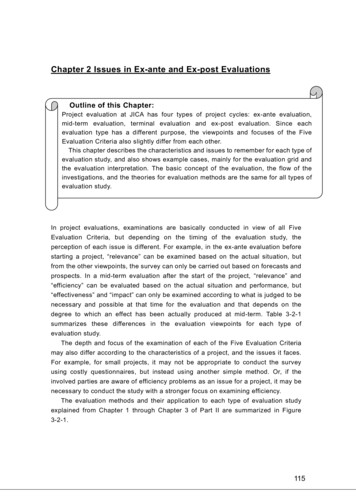
trajectory data collected by a probe vehicle with global positioning system. Third, the macroscopic accuracy isevaluated by using traffic volume measured by a detector.Furthermore, in order to evaluate the macroscopic traffic features of ZTD, we apply Edie's definition of traffic states(Edie 1963) to it. (For microscopic features of ZTD, see Kodama et al. (2019).) Edie's definition is the most suitablemethod to calculate traffic state variables from trajectories data. For these purposes, we developed easy-to-use Pythonimplementations of Edie's definition calculator, a traffic detector simulator, and a probe vehicle simulator. Thesesoftware will be made publicly available.3. ResultsRegarding the vehicle detection accuracy, the recall rate was 96.8%, and the precision rate was 97.1%. It isnoteworthy that the detection performance was almost insensitive to traffic conditions, weather conditions, and timeof day. Regarding the vehicle tracking accuracy compared to a GPS probe vehicle, the root mean square (RMS)difference of positioning was 1.05 m and that of speed measurement was 3.59 km/h. Regarding the macroscopicaccuracy compared to detector data, the RMS difference of 5 min traffic volume was 1.04 veh / 5 min / lane, whereasthe average traffic volume was 101.6 veh / 5 min / lane. In summary, given the accuracy of GPS and the detector, weconclude that overall accuracy of ZTD is satisfactory, but there exist slight synchronization error between differentcameras.Macroscopic traffic dynamics were illustrated as time-space diagrams in Fig. 3. The traffic state variables werederived by Edie's definition for every 30 s and 100 m grid cells. It appears that flow breakdown happened on roughly26500 s at -3600 m location (or perhaps 26300 s at -3200 m), and traffic congestion with series of stop-and-go waveshad emerged. The trajectories near breakdown show that stop-and-go waves were emerged from one of the lanes(outer lane because of merging), whereas the other lane was still free-flowing. The flow-density relation showsnarrow distribution in free-flowing regime and scattered distribution in congested regime. These phenomenagenerally agree with our common knowledge on breakdown.4. ConclusionIn this study, an overview and basic evaluation results on the large-scale complete vehicle trajectories dataset, ZTD,are provided. We confirmed that ZTD contained rich and generally accurate information on traffic flow and wouldbe useful for transportation research.AcknowledgementsWe would like to thank Prof. Masao Kuwahara and Prof. Yasuo Asakura for their advices on this project.
Fig. 3: Macroscopic traffic dynamics of ZTD: flow (upper left), density (upper right), speed (middle left), part oftrajectories (middle right), and flow–density relation (bottom).ReferencesEdie, L. C.: Almond, J. (Ed.) Discussion of traffic stream measurements and definitions, Proceedings of the 2ndInternational Symposium on the Theory of Traffic Flow, 1963, 139-154Goodfellow, I., Bengio, Y., Courville, A.: Deep Learning, MIT Press, 2016Hanshin Exp. Co. Ltd.: Zen Traffic Data, 2018, Accessed 2018-09-03 from https://zen-traffic-data.net/english/Herrera, J. C., Work, D. B., Herring, R., Ban, X. J., Jacobson, Q., Bayen, A. M.: Evaluation of traffic data obtainedvia GPS-enabled mobile phones: The Mobile Century field experiment, Transportation Research Part C:Emerging Technologies, 2010, 18, 568-583
Kodama, T., Ishihara, M., Shinkai, N., Tanabe, J., Nakajo, S.: Evaluation of the impact of a vehicle trajectory ontraffic by utilizing all the vehicle trajectory data observed on an expressway, The 26th ITS World Congress,2019Laval, J. A., Leclercq, L.: A mechanism to describe the formation and propagation of stop-and-go waves in congestedfreeway traffic, Philosophical Transactions of the Royal Society of London A: Mathematical, Physical andEngineering Sciences, 2010, 368, 4519-4541Seo, T., Bayen, A. M., Kusakabe, T., Asakura, Y.: Traffic state estimation on highway: A comprehensive survey,Annual Reviews in Control, 2017, 43, 128-151U.S. Department of Transportation Federal Highway Administration: Next Generation Simulation (NGSIM) VehicleTrajectories and Supporting Data. [Dataset]. Provided by ITS DataHub through Data.transportation.gov., 2016,Accessed 2019-12-06 from http://doi.org/10.21949/1504477Yang, D., Zheng, S., Wen, C., Jin, P. J., Ran, B.: A dynamic lane-changing trajectory planning model for automatedvehicles, Transportation Research Part C: Emerging Technologies, 2018, 95, 228-247
Department of Transportation Federal Highway Administration 2016) would be the most well-known example of such dataset. It includes 6 separate datasets, and each of them contains approximately 600 veh trajectories on 600 m . (Seo et al. 2017), development of automated vehicle control schemes (Yang et al. 2018), to name a few. Complete vehicle .