Transcription
Elastic Reports Strong Third Quarter Fiscal 2022 Financial ResultsQ3 Revenue of 223.9 million, Up 43% year-over-yearQ3 Elastic Cloud Revenue of 80.4 million, Up 79% year-over-yearMOUNTAIN VIEW, Calif., March 3, 2022--(BUSINESS WIRE)-- Elastic (NYSE: ESTC)(“Elastic”), the company behind Elasticsearch and the Elastic Stack, announced strong resultsfor its third quarter of fiscal 2022 (ended January 31, 2022).Third Quarter Fiscal 2022 Financial Highlights Total revenue was 223.9 million, an increase of 43% year-over-year, as reported and ona constant currency basisElastic Cloud revenue was 80.4 million, an increase of 79% year-over-year, or 80% on aconstant currency basisGAAP operating loss was 45.8 million; GAAP operating margin was -20%Non-GAAP operating profit was 0.2 million; non-GAAP operating margin was 0%GAAP net loss per share was 0.61; non-GAAP loss per share was 0.12Operating cash flow was 5.1 million with adjusted free cash flow of 15.8 millionCash and cash equivalents were 864.4 million as of January 31, 2022"We delivered another record quarter and exceeded our revenue expectations, fueled byincreasing consumption trends in Elastic Cloud. Our cloud business grew 79% year-over-yearand now accounts for 36% of total revenue,” said Ash Kulkarni, CEO, Elastic. “I look forward tous executing against the large and growing market opportunity ahead of us, particularly in cloud.I am confident that our demonstrated success, combined with the relevance of our solutions,enables us to capture this sizeable opportunity.”Third Quarter Fiscal 2022 Key Metrics and Recent Business HighlightsKey Customer Metrics Total subscription customer count was over 17,900, compared to over 17,000 in Q2 FY22,and over 13,800 in Q3 FY21 Total customer count with Annual Contract Value (ACV) greater than 100,000 was over890, compared to over 830 in Q2 FY22, and over 670 in Q3 FY21 Net Expansion Rate was slightly above Q2 FY22 and just below 130%Business HighlightsCloud Momentum Delivered a more simplified Elastic Cloud on AWS onboarding and trial experienceand expanded cloud-native AWS integrations which include AWS FireLens, AmazonS3 Storage Lens, the Elastic Serverless Forwarder in the AWS Serverless Application
Repository, Elastic and AWS Web Application Firewall, and the Elastic and AWS NetworkFirewallProduct Innovations Announced Elastic 8.0 with major enhancements to Elasticsearch’s vector searchcapabilities, new native support for modern natural language processing models,increasingly simplified data onboarding, and a streamlined security experience Announced Elastic 7.16 with new features enabling simplified data ingestion into theElastic Search Platform, including dozens of prebuilt Elastic Agent data integrations, andobservability tooling for continuous integration and continuous delivery (CI/CD) pipelinesCommunity Momentum Hosted the second annual Elastic Community Conference with 2,000 globalattendees participating in more than 60 sessionsFinancial OutlookThe Company is providing the following guidance:For the fourth quarter of fiscal 2022 (ending April 30, 2022): Total revenue is expected to be between 230 million and 232 millionNon-GAAP operating margin is expected to be between -5.5% and -4.5%Non-GAAP net loss per share is expected to be between 0.24 and 0.20, assumingbetween 93.1 million and 94.1 million weighted average ordinary shares outstandingFor fiscal 2022 (ending April 30, 2022): Total revenue is expected to be between 853 million and 855 millionNon-GAAP operating margin is expected to be between -0.4% and -0.2%Non-GAAP net loss per share is expected to be between 0.42 and 0.38, assumingbetween 92.0 million and 93.0 million weighted average ordinary shares outstandingSee the section titled “Forward-Looking Statements” below for information on the factors thatcould cause our actual results to differ materially. A reconciliation of non-GAAP guidancemeasures to corresponding GAAP measures is not available on a forward-looking basis withoutunreasonable effort due to the uncertainty regarding, and the potential variability of, many of thecosts and expenses that may be incurred in the future. These items necessary to reconcile suchnon-GAAP measures could be material and have a significant impact on the Company’s resultscomputed in accordance with GAAP.
Conference Call and WebcastElastic’s executive management team will host a conference call today at 2:00 p.m. PT/5:00 p.m.ET to discuss the Company’s financial results and business outlook. A live audio webcast of theconference call will be available through Elastic’s Investor Relations website at ir.elastic.co.Slides will accompany the webcast. The replay of the webcast and slides will be available for twomonths.About ElasticElastic is a search company built on a free and open heritage. Anyone can use Elastic productsand solutions to get started quickly and frictionlessly. Elastic offers three solutions for enterprisesearch, observability, and security, built on one technology stack that can be deployedanywhere. From finding documents to monitoring infrastructure to hunting for threats, Elasticmakes data usable in real time and at scale. Founded in 2012, Elastic is a distributed companywith Elasticians around the globe. Learn more at elastic.co.Elastic and associated marks are trademarks or registered trademarks of Elastic N.V. and itssubsidiaries. All other company and product names may be trademarks of their respectiveowners.Use of Non-GAAP Financial MeasuresReconciliations of non-GAAP financial measures to Elastic’s financial results as determined inaccordance with U.S. GAAP are included at the end of this press release following theaccompanying financial data. For a description of these non-GAAP financial measures, includingthe reasons management uses each measure, please see the section of this press release titled“About Non-GAAP Financial Measures.”Forward-Looking StatementsThis press release contains forward-looking statements that involve substantial risk anduncertainties, which include, but are not limited to, statements regarding our expected financialresults for the fiscal quarter and the fiscal year ending April 30, 2022, our expectations regardingdemand for our products and solutions and our future revenue, our assessments of the strengthof our solutions and products, the expected performance or benefits of our offerings, ourexpectations regarding market and growth opportunities and our ability to address thoseopportunities, our expectations regarding the growth and adoption of our Elastic Cloud offering,and the expected benefits of our investments. These forward-looking statements are subject tothe safe harbor provisions under the Private Securities Litigation Reform Act of 1995. Ourexpectations and beliefs in light of currently available information regarding these matters may
not materialize. Actual outcomes and results may differ materially from those contemplated bythese forward-looking statements due to uncertainties, risks, and changes in circumstances,including but not limited to those related to: our future financial performance, including ourexpectations regarding our revenue, cost of revenue, gross profit or gross margin, operatingexpenses (which include changes in sales and marketing, research and development andgeneral and administrative expenses), and our ability to achieve and maintain future profitability;our ability to continue to deliver and improve our offerings and develop new offerings, includingsecurity-related product and Elastic Cloud offerings; customer acceptance and purchase of ourexisting offerings and new offerings, including the expansion and adoption of our Elastic Cloudofferings; our inability to realize value from investments in the business, including R&Dinvestments and strategic transactions; our ability to maintain and expand our user andcustomer base; the impact of the COVID-19 pandemic, including any variants, on themacroeconomic environment, on our business, operations, hiring and financial results, and onbusinesses of our customers and partners, including their spending priorities, the effect oflockdowns, restrictions and new regulations; the impact of our licensing model on the use andadoption of our software; the impact of foreign currency exchange rate and interest ratefluctuations on our results; our international expansion strategy; our operating results and cashflows; our beliefs and objectives for future operations; the sufficiency of our capital resources;our ability to successfully execute our go-to-market strategy, including by expanding ourrelationships with our partners, and expand in our existing markets and into new markets, andour ability to forecast customer retention and expansion; and general market, political, economicand business conditions.Any additional or unforeseen effect from the COVID-19 pandemic may exacerbate these risks.Additional risks and uncertainties that could cause actual outcomes and results to differmaterially are included in our filings with the Securities and Exchange Commission (the “SEC”),including our Annual Report on Form 10-K for the fiscal year ended April 30, 2021 and anysubsequent reports filed with the SEC. SEC filings are available on the Investor Relationssection of Elastic’s website at ir.elastic.co and the SEC’s website at www.sec.gov. Elasticassumes no obligation to, and does not currently intend to, update any such forward-lookingstatements, except as required by law.Contact InformationJanice OhElastic Investor Relationsir@elastic.coLisa BoughnerElastic Corporate Communicationslisa.boughner@elastic.co
Elastic N.V.CONDENSED CONSOLIDATED STATEMENTS OF OPERATIONS(amounts in thousands, except share and per share amounts)(Unaudited)Three Months Ended January 31,20222021RevenueLicense - self-managed Subscription - self-managed and SaaSTotal subscription revenueProfessional servicesTotal revenueCost of revenueCost of license - self-managedCost of subscription - self-managed and SaaSTotal cost of revenue - subscriptionCost of professional servicesTotal cost of revenueGross profitOperating expensesResearch and developmentSales and marketingGeneral and administrativeTotal operating expensesOperating lossOther income (expense), netInterest expenseOther income (expense), netLoss before income taxesProvision for income taxesNet loss Net loss per share attributable to ordinary shareholders, basic and dilutedWeighted-average shares used to compute net lossper share attributable to ordinary shareholders,basic and diluted20,119189,495209,61414,330223,944 15,280131,969147,2499,866157,115Nine Months Ended January 31,20222021 54,457522,599577,05645,963623,019 408,033(92,401)(6,175)(861)(52,885)3,841(56,726) (65)(2,312)(36,838)1,136(37,974) (14,327)(509)(128,894)9,344(138,238) (78)8,502(83,977)2,156(86,133)(0.61) (0.43) (1.50) (1.00)93,015,18588,341,03892,140,91986,296,028
Elastic N.V.CONDENSED CONSOLIDATED BALANCE SHEETS(amounts in thousands, except share and per share amounts)(Unaudited)AssetsCurrent assets:Cash and cash equivalentsRestricted cashAccounts receivable, net of allowance for credit losses of 2,729 and 2,344 asof January 31, 2022 and April 30, 2021, respectivelyDeferred contract acquisition costsPrepaid expenses and other current assetsTotal current assetsProperty and equipment, netGoodwillOperating lease right-of-use assetsIntangible assets, netDeferred contract acquisition costs, non-currentDeferred tax assetsOther assetsTotal assetsLiabilities and Shareholders’ EquityCurrent liabilities:Accounts payableAccrued expenses and other liabilitiesAccrued compensation and benefitsOperating lease liabilitiesDeferred revenueTotal current liabilitiesDeferred revenue, non-currentLong-term debt, netOperating lease liabilities, non-currentOther liabilities, non-currentTotal liabilitiesCommitments and contingenciesShareholders’ equity:Convertible preference shares, 0.01 par value; 165,000,000 shares authorized, 0shares issued and outstanding as of January 31, 2022 and April 30, 2021Ordinary shares, par value 0.01 per share: 165,000,000 shares authorized;93,420,927 and 90,533,985 shares issued and outstanding as of January 31, 2022and April 30, 2021, respectivelyTreasury stockAdditional paid-in capitalAccumulated other comprehensive lossAccumulated deficitTotal shareholders’ equityTotal liabilities and shareholders’ equityAs ofJanuary 31, 2022 864,3633,928As ofApril 30, 2021 7114,87921,0891,126,987 —982 1,559,296 50,831973,172
Elastic N.V.CONDENSED CONSOLIDATED STATEMENTS OF CASH FLOWS(amounts in thousands)(Unaudited)Three Months Ended January 31,2022Cash flows from operating activitiesNet lossAdjustments to reconcile net loss to cash provided by operatingactivities:Depreciation and amortizationAmortization of deferred contract acquisition costsAmortization of debt issuance costsNon-cash operating lease costStock-based compensation expense, net of amounts capitalizedDeferred income taxesForeign currency transaction (gain) lossOtherChanges in operating assets and liabilities:Accounts receivable, netDeferred contract acquisition costsPrepaid expenses and other current assetsOther assetsAccounts payableAccrued expenses and other liabilitiesAccrued compensation and benefitsOperating lease liabilitiesDeferred revenue Net cash provided by operating activitiesCash flows from investing activitiesPurchases of property and equipmentCapitalization of internal-use software costsBusiness acquisitions, net of cash acquiredOtherNet cash used in investing activitiesCash flows from financing activitiesProceeds from the issuance of senior notesProceeds from issuance of ordinary shares upon exercise ofstock optionsPayments of debt issuance costsNet cash provided by financing activitiesEffect of exchange rate changes on cash, cash equivalents, andrestricted cashNet increase (decrease) in cash, cash equivalents, and restrictedcashCash, cash equivalents, and restricted cash, beginning of periodCash, cash equivalents, and restricted cash, end of period Nine Months Ended January 31,2021(56,726) 2022(37,974) 2021(138,238) 1 351,311395,489 403,708868,291 299,389395,489
Elastic N.V.REVENUE BY TYPE(amounts in thousands, except percentages)(Unaudited)Three Months Ended January 31,2022AmountElastic Cloud 80,402Nine Months Ended January 31,2021% ofTotalAmountRevenue36 % 44,9292022% ofTotalAmountRevenue29 % 210,9632021% ofTotalAmountRevenue34 % 114,984% ofTotalRevenue27 %Other subscription129,21258 %102,32065 %366,09359 %287,81666 %Total subscription revenue209,61494 %147,24994 %577,05693 %402,80093 %14,3306%9,8666%45,9637%28,0797%100 % 430,879100 %Professional servicesTotal revenue 223,944100 % 157,115100 % 623,019
Elastic N.V.RECONCILIATION OF GAAP TO NON-GAAP DATACALCULATED BILLINGS(amounts in thousands)(Unaudited)Three Months Ended January 31,2022Total revenueAdd: Increase in deferred revenueLess: Increase in unbilled accounts receivableCalculated billings 223,944 11,768(2,711)233,001 2021157,115 18,877(2,790)173,202 Nine Months Ended January 31,2022623,019 8,306(2,102)629,223 2021430,87953,309(3,214)480,974
Elastic N.V.RECONCILIATION OF GAAP TO NON-GAAP DATAADJUSTED FREE CASH FLOW(amounts in thousands, except percentages)(Unaudited)Three Months Ended January 31,2022Net cash provided by operating activitiesLess: Purchases of property and equipmentLess: Capitalization of internal-use softwareAdd: Interest paid on long-term debtAdjusted free cash flowNet cash used in investing activitiesNet cash provided by financing activitiesNet cash provided by operating activities (as a percentage oftotal revenue)Less: Purchases of property and equipment (as apercentage of total revenue)Less: Capitalization of internal-use software (as apercentage of total revenue)Add: Interest paid on long-term debt (as a percentage oftotal revenue)Adjusted free cash flow margin Nine Months Ended January 31,20215,054(236)(1,514)12,45215,756(13,500)6,660 202219,401(1,076)——18,325(1,076)22,2342021 8,722(987)(4,227)12,452 15,960 (125,068) 593,257 24,110(2,732)——21,378(1,412)67,5542%13 %12 %3%5%
Elastic N.V.RECONCILIATION OF GAAP TO NON-GAAP DATA(amounts in thousands, except percentages, share and per share amounts)(Unaudited)Gross Profit Reconciliation:GAAP gross profitStock-based compensation expenseEmployer payroll taxes on employee stock transactionsAmortization of acquired intangiblesNon-GAAP gross profitGross Margin Reconciliation(1):GAAP gross marginStock-based compensation expenseEmployer payroll taxes on employee stock transactionsAmortization of acquired intangiblesNon-GAAP gross marginOperating Loss Reconciliation:GAAP operating lossStock-based compensation expenseEmployer payroll taxes on employee stock transactionsAmortization of acquired intangiblesAcquisition-related expensesNon-GAAP operating income (loss)Operating Margin Reconciliation(1):GAAP operating marginStock-based compensation expenseEmployer payroll taxes on employee stock transactionsAmortization of acquired intangiblesAcquisition-related expensesNon-GAAP operating marginNet Loss Reconciliation:GAAP net lossStock-based compensation expenseEmployer payroll taxes on employee stock transactionsAmortization of acquired intangiblesAcquisition-related expensesIncome tax(2)Non-GAAP net lossNon-GAAP net loss per share attributable to ordinaryshareholders, basic and dilutedWeighted-average shares used to compute net loss per shareattributable to ordinary shareholders, basic and dilutedThree Months Ended January 31,20222021Nine Months Ended January 31,20222021 162,6603,7902603,046169,75672.61.70.11.475.8 77.0 (20.5)%16.7 %0.7 %1.9 %1.2 %0.1 % %%%%%(34,461)25,2275,6853,538—(11) (0.12) %%%%%(114,058)97,5538,63411,6444,9998,772 (0.04) .2 %2.4 %2.5 %0.0 %(1.4)% (138,238)97,5538,63411,6444,999(679)(16,087) (0.17) 76.9(18.3)%15.7 %1.4 %1.9 %0.8 %1.4 .9)%16.1 %3.6 %2.3 %0.0 %0.0 185115,1473,1985892,110121,044 28(1)Totals may not sum, due to rounding. Gross margin, operating margin, and earnings per share are calculated based upon the respectiveunderlying, non-rounded data.(2)Non-GAAP financial information for the quarter is adjusted for a tax rate equal to our annual estimated tax rate on non-GAAP income. This rateis based on our estimated annual GAAP income tax rate forecast, adjusted to account for items excluded from GAAP income in calculating thenon-GAAP financial measures presented above as well as significant tax adjustments. Our estimated tax rate on non-GAAP income isdetermined annually and may be adjusted during the year to take into account events or trends that we believe materially impact the estimatedannual rate including, but not limited to, significant changes resulting from tax legislation, material changes in the geographic mix of revenue andexpenses and other significant events. Due to the differences in the tax treatment of items excluded from non-GAAP earnings, as well as themethodology applied to our estimated annual tax rates as described above, our estimated tax rate on non-GAAP income may differ from ourGAAP tax rate and from our actual tax liabilities.
Elastic N.V.RECONCILIATION OF GAAP TO NON-GAAP DATA(amounts in thousands)(Unaudited)Cost of revenue reconciliation:GAAP cost of license - self-managedAmortization of acquired intangiblesNon-GAAP cost of license - self -managedGAAP cost of subscription - self-managed and SaaSStock-based compensation expenseEmployer payroll taxes on employee stock transactionsAmortization of acquired intangiblesNon-GAAP cost of subscription - self-managed and SaaSGAAP cost of professional servicesStock-based compensation expenseEmployer payroll taxes on employee stock transactionsNon-GAAP cost of professional servicesOperating expenses reconciliation:GAAP research and development expenseStock-based compensation expenseEmployer payroll taxes on employee stock transactionsAcquisition-related expensesNon-GAAP research and development expenseGAAP sales and marketing expenseStock-based compensation expenseEmployer payroll taxes on employee stock transactionsAmortization of acquired intangiblesNon-GAAP sales and marketing expensesGAAP general and administrative expenseStock-based compensation expenseEmployer payroll taxes on employee stock transactionsAcquisition-related expensesNon-GAAP general and administrative expenseThree Months Ended January 31,20222021Nine Months Ended January 31,20222021 ,359)(322)8,515 1,428)59,56427,121(4,141)(2,130)—20,850 ,726)(113)11,868 2)(1,231)90,78131,691(5,029)(208)(18)26,436 ,491(4,593)(591)32,307 ,099 5)(3,329)—59,101
About Non-GAAP Financial MeasuresIn addition to our results determined in accordance with U.S. GAAP, we believe the non-GAAPmeasures listed below are useful in evaluating our operating performance. We use these nonGAAP financial measures to evaluate our ongoing operations and for internal planning andforecasting purposes. We believe that non-GAAP financial information, when taken collectively,may be helpful to investors because it provides consistency and comparability with past financialperformance. However, non-GAAP financial information is presented for supplementalinformational purposes only, has limitations as an analytical tool and should not be considered inisolation or as a substitute for financial information presented in accordance with U.S. GAAP. Inparticular, free cash flow is not a substitute for cash used in operating activities. Additionally, theutility of free cash flow as a measure of our liquidity is further limited as it does not represent thetotal increase or decrease in our cash balance for a given period. In addition, other companies,including companies in our industry, may calculate similarly-titled non-GAAP measuresdifferently or may use other measures to evaluate their performance, all of which could reducethe usefulness of our non-GAAP financial measures as tools for comparison. A reconciliation ofour historical non-GAAP financial measures to their most directly comparable financial measurestated in accordance with U.S. GAAP has been provided in the financial statement tablesincluded in this press release. Investors are cautioned that there are a number of limitationsassociated with the use of non-GAAP financial measures and key metrics as analytical tools.Investors are encouraged to review these reconciliations, and not to rely on any single financialmeasure to evaluate our business.Non-GAAP Gross Profit and Non-GAAP Gross MarginWe define non-GAAP gross profit and non-GAAP gross margin as GAAP gross profit and GAAPgross margin, respectively, excluding stock-based compensation expense, employer payrolltaxes on employee stock transactions, and amortization of acquired intangible assets. Webelieve non-GAAP gross profit and non-GAAP gross margin provide our management andinvestors consistency and comparability with our past financial performance and facilitate periodto-period comparisons of operations, as these metrics generally eliminate the effects of certainvariables from period to period for reasons unrelated to overall operating performance.Non-GAAP Operating Income (Loss) and Non-GAAP Operating MarginWe define non-GAAP operating income (loss) and non-GAAP operating margin as GAAPoperating loss and GAAP operating margin, respectively, excluding stock-based compensationexpense, employer payroll taxes on employee stock transactions, amortization of acquiredintangible assets, and acquisition-related expenses. We believe non-GAAP operating income(loss) and non-GAAP operating margin provide our management and investors consistency andcomparability with our past financial performance and facilitate period-to-period comparisons ofoperations, as these metrics generally eliminate the effects of certain variables from period toperiod for reasons unrelated to overall operating performance.Non-GAAP Net Earnings (Loss) Per Share
We define non-GAAP net earnings (loss) per share as GAAP net loss per share, excludingstock-based compensation expense, employer payroll taxes on employee stock transactions,amortization of acquired intangible assets, acquisition-related expenses and the tax effectsrelated to the foregoing. We believe non-GAAP net earnings (loss) per share provides ourmanagement and investors consistency and comparability with our past financial performanceand facilitates period-to-period comparisons of operations, as this metric generally eliminates theeffects of certain variables from period to period for reasons unrelated to overall operatingperformance.Adjusted Free Cash Flow and Adjusted Free Cash Flow MarginAdjusted free cash flow is a non-GAAP financial measure that we define as net cash provided by(used in) operating activities adjusted for cash paid for interest less cash used for investingactivities for purchases of property and equipment, and capitalized internal-use software costs.Adjusted free cash flow margin is calculated as adjusted free cash flow divided by total revenue.Adjusted free cash flow does not represent residual cash flow available for discretionaryexpenditures since, among other things, we have mandatory debt service requirements.Calculated BillingsWe define calculated billings as total revenue plus the increase (decrease) in total deferredrevenue as presented on or derived from our consolidated statements of cash flows less the(increase) decrease in total unbilled accounts receivable in a given period. Calculated billingsexclude deferred revenue and unbilled accounts receivable acquired through acquisitions in theperiod of acquisition. We typically invoice our customers annually in advance, and to a lesserextent multi-year in advance, quarterly in advance, monthly in advance, monthly in arrears orupon delivery. Our management uses calculated billings to understand and evaluate our nearterm cash flows and operating results.Constant CurrencyWe compare the percent change in certain results from one period to another period usingconstant currency information to provide a framework for assessing how our business performedexcluding the effect of foreign currency rate fluctuations. In presenting this information, currentand comparative prior period results are converted into United States dollars at the exchangerates in effect on the last day of our prior fiscal year, rather than the actual exchange rates ineffect during the respective periods.
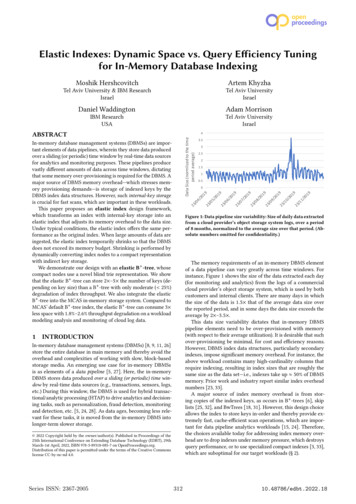
Q3 Elastic Cloud Revenue of 80.4 million, Up 79% year-over-year MOUNTAIN VIEW, Calif., March 3, 2022--(BUSINESS WIRE)-- Elastic (NYSE: ESTC) . S3 Storage Lens, the Elastic Serverless Forwarder in the AWS Serverless Application . Repository, Elastic and AWS Web Application Firewall, and the Elastic and AWS Network