Transcription
Attendance and Chronic Absenteeism:Literature ReviewOctober 2018Prepared by:Amber Humm Patnode, PhDKim Gibbons, PhDRebecca Edmunds, MA
Research, Development and Engagement to Improve EducationHow to Cite this ReportHumm Patnode, A., Gibbons, K., & Edmunds, R. R. (2018). Attendance and ChronicAbsenteeism: Literature Review. Saint Paul, MN: University of Minnesota, College ofEducation and Human Development, Center for Applied Research and EducationalImprovement.Contact InformationAmber Humm Patnode, Associate Director of Innovation and OutreachCenter for Applied Research and Educational ImprovementCollege of Education and Human DevelopmentUniversity of Minnesota1954 Buford Avenue, Suite 425Saint Paul, MN 55108Telephone: 612-626-1191Email: ahummpat@umn.eduwww.cehd.umn.edu/CAREI/Center for Applied Research and Educational Improvement, University of Minnesotai
Table of ContentsIntroduction . 1Defining Chronic Absenteeism . 2Prevalence Rates for Student Subgroups . 3Prevalence Rates by Grade Level . 4Associated Outcomes. 6Root Causes . 7Barriers. 7Aversion . 10Disengagement . 12Prevention and Intervention . 13Prevention . 14Intervention . 17Health . 17Transportation . 20Family – School Connections . 21Student – School Connections. 23Other . 29Conclusion . 31References . 32Center for Applied Research and Educational Improvement, University of Minnesotaii
Attendance and Chronic AbsenteeismLiterature ReviewIntroductionA basic assumption of the education system is that students regularly attend school.Students must be present and engaged to learn. However, recent research has called thisassumption into question (Chang, Bauer, & Byrnes, 2018). While there has been a long historyof examining certain types of absences or truancy, chronic absenteeism in schools was notconsistently measured until recently (U.S. Department of Education, 2016a). Thereauthorization of federal education law with the Every Student Succeeds Act (ESSA) in 2015prompted state level focus on student attendance as a robust metric of school quality/studentsuccess (SQSS; Jordan & Miller, 2017). In addition, ESSA requires states to report how manystudents are chronically absent on their school report card. During the 2015-2016 school year,the most recent national data available, the U.S. Department of Education Civil Rights DataCollection (CRDC) found that nearly 8 million students were chronically absent, defined asmissing 15 or more school days during the year (Chang, Bauer, & Byrnes, 2018).Chronic absenteeism significantly impacts a variety of student outcomes includingmathematics and reading achievement, social-emotional development, grade retention anddropout, and student discipline (e.g. Balfanz & Byrnes, 2018; Gottfried, 2017). Chronicabsenteeism is associated with risky behaviors such as substance use (e.g. Henry & Huizinga,2007; Kearney, 2008). Students with excessive absenteeism are also at increased risk for schooldropout which is further associated with economic, social, and health problems in adulthood(e.g. Cutler & Lleras-Muney, 2006; Jordan & Miller, 2017; Kearney, 2008; Sheldon & Epstein,2004). In addition to the individual effects of absenteeism, research has found that classroomsCenter for Applied Research and Educational Improvement, University of Minnesota1
with high rates of absenteeism have spillover effects with lower test scores observed for allstudents in the classroom, even the students with good attendance (Gottfried, 2015b).The root causes of chronic absenteeism are often multifaceted and unique to eachstudent, but adequately addressing absenteeism requires an understanding of these causes(Chang et al., 2018). Root causes can be categorized as barriers, aversion, and disengagementreasons based on the level at which they impact the student’s attendance. Barriers such ashealth problems suffered by the student or family members, transportation, housing instability,and suspension all prevent the student from attending school (e.g. Chang et al., 2018; Hofferth,Reid, & Mott, 2001; Kearney, 2008). In contrast, factors which fall in the aversion categorycause students to feel unsafe or unwelcome at school (e.g. Balfanz & Byrnes, 2012; Chang et al.,2018). Finally, with disengagement, students miss school due to factors related to a lack ofperceived value or motivation for attending (e.g. Chang et al., 2018; Sheldon & Epstein, 2004).By identifying the underlying causes of chronic absenteeism, schools can be more effective andefficient in providing resources and services which will improve the attendance for individualstudents.Defining Chronic AbsenteeismMany states and reporting agencies are now defining chronic absenteeism as missing10% or more school days for any reason (U.S. Departments of Education, Health and HumanServices, Housing and Urban Development, and Justice, 2015). Absenteeism refers to missedinstructional days that are excused, unexcused, or the result of disciplinary removal from school(Jordan & Miller, 2017). Under ESSA (2015) guidelines, states are allowed to set their owncriteria for chronic absenteeism. In Minnesota, the Minnesota Department of Education (MDE)has identified consistent attendance as a school quality indicator within the ESSA plan which isdefined as attending more than 90% of school days (MDE, 2018a).For both chronic absenteeism and consistent attendance, all absences: excused,unexcused, and suspensions are counted. In Minnesota, state statue identifies legitimateexemptions from school. These excused absences are a critical difference between chronicabsenteeism and truancy as time missed for legitimate absence is not included in truancycounts. However, excused absences are counted for calculations of chronic absenteeism.Center for Applied Research and Educational Improvement, University of Minnesota2
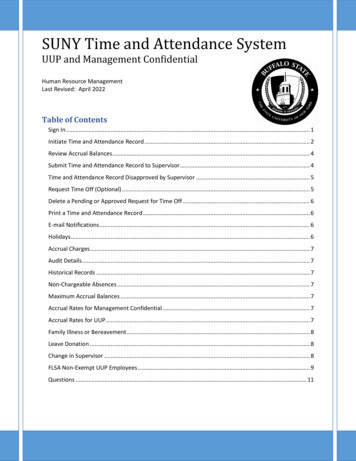
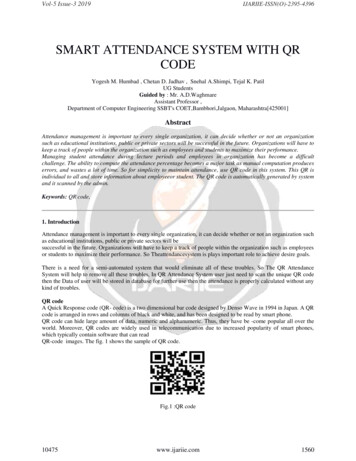
Chronic absenteeism focuses on the impact of missing school on students’ academic and socialdevelopment; truancy focuses on legal compliance (Chang et al., 2018). The shift from truancyto chronic absenteeism is crucial because high rates of absenteeism, even when excused, areassociated with negative academic outcomes (e.g. Chang et al., 2018; Cortiella, & Boundy,2018).Prevalence Rates for Student SubgroupsThe most recent nationwide data on absenteeism was collected for the 2015-2016school year and found that nearly 8 million students (16%) were chronically absent, defined asmissing 15 days of school (Chang et al., 2018). Since MDE began gathering data on chronicabsenteeism in 2011, consistently 12-13% of students in grades 1-12 have been absent formore than 10% of school days (MDE, 2018b).Disparities in absenteeism rates are observed by racial and ethnic background, income,and special education status. As demonstrated in Figure 1, nationally, 20% or more of Black,Hispanic, and American Indian students experience chronic absenteeism in comparison to only8% of Asian students (The Hamilton Project, 2018). In addition, 20% of students with disabilitiesexperienced chronic absenteeism (The Hamilton Project, 2018). English language learners areless likely to be absent than their peers and no significant differences were found by gender(U.S. Department of Education, 2016a).Similar patterns are identified in Minnesota (Figure 1). In 2016, 38% of AmericanIndian/Alaska Native, 19% of Black, 16% of Hispanic, and 16% of students identifying two ormore races experienced chronic absenteeism as compared to only 7% of Asian students (MDE,2018b). Within each racial or ethnic category, rates of chronic absenteeism were consistentacross years. The largest change occurred for American Indian/Alaskan Native students withrates of chronic absenteeism steadily rising from 34% in 2011 to 38% in 2016. By income, 20%of Minnesota students with a family income in the range of 0-185% of the federal poverty lineexperienced chronic absenteeism as compared to 8% of students with higher family income(MDE, 2018b). In 2016, 20% of students receiving special education services were chronicallyabsent, in comparison to 11% of students not receiving special education (MDE, 2018b).Differences were not found between English learners and non-English learners.Center for Applied Research and Educational Improvement, University of Minnesota3
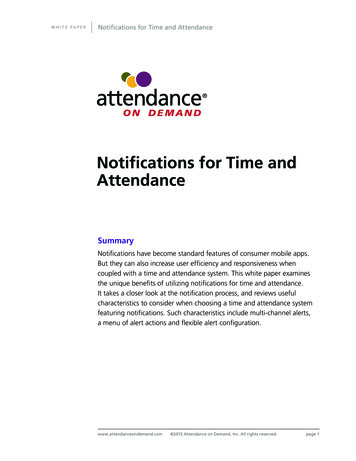
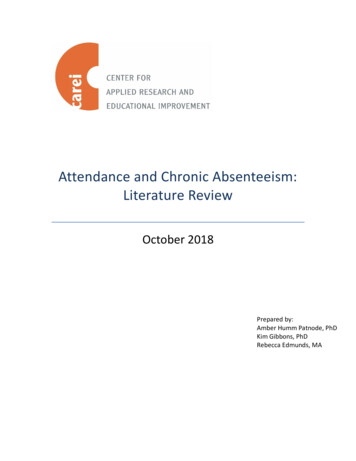
Chronic Absenteeism by Race/Ethnicity384035302520151020 AsianAmericanIndian orAlaska NativeNativeHawaiian orOther PacificTwo or moreracesMinnesotaFigure 1: Rates of chronic absenteeism nationally and in Minnesota. National data reflects thepercent of students missing 15 or more days in the 2015-2016 school year. Minnesota datareflects the percent of students absent 10% or more days in 2016.Analyses of national data sets have found that chronic absenteeism is similar acrossgenders and in both urban and rural schools (Balfanz & Byrnes, 2012). However, the economicstatus of the community is related to rates of absenteeism. Schools in which a majority ofstudents (75% or more) live in poverty are more likely to experience high levels of chronicabsenteeism (Chang et al., 2018). Chronic absenteeism is clearly a national issue that cutsacross urbanicity and demographic groups.Prevalence Rates by Grade LevelFor the 2015-16 school year, the CRDC data indicates chronically absent rates increaseas students progress through school with elementary, middle, and high school students absentat rates of 13%, 14%, and 21% respectively (The Hamilton Project, 2018). This pattern, withspikes of chronic absenteeism observed in high school, was consistent across racial and ethniccategories. Data from Minnesota in 2016, also showed lower absenteeism rates in grades 1-6(6-8%) with the lowest rates of chronic absenteeism in third and fourth grades (Figure 2). Thenabsenteeism increases from seventh grade (10%) through high school. Chronic absenteeismrates spiked for students in grade 11 (20%) and grade 12 (28%).Center for Applied Research and Educational Improvement, University of Minnesota4
While Minnesota does not report attendance rates for students in pre-kindergarten(pre-k) programs, national data sets have identified particularly high rates of chronicabsenteeism in pre-k ranging from 20-45% of students (e.g. Connolly & Olson, 2012; Dubay &Holla, 2016; Ehrlich, Gwynne, & Allensworth, 2018). Patterns of attendance by grade weresimilar across racial and ethnic groups in Minnesota and nationally. However, in Minnesota,American Indian and Black students had higher rates of chronically absenteeism in grade 1 thanin grades 2-5. This same trend was not observed with for students in other racial/ethnic groups(MDE, 2018b).Chronic Absenteeism in MN by Grade302825202016151010876671112850Grade 1 Grade 2 Grade 3 Grade 4 Grade 5 Grade 6 Grade 7 Grade 8 Grade 9 Grade 10Grade 11Grade 12Figure 2: Rates of chronic absenteeism in Minnesota by grade. Minnesota data reflects thepercent of students absent 10% or more days in 2016.Distinct patterns emerge from local and national data with high rates of absenteeism inpre-k and kindergarten, stabilization in late elementary school, and then increasing ratesthrough middle school and high school (Bauer, Liu, Schanzenbach, & Shambaugh, 2018; MDE,2018b). These trends imply that families have an adjustment period in early elementary school,especially kindergarten, in which students are more frequently absent. After that initialadjustment, attendance appears to improve through elementary school until new factors areintroduced which increase absenteeism in later grades (Balfanz & Byrnes, 2012). AdditionalCenter for Applied Research and Educational Improvement, University of Minnesota5
adjustment periods are evident at the transitions to middle school and high school as both areassociated with increased absenteeism (e.g. Balfanz, Herzog, & Mac Iver, 2007).Associated OutcomesChronic absenteeism has been linked to multiple negative academic and socialoutcomes (Balfanz & Byrnes, 2018). Poor attendance is one of the best predictors of laterschool drop-out. Recent research indicates that chronic absenteeism is a better predictor ofdrop-out than low grades or test scores (Gottfried, 2014). Ninth grade attendance predictedhigh school graduation in Chicago with a 90% success rate, and students with extreme chronicabsenteeism in high school (missing one month or more of school per semester) were found tohave less than a 10% chance of graduating (Allensworth & Easton, 2007).The impacts of chronic absenteeism start even before high school. Chronic absenteeismin kindergarten has been linked to lower academic and social-emotional outcomes in the sameyear (Gottfried, 2015b). Additionally, one longitudinal study found that only 17% of childrenchronically absent in kindergarten and first grade achieved reading proficiency by the end ofthird grade (Applied Survey Research, 2011). Research on upper elementary grades indicatethat students who were chronically absent in fourth through sixth grades are less likely tograduate (Smerillo, Reynolds, Temple, & Ou, 2018). In addition, falling behind academically inearly grades is also a predictor of dropping out of high school. For example, students who areproficient readers at the end of third grade are four times more likely to graduate high schoolthan students who have not achieved proficiency (Hernandez, 2012). Lower rates of attendanceare also associated with higher rates of grade retention, disengagement, and alienation inschool (Gottfried, 2014). Lifelong consequences have been identified with frequentabsenteeism linked to substance use, future unemployment, and a variety of health relatedissues (e.g. Alexander, Entwisle, & Horsey, 1997; Connolly & Olson, 2012; Cutler & LlerasMuney, 2006).Especially concerning are indications that the negative effects of absenteeism arecompounded for students from low socioecomonic (SES) backgrounds (Gottfried, 2014). Thismay be because these students face additional barriers that prevent them from accessing theextra services needed to compensate for the lost school time (Gottfried, 2014). In this way,Center for Applied Research and Educational Improvement, University of Minnesota6
absenteeism may both have root causes associated with poverty and contribute to academicand social outcomes which lead to lower economic opportunity in the future.Poor attendance also has negative impacts on the learning environment within theschool (Balfanz & Byrnes, 2018). When students miss instructional time due to absences,remediation is required when they return. Additionally, students who are frequently absentreport alienation from their peers and teachers and demonstrate more social disengagement(Gottfried, 2015b). Indeed, if a classroom has a high proportion of chronically absent students,lower reading and math scores are observed even for the students with good attendance(Gottfried, 2015).Root CausesChronic absenteeism may involve any combination of child-, family-, peer-, school-, andcommunity-based factors (Kearney, 2008). Understanding which factors are contributing tostudent absences can facilitate the identification and implementation of the appropriatesupports and intervention strategies (Chang et al., 2018). Three categories are used to addressthe manner in which these factors impact attendance: barriers, aversion, and disengagement.BarriersBarriers consist of factors which prevent a student from attending school and includehealth conditions, inconsistent or unreliable transportation, suspension, housing instability, andinvolvement with child welfare or the juvenile justice system (e.g. Chang et al., 2018; Hofferthet al., 2001; Kearney, 2008; Zhang, 2003). Students may face one or more barriers toattendance and some, such as housing instability and transportation, may be closely related.Physical health. Multiple surveys of chronically absent students have identified healthconcerns including short-term illness, chronic illness, and medical/dental/mental healthappointments as the most frequently cited reason for missing school (e.g. Erbstein,Olagundoye, & Hartzog, 2015; Humm Brundage, Castillo & Batsche, 2017). These self-reportsare supported by research that physical, mental, and social health are directly related to schoolattendance (e.g. Cutler & Lleras-Muney, 2006; Robert Wood Johnson Foundation, 2016).Any teacher can attest that annual colds, flu, and other common childhood ailmentscontribute to absenteeism. While these short-term, contagious illnesses are a common causesCenter for Applied Research and Educational Improvement, University of Minnesota7
of overall absences (Wiseman & Dawson, 2015), they are not a primary cause of chronicabsenteeism (Balfanz & Byrnes, 2012). Students with chronic health concerns, such as asthma,miss more school than their peers (e.g. Kearney, 2008; National Collaborative on Education andHealth, 2015; Silverstein, Mair, Katusic, Wollan, O’Connell, & Yunginger, 2001; Taras & PottsDatem, 2005). Chronic illness can impact attendance in multiple ways. For example, symptoms,doctor visits, hospitalization, sleep deprivation, and susceptibility to other illnesses are allconsequences of asthma that have been linked to absenteeism (Basch, 2011). Similarly,diabetes, obesity, seizure disorders, and vision problems contribute to absenteeism (NationalCollaborative on Education and Health, 2015; Pan, Sherry, Park, & Blanck, 2013).Oral health also contributes to absenteeism, with children suffering from poor oralhealth or tooth decay absent nearly three times more than their peers (Attendance Works,2015). One study found that 36% of students who had access to regular dental care missed twoor more days due to dental problems. In contrast, 73% of students without access to regulardental care missed the same amount of school (Pourat & Nicholson, 2009).Family health can also be an attendance barrier. Specifically, children with parents whoreport depressive symptoms are more likely to be absent (Guevara et al., 2012). Children inhouseholds with adults who smoked or used other substances were also more likely to missschool than their peers (Levy, Winickoff, & Rigotti, 2011; Stempel, Cox-Martin, Bronsert,Dickinson, & Allison, 2017). In a study of adverse childhood experiences, exposure toneighborhood violence and family substance abuse had the largest effects on the risk forchronic absenteeism, even after controlling for other contributing factors such as a health carecondition or low socioeconomic status (Stempel et al., 2017).Transportation. Another significant barrier to attendance is transportation (e.g. Erbsteinet al., 2015; Humm Brundage et al., 2017). The National Center for Safe Routes to School (2016)has been surveying parents about their transportation practices for a decade. In that time, carand bus remained the two most common forms of transportation to school. When students areunable to access these forms of transportation they may be unable to attend school. Studentsself-reported that common transportation barriers included missing the bus or having carproblems (Humm Brundage et al., 2017). Transportation is especially concerning for studentsCenter for Applied Research and Educational Improvement, University of Minnesota8
who live more than two miles from school (National Center for Safe Routes to School, 2016).The percentage of students walking to school increased slightly from 12-15% from 2007 to2014, however, for some students the safety of the community may be a barrier to walking(Gottfied, 2017; National Center for Safe Routes to School, 2016; Stempel et al., 2017).Witnessing or experiencing neighborhood violence has been shown to predict chronicabsenteeism (Stempel et al., 2017). If students, especially in elementary school, cannot walk toschool because the neighborhood is unsafe or they live too far away, their attendance becomesdependent on others. Therefore, transportation problems become barriers preventing studentsfrom accessing their education.Housing instability. Housing instability often contributes to transportation barriers, butit also contributes directly to absenteeism. Homelessness or any type of temporary housingdislocation may cause students to miss school as the family focuses on establishing newhousing (Balfanz & Byrnes, 2012). Chronic absenteeism among students who were homelesswas almost twice the rate of low-income students with stable housing (da Costa Nunez, ErbDownward, & Shaw-Amoah, 2015). Another indicator of instability, the number of schooltransfers in a year, is also related to more absenteeism even among students that have accessto housing (da Costa Nunez et al., 2015).Adult responsibilities. Adolescent children may experience a barrier to attendance ifthey are expected to take on adult responsibilities in contributing to the household. Somefamilies expect adolescent children to take on caregiver roles for young children or elder-care.Other adolescents may have to work in a family business or to contribute income for householdexpenses (Balfanz & Byrnes, 2012). When faced with these familial expectations, students maynot be able to attend school.Suspension. Both in-school suspension and out of school suspensions are related tolower attendance rates and eventual school drop-out (Balfanz, Byrnes, & Fox, 2014; Cholewa,Hull, Babcock, & Smith, 2018). These relationships are found to exist even when studentcharacteristics such as demographic variables and attitude toward school were controlled (Lee,Cornell, Gregory, & Fan, 2011). A large study of over 8,000 ninth grade students across 31states, found that detention, in-school suspension (ISS), Saturday school, and out-of-schoolCenter for Applied Research and Educational Improvement, University of Minnesota9
suspension (OSS) were the most common disciplinary responses to unexcused absences(Flannery, Frank, & Kato, 2012). Proactive disciplinary practices such as student conferences orrestitution interventions were rarely used (Flannery et al., 2012). This study also found thatrepeated OSS led to a strong and significant increase in truancy over time (Flannery et al.,2012).Involvement with child welfare or the juvenile justice system. Students in foster carehave a higher rate of absenteeism than their peers. One study showed that approximately onein four students in foster care experienced chronic absenteeism (California Department ofEducation, 2017). Additionally, involvement in the juvenile justice system is related toabsenteeism and school drop-out. Some studies have proposed the negative effects are relatedto increased retention, lower academic achievement, or stigmatization from peers and schoolstaff (Hirschfield, 2004; Hjalmarsson, 2008).AversionAversions are factors which impact attendance because the student feels they areunsafe or do not belong at school. These factors include school climate and student academicperformance (e.g. Balfanz & Byrnes, 2012; Black, Seder, & Kekahio, 2014; Chang et al., 2018).Unlike barriers, these root causes do not physically prevent students from attending school.However, these factors cause students to actively avoid it because they feel unsafe orunwelcome (Balfanz & Byrnes, 2012).Mental health. In addition to physical health, mental health concerns including schoolrefusal, separation anxiety, and depression can impact student attendance (e.g. Egger, Costello,& Angold, 2003; Kearney, 2008). School refusal refers to difficulty attending school related tofear or anxiety of school caused by the separation from parents, fear of specific school-relatedexperiences, general anxiety, or depression (Egger et al., 2003). In addition to anxiety anddepression related symptoms (e.g. separation fears, sleep difficulties, somatic complaints),students with school refusal reported that they felt the school was unsafe, they were beingbullied, and had difficulty making friends (Egger et al., 2003). Common symptoms of anxietyand school refusal, especially with young children, include somatic complaints such asheadaches and stomachaches. These may contribute to absenteeism if parents are not aware ofCenter for Applied Research and Educational Improvement, University of Minnesota10
these symptoms (Kearney, 2008). Although the direct causal link has not been established, it isimportant to note that students with attention-deficit hyperactivity disorder (ADHD) have anincreased risk for chronic absenteeism (e.g. Barbaresi, Katusic, Colligan, Weaver, & Jacobsen,2007; Guevara, Mandell, Danagoulian, Reyner, & Pati, 2012). The difference in attendance ratesbetween students with ADHD and their peers is apparent in elementary school and widens asstudents progress into high school (Barbaresi et al., 2007).School climate. Overall ratings of school climate are negatively related to absenteeism.Students have higher rates of attendance in schools with better (a) physical environmentsincluding proper ventilation, lighting, and temperature control; (b) emotional environmentsincluding feelings of belonging and positive peer relationships; and (c) organizational leadershipincluding access to adequate resources and a friendly and approachable staff (e.g. Bevans,Bradshaw, Miech, & Leaf, 2007; Christenson, Sinclair, Lehr, & Godber, 2001; Schneider, 2008).Specifically, students who experience or participate in bullying are more likely to be excessivelyabsent from school (Gastic, 2008). A longitudinal study examined the complex relationshipsbetween bullying (self-reports of bullying other students), academic achievement, and behaviorin middle school as predictors of future attendance and academic performance and found thatbullying had an indirect relationship with attendance (Feldman et al., 2014). Students whoreporting bullying had decreasing academic performance and increasing behavior issues overtime, which then led to lower attendance rates (Feldman et al., 2014).Academic performance. Low academic performance is a predictor of futureabsenteeism (Feldman et al., 2014; Janosz, Le Blanc, Boulerice, & Tremblay, 2000). Multipleearly indicators have been identified for high rates of absenteeism and eventual school dropoutincluding course failure in middle school and grade retention or low academic performance asearly as first grade (e.g. Alexander et al., 1997; Jimerson, Egeland, Sroufe, & Carlson, 2000;Jimerson, Anderson, & Whipple, 2002; Neild & Balfanz, 2006).Special consideration: Students receiving special education services. While the previousroot causes of aversion are applicable across student demographics, students receiving specialeducation services have higher rates of absenteeism than their peers. While health concernsmay contribute to the lower attendance rates, especially for students with physical disabilities,Center for Applied Research and Educational Improvement, University of Minnesota11
other aversions including bullying and higher rates of suspension have been shown to have adisproportionate impact on the attendance of this population (Attendance Works, 2015).DisengagementFinally, disengagement includes factors which influence the student’s desire to attendschool such as a lack of engagement in courses or extracurricular activities, association withchronically absent peers, student perceptions of the classroom environment, and theirrelationship with teachers, (e.g. Black et al., 2014; Chang et al., 2018; Farmer et al., 2003;Sheldon & Epstein, 2004).Student-school connectedness. Students who lack connections in the school maydisengage. A study in Chicago Public Schools found differences in student attendance rat
absenteeism in high school (missing one month or more of school per semester) were found to have less than a 10% chance of graduating (Allensworth & Easton, 2007). The impacts of chronic absenteeism start even before high school. Chronic absenteeism in kindergarten has been linked to lower academic and social-emotional outcomes in the same