Transcription
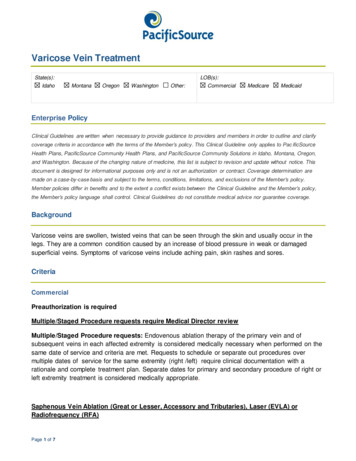
WSEAS TRANSACTIONS on COMPUTERSLiukui Chen, Hong ZhengPersonal Identification by Finger Vein Images Based onTri-value Template Fuzzy MatchingLiukui Chen, Hong ZhengSchool of Electronic Information, Wuhan University129 Luoyu Road , WuhanP.R.Chinaclkwhu@126.com hzheng@inass.orgAbstract: To reduce the effect of fuzzy vein edges and tips of the infrared finger vein recognition, this paperpresents a tri-value template fuzzy matching algorithm, which segments the vein feature image into three areas:subject area, fuzzy area and background area, and computes the average distance of non-background point tonon-background area as the dissimilarity score between the two templates. The proposed matching method isrobust against the fuzzy edges and tips. The experimental results show that the proposed method is feasible andpractical by the recognition accuracy rate, 99.46 %, to 456 near-infrared finger vein images.Key-Words: Personal identification; Infrared finger vein; Tri-value template; Fuzzy matchingtissues of finger easily, the finger vein patterns canbe captured as the dark lines. Two examples ofinfrared finger vein images are shown in Fig. 1.Vein patterns have many trunks and branches,which can be used for line feature discriminationbetween different vein patterns.From Fig. 1, the contrast of the origin infraredimage is quite low and brightness is not uniform[8].The vein edges and tips in vein feature image areblurry and hard for matching. To solve this problem,we propose a tri-value template fuzzy matchingmethod, which segments the vein feature image intothree areas: subject area, fuzzy area and backgroundarea. Calculate the average distance of nonbackground point to non-background area as thedissimilarity score. This method has elasticmatching capability by optimal distance norm todifferent non-background areas and does not needthe knowledge of correspondence among points inthe two matching templates.This paper is organized as follows. Section 2introduces the procedure of finger vein recognitionwith the tri-value template fuzzy matching. Section3 presents the experiment and discussion, Section 4draws the conclusions.1 IntroductionThe identity authentication and privacy protectionare becoming more and more important in theinformation society[1]. The personal identificationtechnology based on biological characteristic hasshown many advantages because of the use ofinherent physiology and behavior characteristics ofhuman. More and more biometric features appear inthe personal identification, such as face[2], speech[3],fingerprint[4], palmline[5] and iris[6]. Compared tothese available biometric features, the finger vein[7]has four advantages:Firstly, it does not need physical contact andwill not make the people displeasure, much betterthan fingerprint and iris scanning.Secondly, it has forceful universality anduniqueness. The adults’ finger vein has less changewith age. And different finger has different veinpatterns.Thirdly, it is very hard to capture the finger veinimage for forgery in the normal actives because thevein is hypodermal, better than other biometricfeatures on the surface, such as fingerprint and face.Fourthly, the temperature, humidity and cleanlinesshave little effect on the vein image.The finger vein patterns can be adopted ingeneral public use, such as for on-line identificationand ATM(Automatic Teller Machines). In medicinefield, the patterns can be used for patients’recognition and injecting vein.As light within near-infrared band (wavelengths720nm -- 1100nm) is absorbed intensively by thehemoglobin in the blood of vein and transmits otherISSN: 1109-2750Figure 1 Infrared finger vein image examples1165Issue 7, Volume 8, July 2009
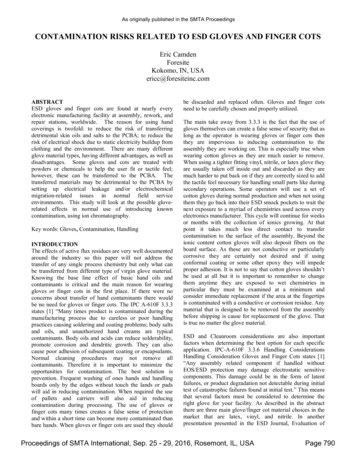
WSEAS TRANSACTIONS on COMPUTERSLiukui Chen, Hong ZhengThe origin image preprocess removes the noisesand rotates the finger to horizon direction. Then cutthe finger vein image by the normalized size tomatching and register easily.The extraction of finger vein feature is toenhance the line feature of vein or extract it and thenregister the feature in the database or used formatching.The matching is between the input finger veinfeature and the one in the database and therecognition provides the matching result: pass orrefuse.2 Personal Identification by InfraredFinger Vein ImagesThe flowchart of finger vein recognition is shown inFig. 2 which is consisted of infrared finger veinimage acquisition, preprocess, vein featureextraction and matching.2.1 Infrared finger vein image acquisitionIn the experiment, the schematic diagram for nearinfrared finger vein image acquisition is describedin Fig. 3. An eight near-infrared LEDs array is usedas the light source, which wavelength is 850nm, andits intensity of light can be manually adjusted. Theinfrared light transmits the dorsal side of the finger,the infrared filter and be captured by a CMOScamera. The light source and camera can becontrolled by a PC.Figure 2 Flowchart of finger vein recognitionThere are two types of infrared finger veinimaging techniques: Far-Infrared(FIR) and NearInfrared (NIR) which both are contact-lessacquisition method and require no injection of anyagents into the finger blood vessels. The former,FIR imaging, bases on that the heated finger emitsinfrared radiation and veins have higher temperaturethan the surrounding tissues. Therefore, the thermalimaging camera can capture the FIR finger veinimage which contains the heat distribution and candisplay the structure of finger vein patterns on finger.But the temperature distribution of finger is unstableand sensitive to the environment temperature. SoFIR imaging is inadequate for real-time finger veinimage acquisition. As mentioned above, the NIRimaging bases on that the external NIR light can beabsorbed intensively by the vein and transmits otherfinger tissues easily. The finger vein patterns can becaptured by the NIR camera as the dark lines. Theexternal light source can be controlled and theabsorbability is quite stable. So the NIR finger veinimaging is used in the real-time system of fingervein acquisition.ISSN: 1109-2750Figure 3 The schematic of infrared finger vein imageacquisition2.2 Preprocess and normalizationIn the Fig. 1, the origin infrared finger vein image isblurry with speckle noises and the direction offinger is declining. These should be adjusted.Preprocess and normalization include low-pass filter,finger outline detection, finger body extraction,1166Issue 7, Volume 8, July 2009
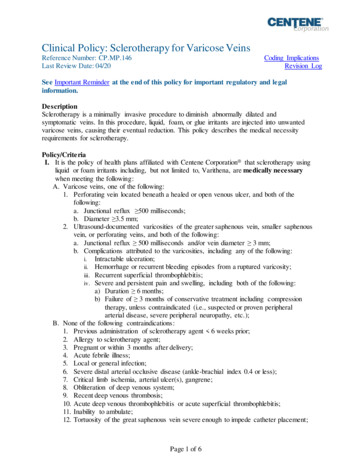
WSEAS TRANSACTIONS on COMPUTERSLiukui Chen, Hong Zhengfinger rotation and size normalization whichflowchart is shown in Fig. 4.Gaussian low-pass filter is used to removespeckling noises in the origin image. Sobel edgedetection extracts the finger’s outline, whichdescribes the shape of the finger and can be used toextract the finger body. The areas outside fingerbody are zero padded. Use least-squares line-fit ofthe finger outline to estimate the slope angle of thefinger. Then the finger image is rotated to horizonby the slope angle. The finger image is cut out fromthe tip to the root by a normalized size.Figure 5 Character of vein profile and the line trackingprocess. (a) The profile on vein. (b) The gray distributionof the profile. (c) A line tracking on a vein.Fig.5(c) shows an example of the spatialrelationship between the current trackingpoint(xc,yc) and the cross-sectional profile. Pixel pis a neighbor of the current tracking point in theupper-right direction. The profile s-p-t of the currentpoint(xc,yc) looks like a valley. Therefore, thecurrent tracking point is on a dark line. Thedirection of this dark line can be detected bychecking the depth of the valley with varying detectangle θi. This can find the deepest valley at a θi.After that, the current tracking point moves to thepixel closest to this direction, pixel p. If the valley isnot detectable in any direction angle θi, the currenttracking point is not on a dark line and a freshtracking operation starts at another position.This vein line feature extraction procedureconsists of tracking a dark line, iteratively trackingthe lines and obtaining vein patterns by the numberof times of tracking and it is illustrated as followingsteps:Step 1: Determinate the start point for linetracking and the moving-direction attribute.The line-tracking operation starts at a random pixelwhich is called the current tracking point asmentioned above. The moving-direction maybe leftright, up-down or all-direction by randomprobability 50%, 25%, 25% respectively.Step 2: Detection of the direction of the darkline and movement of the tracking point.Calculate the vertical cross-profile valley depth ofthe points set on the moving-direction near the startpoint. Then detect the dark line direction and movethe current tracking point to this position, which isFigure 4 Flowchart of finger vein preprocess2.3 Vein feature extractionIn our study, the repeated line tracking[9] is used toextract the vein feature. This scheme is based onthat the vertical section profile of a vein looks like avalley, which is shown in Fig.5(a) and Fig.5(b), andthis can be tracked and detected, which is shown inFig.5(c):ISSN: 1109-27501167Issue 7, Volume 8, July 2009
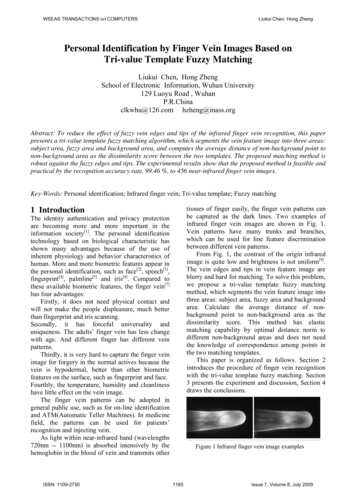
WSEAS TRANSACTIONS on COMPUTERSLiukui Chen, Hong Zhengshown in the Fig.5(c). If there is no point in thebottom of valley, go to Step 4.Step 3: Updating the number of times points inthe locus space have been tracked.At the beginning of first tracking, a trackinginformation registration image which is called locusspace, is built and initialized to 0. The number oftimes that each pixel has become the currenttracking point is recorded in the locus space image.Step 4: Repeated execution of step 1 to step 3for N times. Repeat the line track at 3000 randomstart points.Step 5: Acquisition of the finger-vein patternfrom the locus space.Step 6: Labeling of the locus space.The positions with high values in the locus spacehave high probabilities of being the positions ofveins. Therefore, the paths of finger vein areobtained as chains of high-value positions in thelocus space. The current tracking point may tracknoise region by chance. But vein regions have muchmore probability to be tracked many times thannoise regions. Thus, noise regions in locus spacehave lower tracking record times than vein regions.The locus spaces of finger vein examples areshown in the Fig. 6(a). But the contrast of locusspace is also low, and there are be many randomflocky lines on vein edges and tips if segmenteddirectly, which is shown in Fig. 6(b) and it is hard tomatching. The locus space must be enhanced beforesegmentation. To reduce the effect of flockytracking, image resizing is used to smooth the veinedges and center enhance filter to strengthen thevein midlines. The locus space is zoomed out toone-second of origin size, which can remove flockynoises, and then zoom in to origin size using bilinearinterpolation. A center enhance filter is used toenhance the locus space. The resized locus spaceand enhance vein feature image are shown in the Fig.6(c), (d) and (e).The filter is a center enhance maskand shown in Table 1.Figure 6 Locus space resizing and enhancement(a) Locus space. (b) Binary image of (a) by directsegmentation. (c) Locus space zoomed out to one-secondof (a). (d) Locus space zoomed in to origin size. (e)Center enhanced locus space2.4 Matching and recognitionTemplate matching is appropriate to vein patternswhich have sparse structure points composingtrunks and branches. Though there are some othermatching methods, such as structural matching andneural networks, but they usually need quiteaccurate segmentation or many training samples. Inthe enhanced locus space, the edges and tips of veinare still fuzzy and have some random noises whicheffect the matching of structural matching andneural networks. To solve the problem, this paperpresents tri-value template fuzzy matching, whichsegments the vein feature image into three areas:subject area which includes the stable vein trunks,fuzzy area which includes dubious vein edges andtips, and the background area. The proposed methodcalculates the average distance of non-backgroundpoint to non-background area as the dissimilarityscore between the two tri-value templates.Table 1 Center Enhancement 980-0.8930-0.8933-0.8933-0.8933-0.8930-0.7980ISSN: 1109-27502.4.1 Tri-value template definitionTri-value template is defined like binary image.There are three possible values 1, 0.5 and 0 in thetemplate image. Every point has one of the three1168Issue 7, Volume 8, July 2009
WSEAS TRANSACTIONS on COMPUTERSLiukui Chen, Hong Zhengvalues, 1 means stable subject, 0.5 means fuzzyobject between the subject and background and 0means the background. A tri-value templateexample is shown in the Fig. 7.The distance between point ‘a’ and the subjectarea ‘S’ is defined as:d (a, S ) min(d b S (a, b))(4)The distance map of subject area ‘DS’ is definedby the formula (5):DS (i, j ) d ( M (i, j ), S )(5)Similarly, the distance map of fuzzy area ‘DF’ isdefined by the formula (6):DF (i, j ) d ( M (i, j ), F )(6)Where, ‘F’ is the fuzzy area in the tri-valuetemplate.So the distance map of tri-value template ‘DM’can be defined as:Figure 7 The tri-value template exampleDM (i, j ) min( DS (i, j ), DF (i, j ))(7)The flowchart of distance transform to tri-valuetemplate is shown in the Fig. 8.2.4.2 Tri-value template acquisitionSet the enhanced vein feature image as IF. The trivalue template M is the segmentation of IF by twothresholds T1 and T2 in formula (1): M (i , j ) 1 M ( i , j ) 0.5 M (i , j ) 0 I F (i , j ) T 1T 2 I F (i , j ) T 1I F (i , j ) T 2(1)Where, M(i,j) is the point value at (i,j) in thetemplate and IF(i,j) is the one at same position. Highthreshold T1 is used to confirm the subject area andlow threshold for background area.2.4.3 Distance map of tri-value templateIt is efficient to compute the distance map fordistance calculation between templates. Generally,the distance map is calculated by the distancetransform(DT). For the binary image, DT is aprocess that assigns a value at each location withinthe object that is the shortest distance between thatlocation and the complement of the object. In the trivalue template, the object includes subject and fuzzyarea. Both of them must be considered in thedistance map.Similar to the binary image, the distancebetween point ‘a’ and subject point ‘b’ is defined asEuler distance:db 1 (a, b) (ia ib )2 ( ja jb )2(2)Where, ia, ib, ja and jb are the row and columncoordinates of point ‘a’ and ‘b’, respectively.Since the importance account of fuzzy area is lessthan the subject area. The distance between point ‘a’and fuzzy subject point ‘c’ should be further thanEuler distance. It is defined as:d c 0.5 (a, c) k (ia ic ) 2 ( ja jc ) 2Figure 8 Flowchart of tri-value template DT(a) The tri-value template by the enhanced locus space inFig. 6(e). (b) The region of interesting (ROI) of (a) sinceveins in the finger tip are too thin and concentrated toextract for CMOS camera and vein patterns are similar inthis area. (c) The subject area of (b). (d) Distance map of(3)Where, k 1.ISSN: 1109-27501169Issue 7, Volume 8, July 2009
WSEAS TRANSACTIONS on COMPUTERSLiukui Chen, Hong Zheng(c). (e) Fuzzy area of (b). (f) Distance map of (e). (f) Thedistance map of (b)3.2 Matching results2.4.4 Tri-value template matchingSet the input tri-value template as Mi and theregistered tri-value template in database as Mr. Thecorresponding distance maps are Di and Dr. Theaverage distance of non-background point to nonbackground area as the dissimilarity score betweenMi and Mr is calculated by formula (8):3.2.1 Matching results by proposed methodFirstly, the tri-value template matching between twoimages from one finger is calculated by theproposed matching method using formula (8). Theresult is signed as CS. Fig. 9 draws its histogram.C(Mi , Mr ) 1 2 (Ni Nr ) (M (i, j) D (i, j) M (i, j) D (i, j))irrIn our study, arbitrary two images of the 456 imagesare tested by the tri-value template fuzzy matching.(8)iWhere Ni and Nr are the numbers of the nonbackground points in Mi and Mr. The lower thescore is, the similar the two templates.3 Experimental ResultsIn the experiment, 456 infrared finger vein imagesare captured from 76 fingers, and each finger iscaptured 6 images. The age and sex distribution areshown in the table 2, respectively:Figure 9 Histogram of matching between two tri-valuetemplates of one fingerValues of CS are centered at 1.5. In Fig.9 theheight of the black bar denotes the accumulatednumbers of identical finger and the width of theblack bar means the range of dissimilarity score.The bins are 30 equally spaced between theminimum and maximum score values in thematching result.Then, the tri-value templates between twoimages of different fingers are calculated. The resultis signed as CD. Fig. 10 draws its histogram.Table 2: Age and sex distribution in the experimentAge16-2021-2526-3030-50 TotalNum.45030276SexMaleFemaleTotalNum.6016763.1 Experiment environment and parametersThe experiment hardware and software environmentare described in table 3:Table 3: Computer configurationHardwareSoftwareCPUCeleron 2.66GSoftVisual C 6.0MemoryDDR 768MLib.OpenCV 1.0The still resolution of infrared camera is320*240. In Fig. 1, the size of infrared finger veinimage example is 198*132. The finger edges arereserved for template matching because the shape offinger outline also has distinct line character. Thesize of tri-value template ROI is 132*88. The twothresholds in formula (1) are initialized by: T1 192 and T2 128. And the value of k is 1.21 informula (3). Sliding window matching is used formatching registration. The size of sliding window is100*60. The minimum score of the sliding matchrecords is regarded as the dissimilarity of the twotri-value templates.ISSN: 1109-2750Figure 10 Histogram of matching between two tri-valuetemplates of different fingersValues of CD are centered at 3.9. In Fig.10 thebins are 420 equally spaced between the minimumand maximum values in the matching result.1170Issue 7, Volume 8, July 2009
WSEAS TRANSACTIONS on COMPUTERSLiukui Chen, Hong Zheng3.2.2 Matching result discussionFig. 11 shows the histogram of the arbitrary twofingers matching result by the tri-value templatefuzzy matching.Figure 12 FAR and FRR curves by threshold CTTable 4: The error rate of proposed method2.212.732.84Threshold gure 11 Histogram of matching between two tri-valuetemplates of arbitrary finger imagesBlack bars(CS) mean the same finger matchingresult and the height refers to the left verticalcoordinates. The gray bars(CD) mean the differentfinger matching result and the height refers to theright vertical coordinate. Since the overlappingbetween CS and CD is very little, the infrared fingervein identification is possible. Assume therecognition threshold is CT. The error rate ofidentification accuracy includes false acceptancerate (FAR) and false rejection rate (FRR), which isdefined as:N CD CT FAR N2 FRR N CS CT N1 From the Fig.12 and table 4, it can be seen thatthe Min. EER is 0.54% when threshold CT 2.73,on which FAR 0.11% and FRR 0.43%. In ourstudy, the recognition accuracy rate is used toevaluate the performance of the proposed matchingmethod. It is defined as 1 – EER. The correspondingrecognition accuracy rate is 99.46%.3.2.3 Distance norm parameter discussionIn our study, Euclidean distance is used in thedistance norm for subject area. Fig. 13 shows thediscussion of distance norm for fuzzy area. Asmentioned in formula (3), k 1. Fig. 13(a) is a 3*3matrix which means the location of point p1, p2, .,p9. Assume that p2 is a subject point, p5 is a fuzzypoint, and the other points are background points.So their distance maps are Fig. 13(b) and Fig. 13(c),respectively. It is familiar that the fuzzy points arearound subject points in Fig. 7. The distance valuein p4 maybe 2 or k in Fig. 13(b) and Fig. 13(c).The point p5 is nearer to p4 than p2. So k 2 .The range of k is (1 2 ). To evaluate the optimaldistance norm for fuzzy area, k is defined as avariable which increases 0.01 from 1 to 2 . ThenEER is calculated to k. The k-EER curve is plottedin the Fig. 14:(9)Where N1 is the number of matching betweenidentical fingers and N2 is that between differentfingers, N1 1140 and N2 102600. The NCD CT isthe number of CD value less than CT and theN CS CT is the number of CS value more or equal thanCT. In our study, the error rate (EER) is defined asFAR FRR. To evaluate the optimal threshold forminimum error rate, CT is defined as a variablewhich increases 0.01 from 0 to 7. The FAR andFRR are calculated by CT and the error rate curvesare plotted in the Fig. 12. The Min. EER isdetermined by searching a value of CT so that (FAR FRR) is minimized.The CT which make FAR FRR may not existsince FAR and FRR are discontiguous variable. Theerror rate is shown in Table 4.ISSN: 1109-2750Figure 13 Distance norm discussion1171Issue 7, Volume 8, July 2009
WSEAS TRANSACTIONS on COMPUTERSLiukui Chen, Hong ZhengTable 5 The matching result of four match methodsRecognition accuracy rateThe proposed method99.46%Correlation Coefficient75.70%MHD99.15%Miss-match98.46%(a) A a 3*3 position matrix. (b) The distance map withp2 1. (c) The distance map with p5 0.5.The gray images of finger after preprocess alsokeep the low contrast and unclear edges. Calculatingthe correlation coefficient directly of gray images isnot suitable for matching. Although the MHDmethod has some fuzzy matching capability, thereare many ambiguous edges and tips around the veinwhich lead to the primary similar error effect inmatching. MDH is not the optimized method for ourexperiment. The miss-point statistic matchingignores the effect of ambiguous area and leads tosome additional error rate correspondingly.Tri-value template fuzzy matching utilizes apriori knowledge that different class regions havedifferent amounts of importance. In measuring thedistance between two point sets, we increase thedistance norm on the fuzzy area properly. Thus theeffect of ambiguous edges around veins is weakenedand depressed. Table 5 shows the proposed methodhas the best recognition accuracy rate among thesemethods.Figure 14 k-EER curveFrom the k-EER curve, the minimum EER is0.54% when k 1.21.3.3 Matching method discussionOther three matching method are tested on theexperiment data: the normalized gray correlationcoefficient(Correlation Coefficient)[10], the modifiedHausdorff distance (MHD)[11] and the miss-pointstatistic match(Miss-match)[9] method.The direct gray correlation coefficient is definedas formula (10):(M1 (i, j) M1 )(M 2 (i, j) M 2 ) ij(10)r 22( (M1 (i, j) M1 ) )( (M2 (i, j) M 2 ) )iji3.4 Effect of feature extraction scheme andmatching ROIThe performance of vein line feature extractionscheme is very important for the matching. In ourstudy, other two schemes of the vein featureextraction are tested on the experiment data. One ismatched filter[12] and the other is local threshold[13].The matched filter concludes four directionenhance filters, in which the horizon filter is definedas Table 6, and the other 3 filters are this filterrotated by multiples of 45º, 90º and 135º:jWhere, M 1 is the average value of the templateM1 and M 2 is the average value of the template M2.The Modified Hausdorff Distance(MDH) is definedas:N h( M 1 , M 2 ) N 2 h( M 2 , M 1 ) (11)H MHD ( M 1 , M 2 ) 1N1 N 2Where, h(M1,M2) is the direct Hausdorffdistance from M1 to M2 and h(M2,M1) is the directHausdorff distance from M2 to M1.The miss-point statistic match method defines themis-match ratio as:N(12)Rmiss match m 100%NWhere Nm is the sum of overlapped points whichone belongs to vein area and the other one belongsto ambiguous area in the two templates. N is thesum number of non-zero points in two templates.The matching result of four match methods isshown in the Table 5:ISSN: 1109-2750Table 626262626262626Match filter mask on horizontal 2-188268-1832-188268-1832-188268-1832-18826The local threshold scheme uses OSTUthreshold on the local 7*7 blocks. Fig. 15 shows thefeature and binary images by mentioned two veinline feature extraction methods.1172Issue 7, Volume 8, July 2009
WSEAS TRANSACTIONS on COMPUTERSLiukui Chen, Hong Zhengvein fuzzy matching. Further works includesearching for faster distance transform algorithmson tri-value template and designing better infraredimage capture system.AcknowledgementsThis work is supported by the National NaturalScience Fund of China under granted No. 40571102.References:Figure 15 Results of match filter and local threshold(a) The feature image processed by matching filter. (b)The binary image of (a). (c) The feature image processedby local threshold. (d) The binary image of (c).[1] KI-HO LEE, TAE-HEE CHO, KYU-CHEOLOH, DAE-YONG BYUN, SANG-SOO JANG.Methods of Privacy Protection CertificationSystems. [C] 6th WSEAS International Conferenceon Information Security and Privacy, 2007, 117-122.[2] Tae In Seol, Sun-Tae Chung, Sunho Ki,Seongwon Cho, Yun-Kwang Hong. IlluminationRobust Face Recognition based on Gabor FeatureFace Intrinsic Identity PCA Model. [C] Proc. of the7th WSEAS Int. Conf. on COMPUTATIONALINTELLIGENCE, MAN-MACHINE SYSTEMSand CYBERNETICS, 2008, 143-148.[3] Doh-suk Kim, Soo-Young Lee, Rhee M Kil.Auditory processing of speech signals for robustspeech recognition in real-world noisy environments.[J] IEEE Transactions On Speech And AudioProcessing, 1999, 1(7): 55-68.[4] Yin Y L, Ning X B, Zhang X M. ntification technology. [J] Journal of NanjingUniv(Natural Sciences), 2002, 38(1): 29-35.[5] Xiangqian Wu, David Zhang, Kuanquan Wang.Palmline Extraction and Matching for PersonalAuthentication. [J] IEEE Trans Systems, Man, andCybemetics, 2006, A36(5):978-987.[6] DAUGMAN J. The importance of being random:statistical principles of iris recognition [J]. PatternRecognition. 2003, 36(2): 279-291.[7] Kono M, Ueki H, Umemura S, Personalidentification method using finger vein patterns [C].5th Pattern Measurement Symposium Data, p912,2000.[8] N. Miura, A. Nagasaka, and T. Miyatake,Automatic feature extraction from non-uniformfinger vein image and its application to personalidentification [C]. Proc. MVA2002, pp.253–256,Nara, Japan, IAPR, 2002.[9] N. Miura, A. Nagasaka, Feature extraction offinger-vein patterns based on repeated line trackingand its application to personal identification [J].Machine Vision and Applications. Digital ObjectIdentifer, 2004,10.1007From Fig. 15, these two vein feature extractionmethods are not robust to the infrared finger veinimages. Table 7 shows the recognition accuracy rateby 3 matching methods:Table 7 Recognition accuracy rate using other two veinfeature extraction schemesMatch filterLocal thresholdProposed method95.68%95.96%MHD94.85%95.30%Miss-match90.73 %92.52%These two vein feature extraction methods arenot robust to the infrared finger vein images andreduce the recognition accuracy rate.It is important to choose the appropriate ROI tothe template. As mentioned above, the veins in thetip part of finger are too slight and dense to extractrobustly. If make the entire finger image as ROI,which size is 198*132, and choose sliding windowsize 120*90. Table 8 shows the matching result byrepeated line tracking:Table 8 Recognition accuracy rate using entire finger asROI in matchingMatching methodAccuracy rateProposed method86.77%MHD84.44%Miss-match80.38%From Table 5, 7 and 8, it can be seen that theproposed matching method has the best recognitionaccuracy rate error rate in the same conditions.4 ConclusionsIn this paper, we propose a tri-value template fuzzymatching for finger vein recognition. Experimentresults show that the recognition accuracy rate ofproposed method is 99.46% and it is feasible forISSN: 1109-27501173Issue 7, Volume 8, July 2009
WSEAS TRANSACTIONS on COMPUTERSLiukui Chen, Hong Zhengwise threshold probing of a matched filter response,IEEE Trans Med Image 19(3):203-210.[13] RUDI HERIANSYAH, S. A. R. ABU-BAKAR.Defect Detection in Thermal Image usingThresholding Technique[C]. The 6th WSEASInternational Conference on CIRCUITS, SYSTEMS,ELECTRONICS,CONTROL&SIGNALPROCESSING, 2007 341—346.[10] Gonzalez, R.C., Woods, R.E.: Digital ImageProcessing [M] Second edition, New Jersey:Prentice Hall, 2003.[11] M.P.DUBUSION, A.K.JAIN. A modifiedhausdorff distance for object matching [C].Processing of the 12th International Conference onPattern Recognition. Jerusalem, Israel:IEEEComputer Society Press, 1994. 566-568.[12] Hoover A, Kouznetsova V, Goldbaum M(2000)Locating blood vessels in retinal images by piece-ISSN: 1109-27501174Issue 7, Volume 8, July 2009
Tri-value Template Fuzzy Matching Liukui Chen, Hong Zheng School of Electronic Information, Wuhan University 129 Luoyu Road , Wuhan P.R.China clkwhu@126.com hzheng@inass.org Abstract: To reduce the effect of fuzzy vein edges and tips of the infrared finger vein recognition, this paper presents a tri-value template fuzzy matching algorithm .