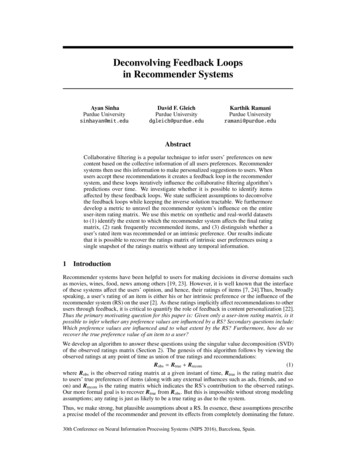
Transcription
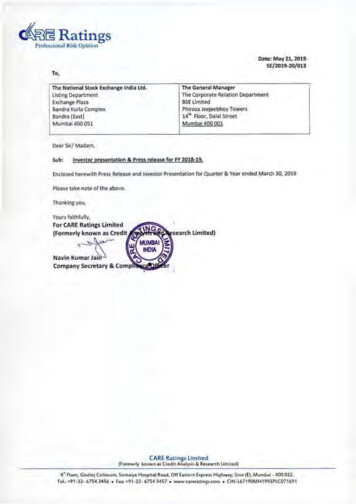
@RatingsProfo,,sional Risk Opi nionDate: May 21, 2019SE/ 2019-20/013To,The National Stock Exchange India Ltd .Listing DepartmentExchange PlazaBandra Kurla ComplexBandra {Ea t)M umbai 400 051The General ManagerThe Corporate Relation Departmentase LimitedPhlroza Jeejeebhoy Towers14"' Floor, Dalal StreetMumbai 400 001Dear Sir/ Madam,Sub:Investor presentati on &Pren release for FY 20 18-19.Enclosed herewith Press Release and Investor Presentation for Quarter & Year ended March 30, 2019Please take note of the above.Thanking you,CARE Ratings limited{Formerly known M Credit Anafysls & ReHarch Umhad)4 Floor. Godre; Colisc 1m, SomAlyAHospital Road, Off EMl(!fn bpreu Hl ghw y, Slon (E), Mumbai 400 022.Toi.: 91 -22- 6754 3 456 Fax: 91-22· 6754 3457 www.careratings,com CIN-l 67190MH 1993PLC071691
Ra tingsProfessional Risk OpinionthRegistered office: 4 Floor, Godrej Coliseum, Somaiya Hospital Road, Off Eastern Express Highway, Sion (East), Mumbai 400 022CIN: L67190MH1993PLC071691stMumbai, 21 May, 2019FY19 ResultsThe Board of Directors of CARE Ratings approved the quarter ended March 2019 and financial yearended March 2019 results in the Board meeting held on Tuesday, the 21st May, 2019.Consolidated Financial ResultsCARE Ratings consolidated total income for the financial year ended March 31, 2019 is Rs.349.36crore as against Rs. 338.57crore (adjusted*) in the year ended March 31, 2018.Consolidated income from operations for the year ended March 31, 2019 is Rs. 318.97 crorecompared with Rs.313.10crore (adjusted*) in the previous year. This was supported by growth fromour subsidiaries. Profit after tax moderated to Rs. 138.07 crore compared with Rs. 148.72crore(adjusted*) in the previous financial year.Standalone Financial ResultsCARE Ratings standalone total income for the financial year ended March 31, 2019 is Rs.327.19 usyear.Standaloneincome from operations for the year ended March 31, 2019 is Rs.297.36 crore compared withRs.302.03 crore (adjusted*) in FY18. Profit after tax on the standalone basis moderated to Rs. 134.99crore compared with Rs.147.42crore (adjusted*) in the previous financial year.The Board of Directors has recommanded Final dividend of Rs. 12/‐ per share (of Rs. 10/‐ face value)Major factors affecting results of financial year ended March 2019Towards the end of the second quarter of FY19 the NBFC sector faced headwinds which impactedthe borrowing plans of this crucial segment of the economy. Further the capex related borrowing ofthe corporate sector also remained subdued. As a result, the company’s performance did getimpacted. However when looked at the above backdrop, the company has managed to performsatisfactorily.Total operating costs increased by 12.18% from Rs.115.13 crore to Rs.129.15crore mainlydue to increase in salary expenses by Rs.8.05 crore ,additional ESOP charge of Rs.4.09 crore (ESOPcharges for FY19 is Rs.12.74crore and FY18 is Rs.8.65 crore) and additional CSR expenses of Rs.3crore.Consequently adjusted operating profit moderated to Rs.168.21 crore in FY19 as compare toRs.186.90 crore in FY18.*Adjusted: Due to change in revenue accounting policy in FY18, The revenue for the financial yearended March 31, 2018 was higher by Rs.19.58 crore and PAT was higher by Rs.13.60 crore.1
Ra tingsProfessional Risk OpinionOperational DataFor the year ended March 31, 2019, your company has rated total debt amounting to Rs.19.91 lakhcrore compared with Rs.16.48 lakh crore in the previous financial year ended March 31, 2018. Thiscomprises of Rs.8.13 lakh crore in bonds, Rs.8.50 lakh crore bank loans and Rs.3.27 lakh crore inshort term ratings (including Commercial Paper) for the year ended March 2019.Economic backdropThe year 2018‐19 has been marked with various challenges on the economy front including liquiditycrisis in the NBFC segment, high NPAs in the banking system, stagnant private investment and lowerconsumption demand resulting in subdued economic growth. Despite various measures by the RBIto infuse liquidity in the system via OMO, Rs‐ swap operations the banking system continued toface liquidity pressure, which showed signs of marginal improvement towards the end of thefinancial year 2018‐19.Total corporate bonds raised during the year 2018‐19 aggregated to Rs. 6.44 lakh crore. Bank creditgrowth was at 13.2% in 2018‐19 compared with 10% growth in 2017‐18. Credit growth to industrywas lackluster at 6.9%. Bank credit to services grew by 17.8% in 2018‐19 mainly due to highergrowth to NBFCs by 29.2% as banks supported these institutions which confronted liquiditychallenges from debts market.The RBI raised interest rates by 25 bps each in Jun’18 and Aug’18 on concerns over a rise in inflation.The RBI subsequently changed its stance and cut interest rates by 25 bps each in Feb’19 and Apr’19to 6%.Management viewCommenting on the results Rajesh Mokashi, MD & CEO, said, ‘This year has been challengingwith the economic environment being subdued and liquidity pressures putting pressure on somesectors. The liquidity issue is being addressed through several measures and we are watchful on theprogress on this front. While we are hopeful of things improving in FY20, we would be guarded inour outlook given the developments in the financial system and the time taken by the newgovernment to push through with reforms this year.’Contact:Rajesh Mokashi, MD & CEO 022‐67543636ABOUT USCARE Ratings (until recently called Credit Analysis and Research Limited), is the second largest full service rating Company inIndia**. CARE Ratings offers a wide range of rating and grading services across a diverse range of instruments and has over25 years’ experience in the rating of debt instruments and related obligations covering wide range of sectors. TheCompany’s list of clients includes banks and other financial institutions, private sector companies, central public sectorundertakings, sub‐sovereign entities, small and medium enterprises (“SMEs”) and microfinance institutions, among others.The Company also provides issuer ratings and corporate governance ratings and offers rating of innovative debtinstruments, such as REITs, expected loss (for infra), perpetual bonds etc. CARE Ratings is recognized for being knowledgebased Company and has continued to work towards deepening the base.2
RatingsProfessio nal Risk Opinio nThe company has a subsidiary CARE (Ratings) Africa Private Limited (CRAF) in Mauritius and CARE Ratings Nepal Limited inNepal. The company has two wholly owned subsidiaries in Mumbai, India namely CARE Risk Solutions Private Limited andCARE Advisory Research & Training Limited. The Company has its registered office in Mumbai, and branches in Ahmedabad,Andheri, Bengaluru, Chandigarh, Chennai, Coimbatore, Hyderabad, Jaipur, Kolkata, New Delhi, and Pune.** In terms of rating income FY19.3
CARE Ratings LimitedInvestor Presentation – FY19
SAFE HARBOR STATEMENTTHIS PRESENTATION AND THE ACCOMPANYING SLIDES (THE “PRESENTATION”), WHICH HAVE BEEN PREPARED BY CREDIT ANALYSIS &RESEARCH LIMITED (THE “COMPANY”), HAVE BEEN PREPARED SOLELY FOR INFORMATION PURPOSES AND DO NOT CONSTITUTE ANYOFFER, RECOMMENDATION OR INVITATION TO PURCHASE OR SUBSCRIBE FOR ANY SECURITIES, AND SHALL NOT FORM THE BASIS ORBE RELIED ON IN CONNECTION WITH ANY CONTRACT OR BINDING COMMITMENT WHATSOEVER. NO OFFERING OF SECURITIES OFTHE COMPANY WILL BE MADE EXCEPT BY MEANS OF A STATUTORY OFFERING DOCUMENT CONTAINING DETAILED INFORMATIONABOUT THE COMPANY.THIS PRESENTATION HAS BEEN PREPARED BY THE COMPANY BASED ON INFORMATION AND DATA WHICH THE COMPANY CONSIDERSRELIABLE, BUT THE COMPANY MAKES NO REPRESENTATION OR WARRANTY, EXPRESS OR IMPLIED, WHATSOEVER, AND NO RELIANCESHALL BE PLACED ON, THE TRUTH, ACCURACY, COMPLETENESS, FAIRNESS AND REASONABLENESS OF THE CONTENTS OF THISPRESENTATION. THIS PRESENTATION MAY NOT BE ALL INCLUSIVE AND MAY NOT CONTAIN ALL OF THE INFORMATION THAT YOU MAYCONSIDER MATERIAL. ANY LIABILITY IN RESPECT OF THE CONTENTS OF, OR ANY OMISSION FROM, THIS PRESENTATION IS EXPRESSLYEXCLUDED.CERTAIN MATTERS DISCUSSED IN THIS PRESENTATION MAY CONTAIN STATEMENTS REGARDING THE COMPANY’S MARKETOPPORTUNITY AND BUSINESS PROSPECTS THAT ARE INDIVIDUALLY AND COLLECTIVELY FORWARD‐LOOKING STATEMENTS. SUCHFORWARD‐LOOKING STATEMENTS ARE NOT GUARANTEES OF FUTURE PERFORMANCE AND ARE SUBJECT TO KNOWN AND UNKNOWNRISKS, UNCERTAINTIES AND ASSUMPTIONS THAT ARE DIFFICULT TO PREDICT. THESE RISKS AND UNCERTAINTIES INCLUDE, BUT ARENOT LIMITED TO, THE PERFORMANCE OF THE INDIAN ECONOMY AND OF THE ECONOMIES OF VARIOUS INTERNATIONAL MARKETS,THE PERFORMANCE OF THE RATING INDUSTRY IN INDIA AND WORLD‐WIDE, COMPETITION, THE COMPANY’S ABILITY TOSUCCESSFULLY IMPLEMENT ITS STRATEGY, THE COMPANY’S FUTURE LEVELS OF GROWTH AND EXPANSION, TECHNOLOGICALIMPLEMENTATION, CHANGES AND ADVANCEMENTS, CHANGES IN REVENUE, INCOME OR CASH FLOWS, THE COMPANY’S MARKETPREFERENCES AND ITS EXPOSURE TO MARKET RISKS, AS WELL AS OTHER RISKS. THE COMPANY’S ACTUAL RESULTS, LEVELS OFACTIVITY, PERFORMANCE OR ACHIEVEMENTS COULD DIFFER MATERIALLY AND ADVERSELY FROM RESULTS EXPRESSED IN OR IMPLIEDBY THIS PRESENTATION. THE COMPANY ASSUMES NO OBLIGATION TO UPDATE ANY FORWARD‐LOOKING INFORMATION CONTAINEDIN THIS PRESENTATION. ANY FORWARD‐LOOKING STATEMENTS AND PROJECTIONS MADE BY THIRD PARTIES INCLUDED IN THISPRESENTATION ARE NOT ADOPTED BY THE COMPANY AND THE COMPANY IS NOT RESPONSIBLE FOR SUCH THIRD PARTY STATEMENTSAND PROJECTIONS.Investors Presentation FY19 2
CARE Ratings GroupCARE Ratings LimitedCARE RiskSolutionsPrivateLimited,100%CARE AdvisoryResearch andTrainingLimited, 100%CARE Ratings(Africa)PrivateLimited, 78%CARE Ratings(Nepal)Limited, 51%Investors Presentation FY19 3
Diversified Business MixRatings Manufacturing & Services sectorFinancial sectorInfrastructureSmall & Medium EnterprisesStructured FinanceSub Sovereign ratingsAlternate Inv. Fund, Infra. Dev. FundInternational expansion Setup a rating agency in Mauritius andNepal. Exploring neighboring countries,AfricaInformation Analysis & Grading Industry & Customized Research reportsCARE Industry Risk Metrics (CIRM) reportsGrading servicesTrainingValuationsCARE Risk solutions private Ltd. Risk Solutions foroBasel II, Credit risks, Operational risks, FundTransfer Pricing, Asset Liability Mgmt., Valueat risk, Capital Adequacy Ratio, IFRSCARE Advisory Research & Training Ltd. Advisory ServicesTraining ServicesCustomized ResearchInvestors Presentation FY19 4
Experienced & Professional ManagementRajesh Mokashi – MD & CEO Over 32 years of experience in finance, commerce and credit risk sectorsBefore joining CARE, worked for Otis Elevator Company India, DSPFinancial Consultants & Kotak Mahindra FinanceHolds Master of Management Studies degreeQualified Chartered Financial AnalystT N Arun Kumar – Executive Director 27 years of experience in financial servicesBefore joining CARE, worked for The Industrial Finance Corpn. ofIndia Ltd.Holds Bachelor’s degree in Technology (Agricultural Engineering)from IIT – KharagpurPGDM (Agriculture) from IIM ‐ AhmedabadCFA Charter Holder; FRMMehul Pandya – Executive Director 20 years of experience in rating services In charge of International Operations of CARE MBA; CFAInvestors Presentation FY19 5
Experienced & Professional ManagementMilind GadkariSenior Director,Ratings 20yearsofexperience in creditrating, training ofnew recruitsMaster’s degree inmanagementsciences; CFAMadan SabnavisChief Economist 29yearsofexperienceindevelopmentbanking, commercialbanking, engineering&commoditymarkets Masters degree ineconomicsSwati Agarwal JainSenior Director,Business Development 20 years of experiencein credit rating, advisoryand consultancyPGDMRevati KastureSenior Director,Ratings 17 years of experience increditanalysisandresearch services C.A.; Cost AccountantSanjay Kumar AgarwalSenior Director,Ratings Saikat RoyDirector,SME BusinessDevelopment 16years ofexperience increditratingandbankingsector ICWANitin Kumar AgrawalChief Financial Officer 25yearsofexperience in financeandaccounting,taxation, Planning &Analysis,Investorrelations, M&A C.A.22 years of experienceincorporateandinfrastructure finance,risk management andbankingC.A.; ICWAUmesh IkheChief TechnologyOfficer 20yearsofexperience Bachelors Degree inComputer Science;Executive GeneralManagementProgrammefromIndian institute ofManagementAmod KhanorkarSenior Director,Ratings 23 years of experienceincreditrating,valuations and projectappraisalininfrastructure sectorPGDMNavin Kumar JainCompany Secretary 30 yearsofexperience ICSI ; Masters inFinancialServicesManagementInvestors Presentation FY19 6
Shareholding Snapshot as on March 31, 2019100% Public Shareholding‐ Professionally Managed0.07% 0.23%10.45%PSU/GovtPSU BANKS31.69%OTHER BANKSFPI46.65%10.91%MUTUAL FUNDSOTHERSNames of Top 20 ShareholdersHolding %LIFE INSURANCE CORPORATION OF INDIA LIC P & GS FUNDCRISIL LIMITEDFRANKLIN TEMPLETON INVESTMENT FUNDS FRANKLIN INDIASMALLER COMPANIES FUND9.858.90STICHTING DEPOSITARY APG EMERGING MARKETS EQUITY PVIRTUS KAR INTERNATIONAL SMALL‐CAP FUND6.844.34INDIA CAPITAL FUND LIMITED3.55MAWER GLOBAL SMALL CAP FUNDL&T MUTUAL FUND TRUSTEE LIMITED‐L&T EMERGING BUSIN3.493.03BMO INVESTMENTS II (IRELAND) PUBLIC LIMITED CO2.84RUSSELL INVESTMENTS LIMITED1.80BAJAJ HOLDINGS AND INVESTMENT LTD1.69GOVERNMENT PENSION FUND GLOBAL1.50ISHARES CORE EMERGING MARKETS MAURITIUS CO1.32RELIANCE CAPITAL TRUSTEE CO. LTD‐A/C RELIANCESMALLVANGUARD EMERGING MARKETS STOCK INDEX FUND, A SERITATA STEEL LIMITED1.291.291.20GOVERNMENT OF SINGAPORE ‐ E1.17L AND T MUTUAL FUND TRUSTEE LTD‐L AND T TAX ADV1.09VANGUARD TOTAL INTERNATIONAL STOCK INDEX FUND1.08TATA INVESTMENT CORPORATION LIMITED1.05Total for Top 20 Shareholders7.5964.92Investors Presentation FY19 7
Highlights: 03%3.19%Revenue From Operations*‐1.5%1.9%Operating Profit (Without ESOP)‐7.5%‐6.4%Operating Profit (With ESOP)‐10.0%‐8.9%Other Income18.1%19.3%Profit Before Tax (without ESOP charge)‐4.5%‐3.5%ParticularsPerformance during the PeriodTotal IncomeParticularsMarginOperating Profit Margin(without ESOP)Standalone 860.85%64.75%57.71%62.82%Profit After Tax (without ESOP charge) Margin43.91%46.88%42.01%45.70%Operating Profit Margin(with ESOP)56.57%61.88%53.72%60.05%Profit After Tax (with ESOP charge) Margin41.26%45.04%39.52%43.92%*Revenue from Operations and Profit after Tax stated above does not include the effect of revenue policychange resulting in higher revenue of Rs.1958 Lakhs and PAT of Rs. 1360 Lakhs as reported in the audited resultsof corresponding year ended FY18 in previous year.Investors Presentation FY19
Financial Performance(adjusted*)Rs. LakhsStandaloneParticularsRevenue from Operations*Total ExpensesOperating Profit (without ESOP)ESOP ChargeOperating Profit (with ESOP)Other IncomeProfit Before Tax *Provision for TaxProfit After Tax *Operating Profit margin (%)(without ESOP)Operating Profit margin (%) (With ESOP)Profit Before Tax margin (%)(without ESOP)Profit Before Tax margin (%)(With ESOP)Net Profit margin (%) (without ESOP)Net Profit margin (%)(With ESOP)Basic EPS (Rs. per 4.7%61.9%67.5%64.8%46.9%45.0%50.04% .51% .7%‐7.2%* The Company had changed the revenue recognition policy prospectively from FY18. Accordingly, someincome booked in previous year is not available in current year. The revenue for FY18 is higher by Rs. 19.58crore and PAT is higher by Rs. 13.60 crore in FY18. The slides in this presentation compares FY18 numbersexcluding the impact of this changeInvestors Presentation FY19
Financial Performance:FY19 (Rs cr)‐Standalone (adjusted*)Operating Profit Margin (%)(with ESOP)62%61.88%59%56.57%56%53%50%FY18PAT Margin 9Towards the end of the second quarter of FY19 the NBFC sector faced headwinds which impacted the borrowingplans of this crucial segment of the economy. Further the capex related borrowing of the corporate sector alsoremained subdued. As a result, the company’s performance did get impacted. However when looked at theabove backdrop, the company has managed to perform satisfactorily.FY19 Operating profit margin stood at 56.57% & PAT margin moderated to 41.26% mainly due toIncrease in salary cost of Rs.8.05 cr, ESOP cost of Rs.4.09cr, and CSR expenses of Rs.3 cr.*Revenue from Operations and Profit after Tax stated above does not include the effect of revenue policy change resulting in higher revenue ofRs.1958 Lakhs and PAT of Rs. 1360 Lakhs as reported in the audited results of corresponding year ended FY18 in previous year.Investors Presentation FY19
Financial Performance – without adjustmentRs. LakhsStandaloneParticularsRevenue from OperationsTotal ExpensesOperating Profit (without ESOP)ESOP ChargeOperating Profit (with ESOP)Other IncomeProfit Before TaxProvision for TaxProfit After TaxOperating Profit margin (%)(without ESOP)Operating Profit margin (%) (With ESOP)Profit Before Tax margin (%)(without ESOP)Profit Before Tax margin (%)(With ESOP)Net Profit margin (%) (without ESOP)Net Profit margin (%)(With ESOP)Basic EPS (Rs. per 6.9%66.9%69.3%66.8%40.9%46.4%54.10% %47.0%45.3%54.54% ‐13.45%‐10.01%‐14.95%Investors Presentation FY19
Business Performance: FY1925.0Volume of Debt Rated (Rs lk cr)19.9120.016.4812000No of Instruments 65338Short &MediumtermLongterm0Short & Long termBank LoanMediumRatingsterm FY18 FY19Total FY18BankLoanRatings OthersTotalFY19Others majorly came from NSIC/SSI grading, RESCO grading and SME GradingInvestors Presentation FY19
Rating MovementThere has been a moderation in credit quality of entities rated by CARE Ratings in 2018‐19. The credit quality asmeasured by CARE Ratings ‘modified credit ratio’ (MCR), for 2018‐19 came in at 0.95 compared with the ratio of 1.08 in2017‐18. The softening in overall credit quality in 2018‐19 can partly be ascribed to the small enterprises (totalrevenues less than Rs.100 crs), which have seen a decline in credit quality, while the large and medium enterprises havebeen steering the overall stability in credit quality. The stability in rating was noted across sectors with the majority ofsectors having a higher proportion of reaffirmation of credit ratings in 2018‐19.Modified Credit estors Presentation FY19 13
CARE Ratings Debt Quality Index (CDQI)-CDQI showed an improving trend during the first five months of FY19. However, it fell marginally in themonths of September and October’18 and remained more or less stable in the months of November’18– February’2019. It, thereafter, increased in the month of March’19.CDQI nvestors Presentation FY19 14
Economic Backdrop5GDP growth %4.023.02.011.00.00FY18FY19CSO has estimated 7% growth for FY19We are expecting 6.9% for the fiscal yearInvestors Presentation FY19 15
Economic Backdrop%5.04.5 4.44.23.13.02.8 2.93.42.32.22.02.63.22.9WPI .0Apr‐18Oct‐1864.0068.002.0CPI (%)Sep‐1862.003.83.7 5.1Apr‐185.86.04.0Rs/ InflationMay‐187.069.5271.2674.0076.00Investors Presentation FY19 16
Economic BackdropGrowth in Bank Investors Presentation FY19
Economic BackdropGrowth in Sectoral Credit17.830.017.816.425.9625.07.9Rs. Lkah e20.018.016.014.012.0% 10.08.06.04.02.00.0CP 19FY19Oustanding CPsIssuancesMfg services has grown at 11.6% in FY19 comparedwith 6% growth in FY18.Investors Presentation FY19 18
Economic 610,318Corporate Debt Raised (Rs c IssuePrivate Placement FY18 TotalFY19Investors Presentation FY19
Economic BackdropRepo Rate (%) & MCLR(%)12.008.50G Sec Yield 4.00Repo Rate (%)t ngOpin1unMCLR �186.00Apr‐18%7.36 7.397.508.28G Sec Yield (%)Investors Presentation FY19 20
Economy OverviewPositives Easing inflation Increasing bank credit offtake Commercial Paper issuancesrose Fall in interest rates Strengthening RupeeNegatives Subdued economic growth Decline in debt issuances Subdued industrial output Stagnant core sector growthInvestors Presentation FY19 21
Economic Outlook for FY20 GDP growth is expected to be around 6.9% in FY19 and 7.1% inFY20 Inflation expected to be around 4‐4.5% in FY20 contingent uponglobal crude oil prices Exchange rate of Rupee to depreciate by 3.5‐4% during the yearassuming crude oil prices to remain stiff RBI is expected to lower the repo rate by 25‐50 bps depending uponhow inflation pans outInvestors Presentation FY19 22
Thank YouInvestors Presentation FY19 23
1 Registered office: 4th Floor, Godrej Coliseum, Somaiya Hospital Road, Off Eastern Express Highway, Sion (East), Mumbai 400 022 CIN: L67190MH1993PLC071691 Mumbai, 21st May, 2019 FY19 Results The Board of Directors of CARE Ratings approved the quarter ended March 2019 and financial year