Transcription
Muhammad Naveed BUTT, Qaisar Ali MALIK, Abdul WAHEED, Aftab Hussain TABASSUM /Journal of Asian Finance, Economics and Business Vol 8 No 12 (2021) 0129–0139129Print ISSN: 2288-4637 / Online ISSN 2288-4645doi:10.13106/jafeb.2021.vol8.no12.0129Tax Planning, Financial Constraints and InvestmentManagement: Empirical Evidence from PakistanMuhammad Naveed BUTT1, Qaisar Ali MALIK2, Abdul WAHEED3, Aftab Hussain TABASSUM4Received: May 15, 2021Revised: July 24, 2021 Accepted: November 01, 2021AbstractThe aim of this study is to provide insight into tax avoidance through planning and management, and its investment consequencesin financially constrained and unconstrained firms, as well as to empirically examine the interrelationships between the variablesstudied. Data was extracted from the financial statement analysis of non-financial companies listed on the Pakistan stock exchange(PSX) published by the State Bank of Pakistan, covering ten major manufacturing sectors. KZ index and WW index are used toidentify financially constrained and unconstrained firms. Tax avoidance is measured by using GETR and LETR. All the equationsare estimated through panel data regression models using common, fixed, and random effects. The empirical investigation of therole of tax avoidance in all firms collectively and constrained and unconstrained firms separately showed that the tax avoidancebehavior of these firms is translated into investments by these firms. The study will help policymakers in strategy formulation andimplementation related to tax planning and investment decisions in constrained and unconstrained firms to overcome their financialconstraints and to optimize their investment decisions for value maximization. This will substantially increase the investment in thecountry by providing growth opportunities and lowering the tax rates.Keywords: Tax Avoidance, Financial Constraints, Investments, Cash Flows, PakistanJEL Classification Code: G30, G38, G391. IntroductionCapital structure choices are considered to be irrelevantfor investment purposes in perfect capital markets(Modigliani & Miller, 1958). However, under marketimperfections, studies have been significantly showingthe relevance of internally generated funds and investmentdecisions of firms (Stein, 2003). Managers are moreFirst Author. Department of Business Administration, Faculty ofManagement Sciences, Foundation University Islamabad, Pakistan.2 Department of Business Administration, Faculty of ManagementSciences, Foundation University Islamabad, Pakistan.3 Corresponding Author. Department of Business Administration,Faculty of Management Sciences, Foundation University Islamabad,Pakistan [Postal Address: FURC, New Lalazar, Rawalpindi, Punjab,Pakistan] Email: dr.abdulwaheed37@gmail.com4 Department of Business Administration, Faculty of ManagementSciences, Foundation University Islamabad, Pakistan.1 Copyright: The Author(s)This is an Open Access article distributed under the terms of the Creative Commons AttributionNon-Commercial License (https://creativecommons.org/licenses/by-nc/4.0/) which permitsunrestricted non-commercial use, distribution, and reproduction in any medium, provided theoriginal work is properly cited.inclined towards internal resources because externallygenerated funds are more expensive (Fazzari et al., 1988),therefore they generate cash flows from sources other thanthe company’s main operations. One of the techniques usedby managers to generate funds internally is by reducingtax liability, which may be termed as tax avoidance hereonwards. Tax avoidance explicitly improves the cashflows after tax that may be further used for investmentand growth purposes. Thus, tax avoidance measures mayhave a significant influence on the investment decisions offirms. However, it must be noted that a firm involved in taxavoidance may enhance the moral hazard issues due to theincreased information asymmetry between the shareholdersand managers. Furthermore, it is necessary to determineand assess whether the links between tax avoidance andinvestment decisions substantiate business growth or areonly an aggravation of overinvestment by management toimprove accounting figures.Since firms possessing positive free cash flows withfewer investment options tend to have more internalresources and are less financially constrained, they areless likely to default as against those firms possessing
130Muhammad Naveed BUTT, Qaisar Ali MALIK, Abdul WAHEED, Aftab Hussain TABASSUM /Journal of Asian Finance, Economics and Business Vol 8 No 12 (2021) 0129–0139negative free cash flows and lesser internal resourcesand are more financially constrained. As a result, when itcomes to tax avoidance methods, both types of firms actdifferently. The financially unconstrained firms with moreinternally available funds generally do not engage in taxavoidance for growth and investment purposes whereasthe financially constrained firms with lesser internallyavailable funds are more involved in tax avoidance fortheir growth and investment purposes.The study will provide an understanding of tax avoidanceconsequences in financially constrained and unconstrainedfirms along with empirically testing the interlinkagesbetween the studied variables. It will help policymakersin strategy formulation and implementation related totax planning and investment decisions in constrained andunconstrained firms to overcome their financial constraintsand to optimize their investment decisions for valuemaximization. The current research is also useful for thecorporate managers of developing countries where themajority of the firms have concentrating ownership in thehands of founding families or institutional investors (Maliket al., 2021; Waheed & Malik, 2019, 2021).Earlier studies are more focused on measuring andfinding determinants of tax avoidance (Waheed & Malik,2019; Shackelford & Shevlin, 2001) effects of taxavoidance on capital structure decisions (Graham & Tucker,2006), linkages between tax avoidance and cash holdings(Dhaliwal et al., 2011), tax avoidance and firm value(Koester, 2011), and tax avoidance and investors’ reaction(Kim et al., 2010). Yet there is a need to further explore thecauses and effects of tax avoidance (Hanlon & Heitzman,2010). The present study contributes to the existingliterature by exploring the linkages between tax avoidanceand investment strategies in financially constrained andunconstrained firms, by providing empirical evidence onthe observed and hypothesized relationships.2. Literature Review andHypothesis Development2.1. Capital Structures andInvestments StrategiesUntil recently, researchers all across the world desiredto investigate the links between financial constraintsand tax avoidance and come up with some generalizablefindings. Originating from Keynes (1936) theory ofinvestment that financial and monetary conditions may affecta firm’s capital expenditure (investment) to Modigliani andMiller (1958) who observed a positive relation betweengrowth opportunities and debt performance of firms, ithas been revealed that firms having growth opportunitiesnever prefer to finance through external sources. However,Modigliani and Miller (1958) came up with a new idea thatunder a perfect market, the investment decisions of the firmsare independent of the sources of finance, and internal andexternal sources of finance are perfect substitutes. Brainardand Tobin (1968) concluded that managers never make newinvestments unless the marginal cost and marginal benefitsbecome equal along with the investment opportunities.Myers and Majlif (1984) discussed that under positive netpresent value projects, firms are mostly unable to obtainexternal finance due to capital rationing.Myers and Majlif (1984) added support to their findingand said that firms facing financial constraints should holdtheir cash to avoid future investment problems. Myers andMajluf (1984) disagreed with Miller’s propositions andcame up with evidence that external sources of financeare not perfect substitutes for a firm’s internal capital. Inaddition, Fazzari et al. (1988) supported this concept byempirically proving that internal finances are much cheaperthan the external sources of finances. However differentstudies conducted on the issues such as informationasymmetries in capital markets and the effects of capitalstructure decisions, suggested that financial structures ofthe firms do have an effect on investment decisions. Titmanand Wessels (1988) argued on growth opportunities andfound a negative relation between leverage and growthopportunities. According to Kim et al. (1998), capitalmarket imperfections cause a positive relationship betweeninternal sources of finance and investment, and cashholdings are more valuable for firms, so firms hoard morecash when external sources of finance are insufficient tomeet their internal capital needs. Stein (2003) mentionedthat several theorists posit that under capital marketimperfections, firms may be forced to rely on their internalsources of funds for their investments. Almeida et al. (2004)added support to the literature by providing evidence thatfirms facing problems in raising finance from outsidesources save a major portion of their cash flows for futureinvestments. Chen and Zhao (2006) also documented astrong relationship between investment opportunities andinternal resources of the firm and indicated managers torely on cash generated by the firm, and added support tothe literature by proving that external sources are alwayscostlier than a firm’s own sources.2.2. Financial ConstraintsFinancial constraints are those obstacles that preventthe firms from their desired investments. The reasonfor these obstacles could be credit constraints, equityissuance problems, dependence on financial institutions,or illiquidity of assets (Lamont et al., 2001). Kaplan and
Muhammad Naveed BUTT, Qaisar Ali MALIK, Abdul WAHEED, Aftab Hussain TABASSUM /Journal of Asian Finance, Economics and Business Vol 8 No 12 (2021) 0129–0139Zingales (1997) developed the KZ index, which uses cashflows, leverage, business size, and age to differentiatebetween financially constrained and unconstrained firms.Using cash flows, dividend payout, industrial growth, andsales growth, Whited and Wu (2006) created an index toindicate financially constrained enterprises. Both KZand WW index gave a negative score to cash flows ofconstrained firms which shows that constrained firms arealways concerned about their cash savings through anypossible means. These two indicators are widely used byrecent researchers to identify and segregate constrainedfirms and unconstrained firms (Kaplan & Zingales, 1997;Lamont et al., 2001; Livdan et al., 2009; Li, 2011; Whited& Wu, 2006). Faulkender and Wang (2006) observed thatfinancially constrained firms have a stronger relationbetween cash flows and stock returns. They explainedthe differential impact of cash holdings in financiallyconstrained firms as against financially unconstrainedfirms, concluding that financially constrained firms havinghigh investment needs tend to hold more cash as againstfinancially unconstrained firms.2.3. Tax AvoidanceTaxes are one of the major contributors in anyeconomy and firms have always been involved invarious forms of tax planning. Hanlon and Hietzman(2010) defined tax avoidance as the reduction of explicittaxes. Chen et al. (2010) defined tax aggressiveness asdownward management of taxable income to reduce taxpayments to tax authorities. Tax avoidance is a legalmeasure of reducing taxable income, but tax evasion isnot paying all or a part of tax illegally. Representationtheory indicates that firms always use incentives toreduce taxes by aggressive tax planning, however, Wang(2010) highlighted that tax avoidance activity may notincrease wealth or capital due to costs firms face in taxavoidance activities. Slemrod (2004) developed the ideathat shareholders set the level of tax aggressiveness bysetting managers’ compensation with effective tax rates.Gupta and Newberry (1997) mentioned firm size, industrytype, and incentives as a measure for tax avoidance andlinked it to GAAP ETR (general accepted accountingprinciples effective tax rates) while other researchersused rewards, organizational structure, and ownership asa stimulant to tax avoidance. Previous researchers haveused GAAP ETR and Long-run ETR in their studies(Dyreng et al., 2008).Further studies on tax avoidance show how firms savetheir taxes and what are the reasons for engaging in taxavoidance. Cheng et al. (2012) empirically proved thatfirms engage in more tax avoidance behavior after theirhedge fund transfer. Dyreng et al. (2010) used long-run131cash effective tax rates as a measure of tax avoidance overa period of 10 years. Recently researchers have tested thefinancial effect of tax avoidance on leverage (Graham &Tucker 2006), cash holding (Dhaliwal et al., 2011), investorreturn (Hanlon & Slemrod, 2009; Kim et al., 2010), andfirm value (Koester, 2011; Wang, 2010). Financiallyconstrained firms more aggressively engage in tax savingbehavior than financially unconstrained firms becausefinancial constraint firms have problems in raising externalfinances, therefore, they use their cash savings from taxavoidance to mitigate their investment problems. Mayberry(2012) in her working paper also explained that firms usetheir cash savings from tax avoidance to overcome theirinvestment issues.2.4. HypothesesThe above-discussed literature regarding capitalstructure, investments, growth, financial constraints, andtax avoidance strategies, fairly allows to develop theunder-mentioned hypotheses to be empirically tested andinvestigated statisticallyH1: Firms with more growth opportunities tend toinvest more.H2: Firms with more cash flows tend to invest more.H3: Firms with more tax avoidance practices tend toinvest more.H4: Financially constrained firms with more taxavoidance practices tend to invest more.H5: Financially unconstrained firms with more taxavoidance practices tend to invest more.3. Research Methods3.1. Data SourceData for different variables used in the study wasextracted from financial statement analysis of nonfinancial companies listed on the Pakistan stock exchange(PSX), published by the State Bank of Pakistan. Thereport includes 10 major manufacturing sectors namelyTextile, Pharmaceutical, Automobile, Tobacco, Chemicals,Oil &Gas, Food, Industrial Metal, Cement, ElectricalMachinery, and Paper Products.3.2. Period of StudyThe study takes into consideration the year 2011 to2015 for empirically testing the hypothesized relationships,however, the data for some of the variables used in thestudy was taken from the year 2007 to observe lead-lagconsiderations.
Muhammad Naveed BUTT, Qaisar Ali MALIK, Abdul WAHEED, Aftab Hussain TABASSUM /Journal of Asian Finance, Economics and Business Vol 8 No 12 (2021) 0129–01391323.3. Unit of AnalysisListed manufacturing sector firms were the unit ofanalysis as per the nature of the study and the requirements ofempirical analysis. For measuring the variable of investments,311 firms were included in the study covering years2007–2015, thus having 2799 firm-year observations. Forthe purpose of measuring tax avoidance behavior, only thoselisted manufacturing companies were filtered and pickedwhich have positive net income throughout the estimationperiod year 2011–15. The estimation period 2011–15 offersan exciting opportunity in a way that during this periodPakistani firms went through the peak and crust of theeconomy. For tax avoidance proxies, data of 129 companieswas obtained by taking the average of five financial yearsreducing the data to 645 firm-year observations.3.4. Operationalization of Variables3.4.1. InvestmentsFor measuring the firm investment the study consideredan augmented version of the Fazzari et al. (1988) investmentequation.Invi,t β 0 β1Qi,t 1 β2CFi,t 1 β3AGEi,t β4SIZEi,t 1 β5LEVi,t 1 εi,t (1)Where,Invi,t is the net capital expenditure of the firm in yeart scaled by the beginning year total assets of the firm.Qi,t 1 is used as a proxy for the growth opportunity of thefirm (given by Tobin’ Q) and calculated as the market valueof the firm scaled by total assets.CFi,t 1 is calculated as the firm’s operating cash flow ofthe firm in year t 1 scaled by the average total assets ofthe firm.LEVi,t 1 is the leverage ratio of the firm calculated aslong-term debt over the total assets of the firm.SIZEi,t 1 is calculated as the natural log of the firm’stotal assets.3.4.2. Financially Constrained andUnconstrained FirmsKZ index (Kaplan & Zingales, 1997) and WW index(Whited& Wu, 2006) are used to identify financiallyconstrained and unconstrained firms.For the KZ index, Growth opportunities and leverage ofthe firm are given positive weight whereas cash balances,operating cash flows, and dividends are given negativeweights. Firms having a higher value of the KZ index areconsidered financially constrained as the difference betweenthe internal and external sources of finances for those firmsincreases. It is calculated as:KZi,t 1.002 (CFOi,t/TAi,t 1) 39.368 (DIVi,t/TAi,t 1) 1.315 (CSHBALi,t/TAi,t 1) 3.129LEVi,t 0.238Qi,tWhere the CFOi,t/TAi,t 1 is the operating cash flowbalance of the year scaled by beginning year total assets ofthe firm, DIVi,t/TAi,t 1 is cash dividend paid by the firm scaledby beginning year total assets, CSHBALi,t/TAi,t 1 is the cashbalances of the firm over lagged total assets, LEVi,t is theratio of total debt to total assets and Qi,t is market to bookvalue of the firm given by Tobin’ Q as growth opportunities.WW index is calculated as:WWi,t 0.091CFOi,t/TAi,t 0.062DIVDUMi,t 0.021LTDi,t/TAi,t 0.044LogTAi,t 0.102INDSGi,t 0.035SGi,tWhere DIVDUMi,t is the dummy variable which isequal to one if the firm pays cash dividend otherwise zero,LTDi,t/TAi,t is the long term debt over lagged total assets,INDSGi,t is firm’s two-year industrial sales growth andlast, SGi,t is the sales growth of the firm in year t.Both KZ and WW indexes are used to identify thefinancial constraints of the firm. Earlier literature stronglysuggested that the firms with higher values of KZ andWW indexes are considered financially constrained.All the firms were sorted into quintiles based on thecalculated indices. Firms lying in the 4th and 5th quintilesare considered financially constrained and those lying inthe 1st and 2nd are considered unconstrained firms. Forheteroscedasticity measurement; Breusch-Pagan/CookWeisberg test was used. Winsorized means for variablesare used, being a robust estimator in all equations whereheteroscedasticity is detected.3.4.3. Tax AvoidanceTax avoidance is measured first by using GETR –Generally Accepted Accounting Principles Effective TaxRate (Dryeng et al., 2008; Mayberry, 2012) and then byusing LETR – Long Term Effective Tax Rate (Dyrenget al., 2008).GETRi,t TaxExpi,t/EBTi,tWhere the firm’s GAAP effective tax rate is equalto the total tax expenses divided by the firm’s earningsbefore tax.
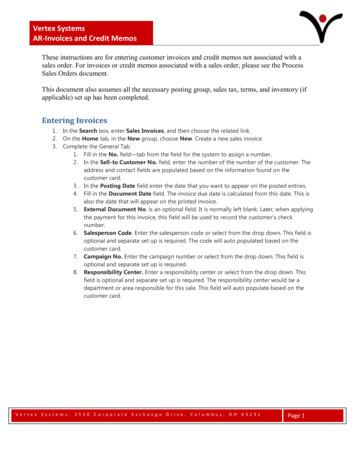
Muhammad Naveed BUTT, Qaisar Ali MALIK, Abdul WAHEED, Aftab Hussain TABASSUM /Journal of Asian Finance, Economics and Business Vol 8 No 12 (2021) 0129–01394. Results and DiscussionLETRi,t Average TaxExpi,t / Average EBTi,tThe tax avoidance measured as LETR focused onlong-run effective tax rates. It is also calculated as GETRbut the sum of tax expenses over the five-year period isdivided by the sum of earnings before tax over the periodof five years.3.4.4. Tax Avoidance and Investment DecisionsThe residuals εi,t obtained from the above equation (1)will be used as a proxy for unexplained investment (Rinvi,t)that will be explained by the previous year’s tax avoidancein the following equation.Rinvi,t β 0 β1TaxAvoidancei,t 1 Yeari,t Industryi,t εi,t (2)The tax avoidance equation is measured for boththe constrained and unconstrained firms and a negativesignificant coefficient of tax avoidance in the case ofconstrained firms shows that tax savings are used toovercome investment problems faced by the firms thathave limited or expensive access to external financialsources.All the equations are estimated used common,fixed, and random effect panel data regression models.Sometimes due to large observations packed in a smalltime period, fixed and random effect models giveconflicting results. In such cases, we used the Hausmantest under the following hypothesis.H1 fixed effects is acceptedH0 random effects is accepted1334.1. Descriptive StatisticsThe descriptive statistics (Table 1) showed thatinvestment has a mean of 5% while cash flow and leveragehave mean values of 11.5% and 15.6% respectively. Themean value of firm age is 31 years, firm size has a meanvalue of 14.5% and growth opportunities have a mean valueof 2.8. It shows that overall firms had growth opportunitieswhile their leverage ratio is more than their internal cashflow. Since this is the long-term debt, Pakistani firmsgenerally use external funds to finance their investmentand are supposed to invest less as compared to firms with alesser leverage ratio. However, the mean value of cash flowis 11.5% that may indicate that Pakistani firms are also usinginternal cash flows for investment purposes. There are 2798observations of investment equation and 645 observationsof variables used in tax avoidance as firms with negativepretax income were excluded from the study. The meanvariables of financial constraints showed that 40% of thefirms used in the study are financially constrained when theKZ index is used whereas 42%of the firms are consideredfinancially constrained when the WW index is used asthe measure of financial constraints. The measure of taxavoidance variables GETR and LETR have mean values of24.7 and 24.1 respectively.4.2. Inferential StatisticsThe correlation between the variables (Table 2) used inthe study indicated that there is no significant correlationamong the independent variables thus the estimation is freefrom multicollinearity.Table 1: Descriptive StatisticsVariablesObsMeanStd. devMinMaxwinv27980.0490.111 0.1390.280Wcf27970.1150.095 .4190.4940.0001.000
Muhammad Naveed BUTT, Qaisar Ali MALIK, Abdul WAHEED, Aftab Hussain TABASSUM /Journal of Asian Finance, Economics and Business Vol 8 No 12 (2021) 0129–0139134Investment equation results (Table 3) were obtainedusing common, fixed, and random effect panel dataestimation techniques. The common effect model assigns apositive significant coefficient to Tobin’s Q, cash flow, age,size, and leverage while the fixed effect model assigns anegative significant coefficient to age whereas the randomeffect model also replicates the same coefficients as in thecommon effect model. The Hausman test p-value of (0.000 0.05) indicates that H1 must be accepted, which is toconsider the results of the fixed effect model. As Tobin’s Q(growth opportunities) is assigned a positive significantcoefficient (t-value 2.5, p-value 0.012 0.05), thisindicates that growth opportunities have a positivesignificant impact on investment by the firm.Our results are consistent with prior studies conductedby Fazzari et al. (1988). Cash flow has a positive significantcoefficient t-value of 16.68 with (p-value 0.00 0.01) forthe investment of the firm. This result is in accordance withprevious studies (Fazzari et al., 1988; Modigliani & Miller,1958; Lamont et al., 2001; Mayberry, 2012). This showsthat Pakistani firms use internal cash to conduct investmentactivities. The more cash savings from operations, the morethe investment will be. The fixed effect model also revealsthat leverage has a positive significant coefficient t-valueof 1.86with (p-value 0.062 0.1). Since this is the proxyfor long-term debt it can be inferred that external financesare also used by Pakistani firms to finance investments.Firm size has a positive significant coefficient of t-valueof 6.06 with (p-value 0.00 0.01), which shows that sizehas a positive impact on investment. If the size of thecompany is large the investment made by the firm will alsobe large as compared to smaller firms and our results inaccordance with the study of Kadapakkam et al. (1998).Last, age has a negative significant coefficient having at-value of 3.62 (p-value 0.00 0.01), which shows thatfirm age has a negative impact on its investment decisions.Table 2: Correlation MatrixVariables12345678910winv (1)1.000wcf (2)0.3451.000wage (3) 0.022 0.040wsize (4)0.2180.3870.1501.000wlev (5)0.042 0.119 0.041 0.0721.000wtq (6)0.068 0.075 0.1250.1360.2021.000wrinv (7)0.0180.0320.006 0.0220.056 0.0361.000wgetr (8) 0.012 0.007 0.0200.0670.1120.180 0.1201.000wletr (9) 0.014 0.035 0.045 0.0060.1160.153 0.0910.7221.000kz Index (10)0.0620.0160.037 0.024 0.017 0.0380.113 0.050 0.0761.000ww Index (11)0.056 0.088 00Table 3: InvestmentsCommon Effect: Dep. Variable InvFixed Effect: Dep. Variable InvRandom Effect: Dep. Variable InvwinvCoef.Std. Errt-statP t Coef.Std. Errt-statP t Coef.Std. Errz-statP z 549 0.0040.001 .7700.000 0.1200.021 5.6700.000 0.4860.083 5.8500.000 0.1200.021 5.6700.000consP-value Hausman Test 0.000
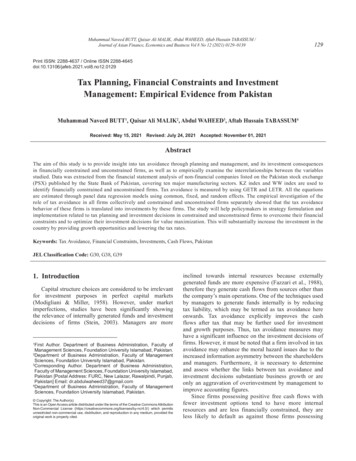
Muhammad Naveed BUTT, Qaisar Ali MALIK, Abdul WAHEED, Aftab Hussain TABASSUM /Journal of Asian Finance, Economics and Business Vol 8 No 12 (2021) 0129–0139This indicates that firms with more age invest less as theyare at their stage of maturity and are less concerned aboutexpansion. Hence, they invest less as compared to thenewly incorporated firms which are at the growth stage.Our results are consistent with the study of Azam andShah (2011) conducted on Pakistani firms determining theinternal financial constraint and investment.The results of the common, fixed, and random effectmodel for the proxies of tax avoidance (Table 4) usingGETR and LETR depicted that the tax avoidance proxyof GETR has a negative significant coefficient in thecommon effect model while it remains the same in thecase of fixed and random effect models. The Hausman testshows that the results of the fixed effect model must beaccepted. Meanwhile, the tax avoidance proxy LETR has anegative significant coefficient in the case of the commonand fixed effect models but an insignificant coefficientin the random effect model. Hence, the Hausman testshows that the results of the random effect model mustbe accepted. The fixed effect model assigns a negativesignificant coefficient for GETR which indicates theaverage tax paid by the firm. This indicates that the lessertax paid by the firm in the previous year is translated intoinvestment by the firm. However, in the case of LETR, wefound a negative but insignificant coefficient that showsthat in the long run, the average tax reduction will causeinvestment to rise in the future.The result of constrained firm tax avoidance behaviorsand its impact on investments (Table 5) were obtained135through all three models using GETR and LETR and itshowed that the common and random effect models ofconstrained firms using the KZ index assign a negativesignificant co-efficient to GETR while the fixed effectmodel assigns a negative and insignificant coefficient toLETR. The Hausman test shows that the results of therandom effect model must be accepted, which shows thatconstrained firms save taxes and the tax savings are in turnused for investment.The same results were obtained again for financiallyconstrained firms based on the WW index (Table 6) whichexplains the phenomenon that Pakistani firms facing financialdistress use the cash saved from tax savings to finance theirinvestment. The results from the study of constrained firmanalysis are in line with practices followed by Pakistanifirms relying heavily on internal financial resources for theirinvestment activities as already evidenced in Table 3. Thecash saved by paying lesser taxes is used to finance positiveNPV projects. Our results conform with previous studies(Mayberry, 2012; Myers & Majluf, 1984).In accordance with the results shown in the above tables,we can say that constrained firms aggressively engage in taxavoidance behaviors. Short-run and long-run tax avoidancepractices of financially constrained firms are reflectedin our results that financially constrained firms mainlyfocus on tax savings to save cash and use cash savings fortheir future investment projects. KZ index supported thenegative significant relationship between tax avoidance andinvestments while using GETR in financially unconstrainedTable 4: Tax Avoidance and Investment (All Firms)Tax Avoidance: Using GETRTax Avoidance: Using LETRCommon Effect Model: Dependent Variable Re-InvestmentwrinvCoef.Std. Errt-statP t wrinvCoef.Std. Errt-statP t wgetr 1 0.0280.011 2.6200.009wletr 1 0.0070.013 .000consFixed Effect Model: Dependent Variable Re-InvestmentwrinvCoef.Std. Errt-statP t wrinvCoef.Std. Errt-statP t wgetr 1 0.0440.017 2.5400.012wletr 1 0.0610.041 0.000consRandom Effect Model: Dependent Variable Re-InvestmentStd. Errz-statP z wrinvCoef.Std. Errz-statP z 0.0300.011 2.6800.007wletr 1 0.0090.014 .000wrinvCoef.wgetr 1consp-value Hausman Test 0.2875p-value Hausman Test 0.1526
Muhammad Naveed BUTT, Qaisar Ali MALIK, Abdul WAHEED, Aftab Hussain TABASSUM /Journal of Asian Finance, Economics and Business
causes and effects of tax avoidance (Hanlon & Heitzman, 2010). The present study contributes to the existing literature by exploring the linkages between tax avoidance and investment strategies in financially constrained and unconstrained firms, by providing empirical evidence on the observed and hypothesized relationships. 2. Literature Review and