Transcription
Ecosystems (2005) 8: 644–656DOI: 10.1007/s10021-003-0110-7Contrasting Effects of Substrate andFertilizer Nitrogen on the EarlyStages of Litter DecompositionSarah E. Hobbie*Department of Ecology, Evolution and Behavior, University of Minnesota, 100 Ecology, 1987 Upper Buford Circle, Saint Paul,Minnesota 55108, USAABSTRACTCommonly observed positive correlations betweenlitter nitrogen (N) concentrations and decomposition rates suggest that N frequently limits decomposition in its early stages. However, numerousstudies have found little, if any, effect of N fertilization on decomposition. I directly comparedinternal substrate N and externally supplied inorganic N effects on decomposition in sites varying insoil N availability. I decomposed eight substrates(with initial %N from 0–2.5) in control and N-fertilized plots at eight grassland and forest sites incentral Minnesota. N fertilization increaseddecomposition at only two of eight sites, eventhough decomposition was positively related tolitter N at all sites and to soil N availability acrosssites. The effect of externally supplied N ondecomposition was independent of litter N concentration, but was greater at sites with low Navailability. The inconsistent effects of substrateand externally supplied N may have arisen becausedecomposers use organic N preferentially as an Nsource; because inorganic N availability across sitesor with fertilization induced changes in microbialcommunity attributes (for example, lower C:N orgreater efficiency) that reduced the response ofdecomposition to increased inorganic N supply; orbecause the positive correlation between litter N orsite N availability with decomposition was spurious, caused by tight correlations between litter orsite N and some other factor that truly limiteddecomposition. These inconsistent effects of substrate N and external N supply on decompositionsuggest that the oft-observed relationship betweenlitter N and decomposition may not indicate Nlimitation of decomposition.INTRODUCTIONdecomposition in its early stages. Indeed, manystudies indicate that microbes import N intodecomposing litter during initial decay (for example, Gosz and others 1973; Staaf and Berg 1981;Frey and others 2000). Furthermore, strong positive correlations that are sometimes observed between initial litter N concentrations anddecomposition rates also suggest that N frequentlylimits decomposition (Melillo and others 1982;Enriquez and others 1993), particularly in the earlystages (Berg and Matzner 1997).Yet, despite compelling indirect evidence that Noften limits decomposition, studies that have addedN in the form of fertilizer show inconsistent effectsKey words: decomposition; fertilization;Minnesota; nitrogen; nutrient limitation.Although nitrogen (N) has been shown to limitplant growth in a number of different ecosystems(Vitousek and Howarth 1991), the evidence for Nlimitation of decomposition is murky at best.Decomposers have lower carbon (C) to N ratiosthan does most fresh litter, suggesting that litter Ncontent is frequently insufficient to support use oflitter C, even given microbial inefficiency, andestablishing the potential for N limitation ofReceived 29 July 2003; accepted 29 April 2004; published online 9September 2005.*Corresponding author; e-mail: shobbie@tc.umn.edu644litter;
Nitrogen Effects on Decompositionon decomposition (Fog 1988). Some studies havefound no effect of N fertilization on decomposition(for example, Van Vuuren and Van der Eerden1992; Prescott 1995; Hobbie and Vitousek 2000;Johnson and others 2000), other studies have foundpositive effects of N fertilization on decomposition(for example, Hunt and others 1988; Conn and Day1996; Hobbie 2000; Vestgarden 2001), and stillothers have found negative effects of N fertilizationon decomposition (for example, Gill and Lavender1983; Prescott 1995; Magill and Aber 1998).Understanding the inconsistencies between theinfluence of litter N and fertilizer N on the earlystages of decomposition is necessary for predictinghow decomposition (and thus ecosystem carbonbalance) responds to elevated N inputs resultingfrom human activities. Yet, few studies have directly compared the effects of substrate N withthose of N added as fertilizer, and these studieshave been relatively limited in scope. Some reportsimilar positive effects (Reinertsen and others 1984;Vestgarden 2001), similar neutral effects (Prescott1995), or contrasting effects of substrate andexternally supplied N (Pastor and others 1987).Here I report the most comprehensive study to datethat directly compares the effects of substrate N andexogenously supplied N on decomposition. Specifically, I test the following hypotheses:Hypothesis 1. In N-poor ecosystems, both exogenous N and substrate N limit the rate of initial litterdecomposition and N received from the environment and from decomposing substrates are equivalent N sources to decomposers.Hypothesis 2. Exogenous N limits decompositionmore strongly for low-N substrates than for high-Nsubstrates, because of relatively greater N demandby decomposers breaking down low-N substratescompared to high-N substrates.Hypothesis 3. Exogenous N limits decompositionmore strongly in sites with low N availability, because of relatively greater N demand by decomposers breaking down litter in low-N compared tohigh-N sites.To test these hypotheses, I established a decomposition experiment at eight different sites at theCedar Creek Natural History Area (CCNHA) inCentral Minnesota, a site with poorly developedsoils that have low N availability. At each site, Iestablished an N-fertilization experiment in which Idecomposed an array of substrates that varied intheir initial N concentration to directly compare theeffects of exogenous N added as fertilizer with effects of variation in initial substrate N concentration on decomposition, testing Hypothesis 1. To testHypothesis 2, I compared the magnitude of N fer-645tilization effects on decomposition of substratesvarying in their litter N concentration. And finally,to test Hypothesis 3, I examined relationships between the magnitude of N fertilization effects ondecomposition and site N availability. In this study Ifocus exclusively on the first year of decomposition, because N limitation is expected to be strongest in the early stages of litter decomposition,when decomposing litter has its lowest N content.Interactions between lignin and N in the laterstages of decomposition (Berg 1986; Fog 1988; Bergand Matzner 1997; Carreiro and others 2000) willbe explored in a later paper.MATERIALS AND METHODSStudy SiteCCNHA is a Long Term Ecological Research (LTER)site 60 km north of Minneapolis, Minnesota andcomprises a mosaic of wetlands, old fields, prairieand savanna remnants, and hardwood and pinestands on sandy, poorly developed soils (Grigal andHomann 1994). N limits net primary production(NPP) (Tilman 1984). I established an experimentto assess limitation by exogenous (soil) andendogenous (substrate) N of decomposition at eightupland sites within CCNHA, including two oldfields (dominated by Schizachyrium scoparium andother C4 and C3 grasses), a mixed hardwood(maple-basswood) stand (dominated by Acer saccharum, Tilia americana, and Quercus ellipsoidalis), abigtooth aspen stand (dominated by Populusgrandidentata), two pin oak stands (dominated byQuercus ellipsoidalis), and two white pine stands(dominated by Pinus strobus). Sites are within 5 kmof one another and have soils classified in the sameGreat Group (Udipsamments) (Grigal and others1974).Decomposition ExperimentWithin each site, I established twelve 2.5 m · 2.5 mplots. Six plots were left as control plots, and sixwere randomly chosen to receive 10 g N m)2 y)1 asNH4NO3 in solution, beginning in October 1999. Iapplied fertilizer by spraying 1 L of NH4NO3 solution (or water, for control plots) over each plot inthree applications each year (May, July, October).To examine effects of endogenous (substrate) Non decomposition, as well as interactions betweenexogenous and endogenous N, I measureddecomposition rates of eight substrates that vary intheir initial N concentrations (and C chemistry, seebelow) within each plot. Substrates included leaflitter of Schizachyrium scoparium, Acer saccharum,
646S. E. HobbieQuercus ellipsoidalis, and Pinus strobus, green leavesof Acer saccharum and Quercus ellipsoidalis, cellulosefilter paper (Whatman number one), and commercially available untreated birch wood applicators (14.5 · 0.2 cm) as a wood substrate (CottonTail Medical Products quality wood applicators,CITMED, Citronelle AL). Pure leaf litter of Schizachyrium was obtained from Prairie Restorations,Inc. (Princeton MN). Leaf litter of Acer, Quercus, andPinus was collected in autumn 1998 by picking upfreshly fallen litter from the ground in severalstands. Litter collected from different stands wasthoroughly mixed for each species and air-dried at22 C. Green leaves of Acer and Quercus were collected in mid-July 1999 by pruning branches fromunderstory individuals of Acer in a sugar-maplebasswood stand and from short-statured canopyindividuals of Quercus in a savanna site and stripping branches of all green leaves. Green leaveswere also air-dried.I constructed 400 cm2 litter bags using fine-meshpolyester (200 lm) bottoms and small-mesh (0.3mm) tops. Fine-mesh bottoms were used to minimize contamination of the litter bags by sand, butstill allow fungal colonization of the litter (fungalhyphal diameter 3--8 lm, Richards 1987); hyphalconnections between the underlying soil and thelitter bags were visible with the naked eye uponcollection. The mesh size of the tops (0.3 mm) didnot exclude most soil fauna (for example, earthworms and insect larvae were found inside bagsupon harvest). Approximately 6 g (air-dry mass) ofeach substrate were placed in each bag. Exceptionswere filter paper and wooden dowels: three piecesof filter paper ( 3.8 g) and 3 wooden dowels ( 1 g)were used per bag. Subsamples of each substratewere used to develop air-dry to oven-dry (65 C)conversions and were analyzed for initial concentrations of C and N (n 5) by combustion on aCarlo-Erba CHN Analyzer (Carlo Erba Instruments,Milan Italy) and for phosphorus (P) and base cations (n 3) by inductively coupled argon plasmaemissions spectometry (ICP, Applied ResearchLaboratory 3560) following digestion in 10% HCl(Munter and Grande 1981) at the University ofMinnesotaÕs Research Analytical Laboratory. Asingle subsample of each substrate was analyzed forC fractions using Forest-Products techniques (Ryanand others 1989) at the Center for Water and theEnvironment (Natural Resources Research Institute, University of Minnesota, Duluth). Fractionsdetermined included nonpolar extractives (NPE:fats, oils, waxes), water-solubles (WS: amino acids,simple sugars, soluble phenolics), acid-solubles(AS: cellulose, hemicellulose, starch, polypeptides,nucleic acids), and acid-insolubles (hereafter, lignin). Carbon fractions are presented on an ash-freedry mass basis.In early December 1999, six strings with each ofthe eight substrates (in random positions along thestring) were placed on the soil surface in each ofthe twelve plots (6 control and 6 N-fertilized)within each site, with enough strings for harvestsin spring and fall 2000, and in fall of 2001–2004(4608 total bags). Here I present results from thefirst yearÕs harvests (17 April and 8 October, 2000).Harvested substrates were cleaned of soil, plantroots, invertebrates, and so on, dried (65 C) andweighed. Decomposition was calculated as theproportion initial mass remaining.Substrate Nitrogen DynamicsI determined substrate N concentration on harvested litter using near-infrared reflectance spectroscopy (NIRS) (Gillon and others 1999). For eachof the two harvests, one of the eight sites wasrandomly chosen to generate separate calibrationsfor each harvest. Harvested litter from these siteswas analyzed for N by combustion on an ECS 4010element analyzer (Costech Analytical, ValenciaCA) at the University of Nebraska, Lincoln. I generated calibration equations using replicates 1–4(n 64) and validated these equations using replicates 5--6 (n 32). All replicates were used togenerate the final equations that were used topredict litter N at the remaining seven sites. Crossvalidation was used to estimate the optimal number of terms to include in the calibration. Equationsdeveloped using all substrates sometimes yieldednegative values for low-N substrates (filter, wood),so calibration equations developed excluding thehigh-N substrates (Acer and Quercus leaves, n 72)were used to predict the remaining six substrate Nconcentrations. I used equations developed usingall eight substrates (n 96) to predict the N concentrations of Acer and Quercus leaves.Dried and ground (Wiley Mill, 20-mesh) sampleswere scanned on an NIR 5000 near-infraredreflectance spectrophotometer (Foss NIRSystems/Tecator, Silver Springs, MD) at 2 nm intervals from1100–2500 nm. Calibrations and predictions weredone using WinISI II (v. 1.02A, Infrasoft International, LLC., Silver Spring, MD) using the modifiedpartial least-squares regression (PLS) method. Different mathematical treatments (first and secondderivative, gap, and smooth) were tried, and thetreatment yielding the greatest ratio of the standarddeviation (SD) to the standard error of cross-validation (SECV), along with a high coefficient of
Nitrogen Effects on Decompositiondetermination (r2), was used to generate predictedvalues (Williams 1987; Gillon and others 1999).Final calibration equations used to predict unknown N concentrations had SD/SECV valuesranging from 4.62--7.74 and r2 values of 0.96--0.98.I determined the proportion of initial N at eachharvest by multiplying litter N concentration bylitter mass for the beginning of the experiment andfor each harvest, and dividing the final N pool bythe initial N pool. The proportion of initial N wascompared between treatments and among substrates for each harvest separately using two-wayANOVA.Site CharacterizationIn 2001, I characterized sites for N availability, littermoisture content, and litter layer and soil pH. Iassumed that relative differences among site weresimilar in 2000 and 2001. I assessed inorganic Navailability using ion-exchange resin (IER) bags inthe litter layer and the surface soil. 15 ml of resins(Dowex Marathon MR-3 mixed bed resins [R100835], Supelco Parke, Bellefonte, PA) wereplaced in nylon stocking bags, acid-washed in 10%HCl for two hours, and rinsed. On 7 May, 2001, Iplaced one IER bag into the soil (5–10 cm depth)and one bag in the litter layer in control plots ateach site. Bags were collected and replaced on 2July and 30 August, with a final collection on 30October. After collection, resins were rinsed withdeionized water and allowed to air dry in weighingtins for one week and weighed. Resins were extracted in pre-leached 30-ml syringes with GF/Afilter paper in the bottom using 100 ml of acidified2 M NaCl (in 0.1 M HCl) (Giblin and others 1994).Extracts were analyzed for inorganic N on an Alpkem autoanalyzer (OI Analytical, College Station,TX).Gravimetric moisture (65 C) was measured inthe litter layer at seven times between 15 June and6 September, 2001 by collecting the entire litterlayer (O horizon) from an approximately 10-cmdiameter circle at each of 6 points spaced 2 m apartalong a transect that was close to the actual treatment plots. The pH of the litter layer and the surface soil was determined on 15 June, 2001. Littersamples were collected as described for littermoisture. In addition, at each point along thetransect, 3 soil cores (2.54-cm diameter, 5 cmdepth) were collected and composited. Subsamples(2 g litter, 10 g soil) were placed in 20 ml of 0.01 MCaCl2, shaken for 30 min, and allowed to settle for30 min. pH was measured using an Orion pHmeter.647Statistical AnalysesEffects of Nitrogen on Decomposition within Sites. Todetermine the effects of fertilizer N on decomposition within a site, I used 2-way ANOVA with substrate and fertilizer treatment as main effects foreach site separately. To determine the effect ofsubstrate N and C chemistry within a site, I usedanalysis of covariance (ANCOVA). Fertilizationtreatment was included as the main effect andinitial concentrations of N, WS, lignin, and NPEwere included as covariates. Percent AS was excluded from the model because of its tight negativecorrelation with both WS and NPE (see Results).The mean decomposition in either the control or Nfertilized treatment was used as the dependentvariable, as I did not have independent measures ofinitial litter chemistry for each plot. Initial modelsincluded all interactions between covariates andfertilization to test the assumption of homogeneityof slopes required by ANCOVA. Interaction termswere not significant in all cases; so I present resultsfrom ANCOVA without interaction terms.To further assess whether the influence of addedN within a site depended on substrate chemistry, Icalculated the ‘‘effect of added N’’ on decomposition as the ratio of the proportion of initial massremaining in control plots to that in N-fertilizedplots. Equal mass remaining in control and N-fertilized plots yields a ratio of one. Greater mass lossin N-fertilized plots yields a ratio greater than one(that is, less of the initial mass would be remainingin the N-fertilized plots relative to the controlplots). The ratio, rather than the absolute difference, was used because I expected negative exponential decay. I calculated the index using theproportion mass remaining, rather than mass lost,because some litter types exhibited mass loss veryclose to zero and dividing by those values resultedin large outliers. I regressed this ratio against initialsubstrate nutrient and C fraction concentrations inseparate regressions.Effects of Nitrogen on Decomposition among Sites. Idetermined the influence of site characteristics ondecomposition by regressing decomposition incontrol plots against litter and soil pH, litter and soilIER-N, and litter moisture in separate bivariateregressions. In addition, to determine whether theinfluence of added N depended on site N availability (or some other site characteristic), I regressed the site means of the ‘‘effect of added N’’(see previous section) for all substrates at a siteagainst the site means of IER-N, litter pH, and littermoisture. Litter pH, soil pH and litter moisture werealso compared among sites using one-way ANOVA.
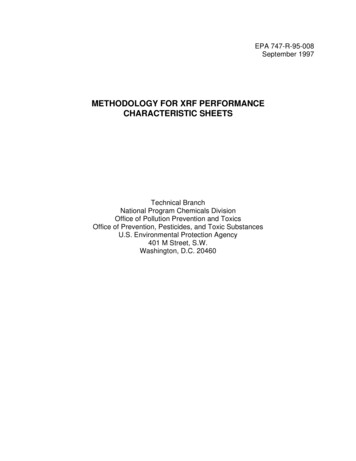
648S. E. HobbieFigure 1. Mass loss of eight substrates decomposed for ten months in control and N-fertilized plots (n 6) at all sites. Fortwo-way ANOVA comparing substrates and N fertilization within each site: ***P 0.001, **P 0.01, *P 0.05, P 0.10.Inorganic N accumulated on IERs was comparedamong sites, between positions (litter layer versussoil) and among seasons (spring, summer, fall)using repeated-measures ANOVA.RESULTSEffects of Nitrogen on Decompositionwithin a SiteN fertilization increased decomposition only at theAspen and Pine 1 sites (Figure 1). At the Oak 2 site,there was a significant interaction between substrate and N fertilization with N increasingdecomposition of some substrates, but decreasingor having no effect on decomposition of others. Atthe other five sites, the effect of N fertilizer was notsignificant, indicating a lack of limitation by exogenously supplied N. First-year mass loss differedsignificantly among substrates at all sites, withQuercus and Acer leaves and Acer litter decomposingmost quickly and wood decomposing most slowly(Figure 1).As expected, N and C fraction concentrationsvaried widely among substrates, with N rangingfrom 0–2.53% (Table 1). N was not correlated withany aspect of litter C chemistry (Table 2), allowingseparate determination of the effects of N and Cchemistry on decomposition. However, N wastightly and positively correlated with P and Kconcentrations. Also, both lignin:N and C:N werepositively correlated with each other and with %acid soluble (AS), and negatively correlated with %water-soluble (WS). Litter N was positively andsignificantly related to decomposition at all sitesexcept the two Pine sites (Figure 2), and if Acerlitter was excluded from the analyses, mass loss waspositively related to litter N at these sites as well.Acer litter likely had more rapid decompositionthan predicted by its N content because of its highconcentrations of water-soluble C and its low lignincontent (Table 1). The positive relationship between decomposition and litter N may reflect significant positive effects of litter P or K, rather thanN, on decomposition, as litter N was tightly correlated with both P and K (Table 2). In fact, separateANCOVAs at each site with N fertilization as maineffect and either P or K as a covariate indicatedsignificant effects of both P and K on decomposition(analyses not shown). First-year mass loss was also
649Nitrogen Effects on DecompositionTable 1.Initial Substrate Chemistry of Eight Common Substrates Decomposed at Each Site.Litter Nutrients (mg/g)SubstrateNPAcer leavesQuercus leavesAcer litterQuercus litterPinus litterSchizachyrium litterFilter paperWooden applicators18.2 (0.4)25.3 (0.7)4.5 (0.1)9.9 (0.7)4.6 (0.3)3.3 (0.2)0.0 (0.0)0.9 (0.0)2.191.801.650.870.470.280.000.08AshLitter Carbon(mg/g) Fractions 0.30)(0.60)(0.04)(0.01)(0.01)(0.01)CaMg15.34 (0.43)7.56 (0.39)25.99 (1.68)7.63 (0.28)8.24 (0.17)1.49 (0.22)0.04 (0.00)0.56 .4480.3500.6463.2423.9462.2NPE WS AS 52394429412367666982811139219742562022340146Values are means (SE). No standard errors are presented for C fractions, which were measured on single bulk samples.NPE nonpolar extractives, WS water soluble, AS acid soluble, lignin acid insoluble. Carbon fractions are expressed per g ash-free dry mass.Table 2.C:Nligninlignin:NWSASNPEPKCaMgCorrelation Matrix of Various Aspects of Initial Substrate .93***0.380.730.89**Values are Pearson correlation coefficients. Significant correlations (P 0.05) are indicated in bold.***P 0.001, **P 0.01, *P 0.05NPE nonpolar extractives, WS water soluble, AS acid soluble, lignin acid insoluble.positively related to the concentration of watersoluble C at the four of eight sites, suggesting limitation by labile C and/or the contribution ofleaching to mass loss in the first year. Decomposition was also negatively related to initial ligninconcentrations at five of the sites, indicating anegative effect of lignin even in the early stages ofdecay. The ANCOVA analyses done for each sitealso indicated a significant N fertilization effect atthe Aspen site, but not at any other sites (Figure 2).The discrepancy between the results of theANCOVAs and the two-way ANOVAs with substrate and treatment as main effects likely arisefrom lower power associated with the ANCOVAs,which were done using mean decomposition of allsubstrates for each treatment.My hypothesis that fertilizer N would have largereffects on decomposition of low-N substrates wasnot supported. As mentioned previously, therewere no significant interactions between N fertilization and litter N in the ANCOVA analyses. Furthermore, linear regressions of the ‘‘effect of addedN’’ on decomposition against initial litter N concentration were not significant at any site (Figure 3, P 0.30 in all cases); significant negativerelationships would have supported my hypothesis.The ‘‘effect of added N’’ was also unrelated to otheraspects of initial litter chemistry, including % WS(data not shown).Effects of Nitrogen on Decompositionamong SitesInorganic N accumulated on IERs was highest in theOak 2 and Pine sites and lowest in the Aspen site(Table 3). Differences among sites changed throughthe season (data not shown, Repeated-MeasuresANOVA, Date*Site: F14,154 1.93, P 0.03) and
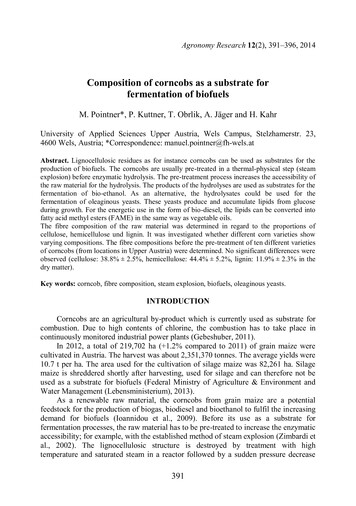
650S. E. HobbieFigure 2. Relationships between mass loss after ten months and initial substrate % N for eight substrates decomposed incontrol plots at each site. Statistics are from ANCOVAs of mass loss with fertilization treatment as the main effect andsubstrate N, lignin, WS, and NPE as covariates. ANCOVAs were run with and without Acer litter (circled) at both Pine sites.Significant relationships with N or WS were positive and those with lignin were negative. Percent AS was excluded fromthe analysis because of tight negative correlations with percent NPE and WS (Table 2). Statistical significance indicated asin Figure 1.IER-N was higher in the soil than in the litter layer(Repeated-Measures ANOVA, Date: F2,77 122.81,Position: F1,78 109.83, Date*Position: F2,77 52.74,P 0.0001 in all cases). Litter pH was greatest in theAspen site, whereas soil pH was highest in the Pine2 and Old Field sites and lowest in the Maple andtwo Oak sites. Litter moisture was lower in the OldField sites than in the forested sites, although asignificant Site*Date interaction arose because sitedifferences were greater on dates with higher littermoisture contents (data not shown, two-way ANOVA, Site: F7,280 32.08, Date: F6,280 298.37,Site*Date: F42,280 4.68, P 0.0001 in all cases).Across sites, decomposition in the control plots waspositively related to IER-N in soils (r )0.74,P 0.04) and to litter moisture content (r )0.82,P 0.01), but was unrelated to IER-N in the litterlayer alone (P 0.42) or to litter (P 0.99) or soil(P 0.12) pH. Negative correlation coefficientsindicate positive relationships with decomposition,as the dependent variable was proportion initialmass remaining.My hypothesis that N fertilization would have agreater effect on litter decomposition in sites withlower inorganic N availability was supported by asignificant negative relationship between the sitemean ‘‘effect of added N’’ and site mean seasonaltotal litter IER N (Figure 4). In other words, fertilizer N had a larger effect on decomposition in siteswith lower N availability in the litter layer. Therelationship between the ‘‘effect of added N’’ andsoil IER N was also negative, but not significant(P 0.15), and the relationship with litter soil IERN was significant (r )0.80, P 0.02). There wasno significant relationship between the ‘‘effect ofadded N’’ and either litter (P 0.23) or soil(P 0.85) pH or litter moisture content (P 0.84).I confirmed these results by analyzing proportionmass remaining in an ANCOVA with litter moistureand litter soil IER N included as covariates, and Nfertilization as a main effect, finding a significantinteraction between N fertilization and litter soilIER N (IER N was negatively related to proportionmass remaining in the control treatment, and
77.262.0124.2130.8117.6106.195.761.2 c0.2a0.2a0.1ab0.1c 2b0.1b 5.14.34.74.24.24.54.44.7AspenMapleOld Field 1Old Field 2Oak 1Oak 2Pine 1Pine 2Values are means SE. Sample sizes are n 6 for litter and soil pH; n 6 at each of seven dates for litter moisture; n 6 at each of three dates for litter and soil inorganic N. Litter moisture is the mean of all dates measured. Inorganic Nis the sum of NH4 -N and NO3)-N that accumulated on ion-exchange resins over three different two-month time periods.Different letters within a column indicate significant differences between sites for pH (TukeyÕs HSD, p 0.05). See text for statistical analyses of other environmental factors.676.4 130.8862.0 60.4766.3 148.7814.7 142.8988.6 157.51040.4 95.0859.0 93.71092.5 55.138.321.743.4Litter inorganic N(lg N/g resin)Soil pHLitter pHSiteTable 3.Environmental Characteristics of All Sites.Litter moisture(%)Soil inorganic N(lg N/g resin)Total inorganic N(lg N/g resin)Nitrogen Effects on Decomposition651unrelated to mass remaining in the N-fertilizedtreatment). Litter moisture was significantly negatively related to mass remaining, but there was nointeraction with N fertilization.Litter Nitrogen DynamicsAll substrates, except Quercus leaves, immobilized Nat most sites over the first winter of decomposition(Figure 5A). Proportion initial N was negativelycorrelated with initial N concentration at only twoof the eight sites (Aspen and Maple, P 0.05). Nfertilization significantly increased N immobilization at only one site, Oak 2. In contrast, after thesummer (that is, after one year of decomposition), all substrates exhibited N immobilization.Significant differences among substrates were stillapparent, with wood consistently immobilizingrelatively more N than other substrates. Nitrogenfertilization led to significantly greater immobilization at three sites, Old Field 1, Pine 1, andPine 2, and marginally greater N immobilization atAspen. Thus, there was a lack of perfect correspondence between sites where N stimulated decomposition and sites where N stimulatedimmobilization. Nitrogen stimulated decompositionat one site where it had only marginal effects on Nimmobilization (Aspen) and stimulated immobilization at two sites where it did not affectdecomposition (Old Field 1 and Pine 2).DISCUSSIONSubstrate versus Fertilization Effects onDecompositionMy hypothesis that both exogenous and endogenous N availability would limit decomposition inthese N-poor ecosystems where N limits net primary production was only partially supported
stages of decomposition is necessary for predicting how decomposition (and thus ecosystem carbon balance) responds to elevated N inputs resulting from human activities. Yet, few studies have di-rectly compared the effects of substrate N with those of N added as fertilizer, and these studies have been relatively limited in scope. Some report