Transcription
Understanding VectorNetwork Analysiswww.anritsu.com
VNA Basics . 4Network Analyzers . 6Scalar Analyzer Comparison . 7VNA Fundamentals . 7Network Analyzer Measurements . 12Measurement Error Correction . 18Summary . 19VNA Overview . 20VNA Architecture . 20Sources . 20Switches . 27PIN Diode . 27Cold FET Switch . 27Directional Devices . 28Down Converters . 34IF Section . 43System Performance Considerations . 46Measurement Fundamentals . 48The Reference Plane . 48Introduction to Calibrations . 49Linearity . 51Data Formats . 52Other Terms of Interest . 53System Architecture and Modes of Operation . 35Specifications and Measurement Accuracy . 55Dynamic Range . 56Compression Level . 56Noise Floor . 57Trace Noice . 57Power Range . 57ALC Power Accuracy and Linearity . 57Frequency Accuracy and Stability . 58Harmonics . 58Raw Directivity . 58Raw Source Match . 58Raw Load Match . 582Understanding Vector Network Analysis
Residual Directivity .58Residual Source Match . 59Residual Load Match . 59Residual Reflection Tracking . 59Residual Transmission Tracking . 59Summary . 60References . 60w w w. a n r i t s u . c o m3
In this Understanding Guide we will introduce the basic fundamentals of the Vector NetworkAnalyzer (VNA). Specific topics to be covered include phase and amplitude measurements,scattering parameters (S-parameters), and the polar and Smith chart displays.VNA BasicsThe VNA measures the magnitude and phase characteristics of networks, amplifiers,components, cables, and antennas. It compares the incident signal leaving the analyzer witheither the signal that is transmitted through the test device or the signal reflected from itsinput. Figure 1 and Figure 2 illustrate the different types of measurements that the VNA canperform. Return Loss (dB)Reflection Coefficients (S11, S22)Reflection Coefficients vs Distance (Fourier Transform)Impedance (R jX)SWRTransmittedIncidentTestDevice Gain (dB) Insertion Loss (dB) Isertion Phase (degrees) Transmission Coefficients (S11, S22) IncidentSeparations of Tansmission Components (Realand Imaginary) Test ReflectedElectrical Length(m)Device Electrical Delay (s)Termination Deviation from Linear Phase (degrees) Group Delay (s)Figure 1. The VNA can make a wide range of transmission measurements.4Understanding Vector Network Analysis
TestDeviceIncidentReflectedTestDeviceTermination Return Loss (dB) Reflection Coefficients (S11, S22) Reflection Coefficients vs Time (FourierTransform) Impedance (R jX) SWRFigure 2. The VNA can make five different reflection measurements.VNAs are self-contained, fully-integrated measurement systems that include additionalmeasurement capabilities such as time domain and group delay. The system hardware consistsof the following: An analyzerPrecision components required for calibration and performance verificationOptional use of synthesizers as a second sourceOptional use of power meters for test-port leveling and calibrationThe VNA internal system modules perform the following functions:Source Module - The source module provides the stimulus to the device under test (DUT). Thefrequency range of the source and test set modules establish the frequency range of thesystem. The frequency stability of the source is an important factor in the accuracy (especiallyphase accuracy) of the network analyzer. Some VNA sources operate in either analog-sweepmode or step-sweep mode. Analog-sweep mode provides a faster measurement time.However, since the signal is not locked to a stable reference, measurement stability—especiallyphase - will suffer. For proper measurement accuracy, the VNA should always be operated in astep sweep, phase-locked condition. The difference is critical enough that all Anritsu VNAsprovide only a step-sweep mode and do not provide the ability to unlock the source.Test Set Module - The test-set module routes the stimulus signal to the DUT and samples thereflected and transmitted signals. The type of connector used is important, as is the “AutoReversing” feature. Auto Reversing means that the stimulus signal is applied in both theforward and reverse directions. The direction is reversed automatically. This saves the engineerw w w. a n r i t s u . c o m5
from having to physically reverse the test device to measure all four S-parameters. It alsoincreases accuracy by reducing connector repeatability errors. Frequency conversion to theIntermediate Frequency (IF) range also occurs in the test-set module.Analyzer Module - The analyzer module receives and interprets the IF signal for phase andmagnitude data. It then displays the results of this analysis on a high-resolution display screen.This display can show all four S-parameters simultaneously, as well as a variety of other formsof displayed information such as group delay, time and distance, and complex impedanceinformation. In addition to the installed display, the engineer can also view the measurementresults on an external monitor.Network AnalyzersThis discussion of networks analyzers begins with a subject familiar to most analyzer users:scalar network analysis. After showing comparisons, the fundamentals of network analyzerterminology and techniques will be presented. This discussion serves as an introduction totopics presented in greater detail later in this chapter and will touch on the concepts of: Reference delay S-Parameters: what they are and how they are displayed Complex impedance and Smith ut VoltageDetector Output Voltage is Proportional to Signal AmplitudeFigure 3. Scalar network analyzers measure microwave signals using the detection processshown here.6Understanding Vector Network Analysis
Scalar Analyzer ComparisonVNAs do everything that scalar analyzers do, plus they add the ability to measure the phasecharacteristics of microwave devices over a greater dynamic range and with more accuracy. Ifall a VNA added was the ability to measure phase characteristics, its usefulness would belimited. While phase measurements are important, the availability of phase informationprovides the potential for many new complex-measurement features, including Smith charts,time domain and group delay. Phase information also allows greater accuracy through vectorerror correction of the measured signal.Now consider the scalar network analyzer (SNA), an instrument that measures microwavesignals by converting them to a DC voltage using a diode detector (Figure 3). This DC voltageis proportional to the magnitude of the incoming signal. The detection process, however,ignores any information regarding the microwave signal’s phase. Also, a detector is abroadband-detection device which means that all frequencies, the fundamental, harmonic,sub-harmonic, and spurious signals, are detected and simultaneously displayed as one signal.This adds significant error to both the absolute and relative measurements.In a VNA, information regarding both the magnitude and phase of a microwave signal isextracted. While there are different ways to perform this measurement, the method employedby the Anritsu VectorStar MS4640A series of VNAs is to down-convert the signal to a lower IFin a process called harmonic sampling. This signal can then be measured directly by a tunedreceiver. The tuned receiver approach gives the system greater dynamic range due to itsvariable IF-filter bandwidth control. The system is also much less sensitive to interfering signals,including harmonics.VNA FundamentalsThe VNA is a tuned receiver (Figure 4). The microwave signal is down converted into thepassband of the IF. To measure the phase of this signal as it passes through the DUT, areference is needed for comparison. If the phase of a signal is 90 degrees, it is 90 degreesdifferent from the reference signal (Figure 5). The VNA reads this as –90 degrees, since the testsignal is delayed by 90 degrees with respect to the reference signal. The phase reference canbe obtained by splitting off a portion of the microwave signal before the measurement (Figure6).The phase of the microwave signal, after it has passed through the DUT, is then compared withthe reference signal. A network-analyzer test set automatically samples the reference signal sono external hardware is needed.w w w. a n r i t s u . c o m7
Consider the case where the DUT is removed and a length of transmission line is substituted(Figure 7). Note that the path length of the test signal is longer than that of the referencesignal. How does this affect the measurement?A Vector Network Analyzer is a Tuned nable LocalOscillatorFigure 4. The network analyzer is a tuned receiver.To answer this question, assume that a measurement is being made at 1 GHz and that thedifference in path length between the two signals is exactly 1 wavelength. This means that thetest signal lags behind the reference signal by 360 degrees (Figure 8). It is impossible to tell thedifference between one sine wave maxima and the next because they are all identical.Consequently, the network analyzer measures a phase difference of 0 degrees.Phase MeasurementReference SignalTest SignalTimeFigure 5. Shown here are signals with a 90-degree phase difference.8Understanding Vector Network Analysis
Now, consider that this same measurement is made at 1.1 GHz. Since the frequency is higherby 10 percent, the wavelength of the signal is shorter by 10 percent. The test-signal pathlength is now 0.1 wavelength longer than that of the reference signal (Figure 9). This test signalis: 1.1 x 360 396 degrees. This is 36 degrees different from the phase measurement at 1 GHz.The network analyzer displays this phase difference as –36 degrees. The test signal at 1.1 GHzis delayed by 36 degrees more than the test signal at 1 tSignalSplitterDUTFigure 6. Splitting the microwave signal to obtain the phase aseDetectorTestSignalLongPathLengthFigure 7. Pictured here is the case of a split signal where a length of line replaces the DUT.w w w. a n r i t s u . c o m9
rTestSignalLonger byOne WavelengthLength (360 Degress)Figure 8. Depicted here is the case for a split signal where the path length differs by exactlyone ctorTestSignalSplitterSame Path Length ButWavelength is Now Shorter1.1 Wavelengths 396 DegressFigure 9. Depicted here is the case for a split signal where the path length differs by thesame path length, but the wavelength is now shorter. Note that 1.1 wavelengths 396degrees.Measured Phase 180 90 0 1.11.21.31.4Frequency in GHz-90 -180 Figure 10. This graphic depicts electrical delay.10Understanding Vector Network Analysis
rTestSignalBoth LineLengthsNow Equal1.1 Wavelengths 396 DegressFigure 11. This graphic depicts a split signal where paths are equal in length.A measurement frequency of 1.2 GHz produces a reading of –72 degrees, while 1.3 GHzproduces a reading of –108 degrees (Figure 10). There is an electrical delay between thereference and test signals. This delay is commonly referred to in the industry as the referencedelay. It is also called phase delay. In older network analyzers, the length of the reference pathhad to be constantly adjusted—relative to the test path—to make an appropriate measurementof phase versus frequency.To measure phase on a DUT, this phase-change versus frequency due to changes in theelectrical length must be removed. This allows the actual phase characteristics to be viewed.These characteristics may be much smaller than the phase change due to electrical-lengthdifference.There are two ways to remove the phase-change versus frequency value. The most obviousway is to insert a length of line into the reference-signal path to make both paths equal inlength (Figure 11). With perfect transmission lines and a perfect splitter, the engineer can thenmeasure a constant phase as the frequency changes. The problem with using this approach isthat the line length must be changed with each measurement setup.w w w. a n r i t s u . c o m11
Measured Phase 180 90 1.1 0 1.21.31.4Frequency in GHzSubtract LinearPhase FromMeasured Phase-90 -180 Figure 12. Here phase difference increases linearly with frequency.Resultant Phase 180 90 0 1.11.21.31.4Frequency in GHz-90 -180 Figure 13. Shown here is the resultant phase with path length.The second approach involves handling the path-length difference in software. Figure 12displays the phase versus frequency of a device. This device has different effects on the outputphase at different frequencies. Because of these differences, the phase response is notperfectly linear. This phase deviation can be easily detected by compensating for the linearphase. Because the size of the phase difference increases linearly with frequency, the phasedisplay can be modified to eliminate this delay. Anritsu VNAs offer automatic reference-delaycompensation with the push of a button. Figure 13 shows the resultant measurement when thepath length is compensated.Network Analyzer MeasurementsNow, consider measuring the DUT using a two-port device; that is, a device with a connectoron each end. What measurements would be of interest? First, measure the reflectioncharacteristics at either end with the other end terminated into 50 ohms. If one of the inputs isdesignated as Port 1 of the device, then this is the reference port. Next, define the reflection12Understanding Vector Network Analysis
characteristics from the reference end as forward reflection, and those from the other end asreverse reflection (Figure 14).Port 1ForwardReflectionPort 2ReverseReflectionDUTFigure 14. Forward and reverse measurements are shown in this graphic.S21 Forward TransmissionPort 1S11 ForwardReflectionPort 2DUTS22 ReverseReflectionS12 Reverse TransmissionFigure 15. The four scattering parameters are shown in this figure.Second, measure the forward and reverse transmission characteristics. However, instead ofsaying “forward,” “reverse,” “reflection,” and “transmission” all the time, a shorthand can beused—S-parameters. In a typical SXX nomenclature, the “S” stands for scattering, the firstnumber is the device port that the signal is leaving and the second number is the device portthat the signal is being injected into. As an example, S11 refers to the signal leaving Port 1relative to the signal injected into Port 1. The four scattering parameters, shown in Figure 15,are: S11 forward reflection S21 forward transmission S22 reverse reflection S12 reverseS-parameters can be displayed in many ways. An S-parameter consists of a magnitude and aphase. The magnitude is displayed in dB, just like the SNA, and is called the log magnitude.Another method of magnitude display is to use units instead of dB. When displaying magnitudein units, the value of the reflected or transmitted signal will be between 0 and 1 relative to thereference.w w w. a n r i t s u . c o m13
Phase 180º0º-180ºFrequencyFigure 16. This waveform depicts linear phase with frequency.Phase can be displayed as “linear phase” (Figure 16). As discussed earlier, it’s impossible to tellthe difference between one cycle and the next. Therefore, after going through 360 degrees,the engineer ends up back at the beginning. Displaying the measurement from –180 to 180degrees is a more common approach. This method keeps the display discontinuity removedfrom the important 0 degree area which is used as the phase reference.Polar Display 90º0º 180º-90ºFigure 17. An example of a polar display.There are several ways in which all the information can be displayed on one trace. One methodis a polar display (Figure 17). In this display, the radial parameter (e.g., distance from the center)is magnitude, while the rotation around the circle is phase. Polar displays are sometimes usedto view transmission measurements, especially on cascaded devices (e.g., devices in series).The transmission result is the addition of the phase and log magnitude (dB) information ofeach device’s polar display.As previously discussed, the signal reflected from a DUT has both magnitude and phase. Thisis because the impedance of the device has both a resistive and a reactive term of the form14Understanding Vector Network Analysis
R jX, where R is the real or resistive term and X is the imaginary or reactive term. The j, whichis sometimes denoted as i, is an imaginary number and is the square root of –1. If X is positive,the impedance is inductive. If X is negative, the impedance is capacitive.Inductive50ΩCapacitiveFigure 18. An example of a Smith chart.The size and polarity of the reactive component X is important in impedance matching. Thebest match to a complex impedance is the complex conjugate. This complex sounding termsimply means an impedance with the same value of R and X, but with X of opposite polarity.This term is best analyzed using a Smith chart which is a plot of R and X (Figure 18). Displayingall of the information on a single S-parameter requires one or two traces, depending on theformat desired. A very common requirement is to view forward reflection on a Smith chart (onetrace), while observing forward transmission in log magnitude and phase (two traces). Inaddition, it is also very helpful to simultaneously display other displays such as Time Domainand Group Delay while monitoring the S11 and S21 parameters. This requires a VNA with acomplex display capability such as the MS4640A VectorStar VNA.w w w. a n r i t s u . c o m15
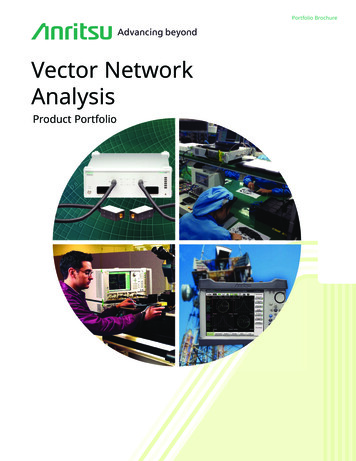
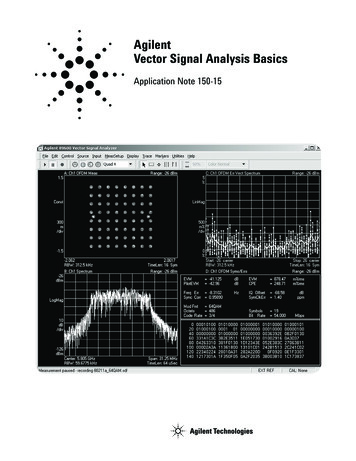
Figure 19. Shown here is the VectorStar multiple channel and multiple trace display.Figure 20. The VectorStar display of a group delay measurement of a wirelesscommunication filter.16Understanding Vector Network Analysis
The MS4640A VectorStar has the ability to configure one to sixteen channels. Each channel canthought of as an independent VNA. Therefore, a channel in the VectorStar can be configuredfor a specific frequency range, calibration type, power level, and IF-filter bandwidth setting.Additional channels can be configured within the VectorStar to help facilitate testing in multiplesetup parameters, up to the 16 channels available. The VectorStar can also be configured todisplay all of the active channels in a pattern that is most useful to the user.With multiple channels configured, the VectorStar VNA sequentially sweeps from onecalibrated setup and measurement condition to the next. Each of the channel displays can beconfigured to accept up to 16 traces. All of the traces in each channel can likewise be configuredfor the most beneficial display pattern. Finally, each of these traces can be configured for anappropriate display, depending on the type of data being displayed (Figure 19). For instance,Trace 6 can be set up to provide S11 performance of the device displayed on a Smith chart,Trace 7 can be set up for S with a Time Domain display, and Trace 12 can be set up for an S21display on a Log Magnitude and Phase graph.Another important parameter that can be measured with phase information is group delay(Figure 20). In linear devices, the phase change through the DUT is linear-with-frequency. Thus,doubling the frequency also doubles the phase change. An important measurement, especiallyfor communications system users, is the rate of change-of-phase versus frequency (e.g., groupdelay). If the rate of phase-change versus frequency is not constant, the DUT is nonlinear. Thisnonlinearity can create distortion in communications systems.w w w. a n r i t s u . c o m17
Measurement Error CorrectionSince microwave signals can be measured in both magnitude and phase, it is possible tocorrect for six major error terms: Source test-port matchLoad test-port matchDirectivityIsolationTransmission frequency responseReflection frequency responseMagnitude and phase of each errorsignal is measuredMagPhaseThen the resultant vector is applied mathematically, hence vector error correction.Figure 21. Magnitude and phase information of each error signal is measured and availablefor removal during the measurement.It is possible to correct for each of these six error terms in both the forward and reversedirections, hence the name 12-term error correction. Since 12-term error correction requiresboth forward and reverse measurement information, the test set must be reversing. “Reversing”means that it must be able to apply the measurement signal in the forward or reverse directionautomatically, without having to disconnect the calibration components or DUT.To accomplish this error correction, measurement of the magnitude and phase of each errorsignal occurs during calibration of the VNA (Figure 21). There are a number of different typesof calibration processes some of which will be discussed in further detail in UnderstandingVNA Calibration. Once the magnitude and phase information of the error vectors are obtainedduring calibration, they are mathematically removed from the measurement signal - a processtermed vector-error correction.18Understanding Vector Network Analysis
SummaryCompared to the SNA, the VNA is a much more powerful analyzer. The major difference is thatthe VNA adds the ability to measure phase, as well as amplitude. With phase measurementscome S-parameters, which are a shorthand method for identifying forward and reversetransmission and reflection characteristics. The ability to measure phase introduces two newdisplays, polar and Smith chart. It also adds vector-error correction to the measurement trace.With vector-error correction, errors introduced by the measurement system are compensatedfor and measurement uncertainty is minimized. Phase measurements also add the capabilityfor measuring group delay, which is the rate of change-of-phase versus frequency (e.g., groupdelay). All in all, using a network analyzer provides for a more complete analysis of any testdevice.w w w. a n r i t s u . c o m19
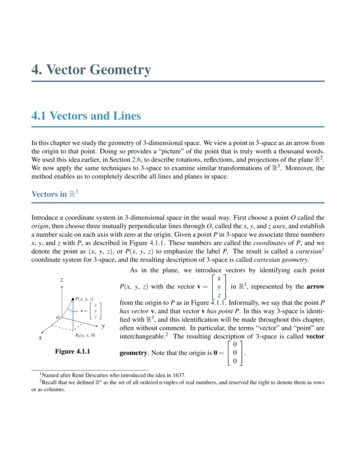
VNA OverviewThis section is designed to introduce the reader to the fundamentals of VNA architecture,measurements, specifications, and performance. In it, the major functional analog blocks in aRF/microwave VNA are examined, along with the current and past technologies which areused in these blocks. This content will serve as the foundation on which more advancedconcepts will later be developed.VNA ArchitectureIn its most basic form, the objective of a VNA is to capture S-parameter data. The instrumentsimply acquires incident and reflected waves at every port in question and, in most cases,provides a semi-known terminating impedance at all but the driving port. The basicrequirements for capturing S-parameter data include: One or more signal sources with, at minimum, controllable frequency and asufficiently-clean spectral tone for making a measurement. Sources with controlledpower are preferred. Directional devices - whether physically or computationally directional - forseparating incident and reflected waves at the ports. A means of switching RF signals when there are fewer sources than ports, or eithermore or fewer receivers than ports. One or more receivers, usually with down converters, to take incident and reflectedwaves down to some convenient IF for processing. An IF section and digitizer to transform the converted wave amplitudes into a usefulform for computation.ReferenceSignalSourceDownConverterPort rPort 2Figure 22. Shown here is one possible VNA block diagram, illustrating the key blocks to bediscussed in this section.20Understanding Vector Network Analysis
A simplified block diagram of a common VNA is shown in Figure 22. Many variations on thisstructure are possible. For example, one source could be used for each port instead ofswitching a single source between two ports, or the coupling devices could be repositioned.The diagram therefore, is simply intended to point out that the functions listed above aregenerally all present in one form or another and play a role in overall system performance.Tunable Oscillatorof Some Mixing, igure 23. A generic source block diagram illustrates some of the architectural choices tobe made by the engineer.SourcesIt might be tempting to view the VNA source somewhat simplistically—as a synthesizer orsweeper somehow synchronized with a local oscillator (LO) to produce the desired transceiverbehavior. In practice, there are many competing demands on performance and consequently,the source is based on a complex series of decisions. Speed, for example, is often times acritical component of the modern VNA, while spectral purity is typically not as critical since theengineer knows what frequency he/she is trying to measure. The engineer cannot deviate toofar, however, because the phase noise of the sources involved affects trace noise, spurring thesources to produce undesired receiver responses which impacts net dynamic range. Similarly,the source is impacted by the desired application. Because the VNA is used to make mixermeasurements and multi-tone analysis, any architectural choices pertaining to the sourcebecome more constrained (e.g., spectral purity again becomes important).A simplistic block diagram of a source is shown in Figure 23. The diagram is extremely g
A Vector Network Analyzer is a Tuned Receiver Figure 4. The network analyzer is a tuned receiver. To answer this question, assume that a measurement is being made at 1 GHz and that the difference in path length between the two signals is exactly 1 wavelength. This means that the test signal lags behind the reference signal by 360 degrees .