Transcription
AgilentVector Signal Analysis BasicsApplication Note 150-15
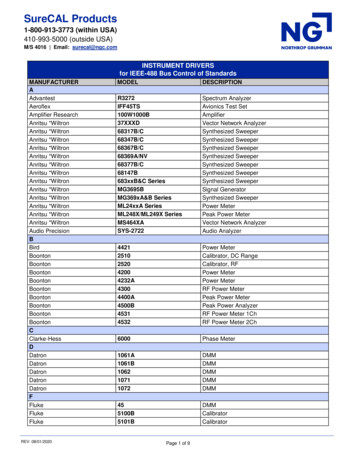
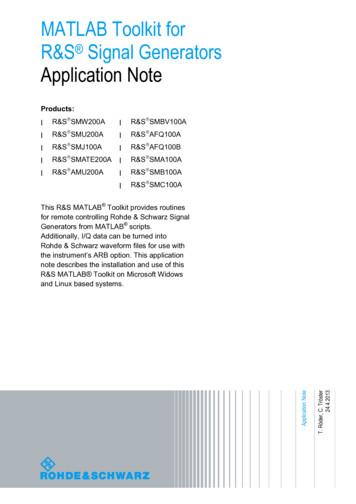
Chapter 1Vector Signal AnalyzerThis application note serves as a primer on the vector signal analyzer (VSA).This chapter discusses VSA measurement concepts and theory of operation;Chapter 2 discusses VSA vector-modulation analysis and, specifically,digital-modulation analysis.Analog, swept-tuned spectrum analyzers use superheterodyne technologyto cover wide frequency ranges; from audio, through microwave, to millimeterfrequencies. Fast Fourier transform (FFT) analyzers use digital signalprocessing (DSP) to provide high-resolution spectrum and network analysis,but are limited to low frequencies due to the limits of analog-to-digitalconversion (ADC) and signal processing technologies. Today’s wide-bandwidth,vector-modulated (also called complex or digitally modulated), time-varyingsignals benefit greatly from the capabilities of FFT analysis and other DSPtechniques. VSAs combine superheterodyne technology with high speedADCs and other DSP technologies to offer fast, high-resolution spectrummeasurements, demodulation, and advanced time-domain analysis.A VSA is especially useful for characterizing complex signals such asburst, transient, or modulated signals used in communications, video,broadcast, sonar, and ultrasound imaging applications.Figure 1-1 shows a simplified block diagram of a VSA analyzer. The VSAimplements a very different measurement approach than traditionalswept analyzers; the analog IF section is replaced by a digital IF sectionincorporating FFT technology and digital signal processing. The traditionalswept-tuned spectrum analyzer is an analog system; the VSA is fundamentallya digital system that uses digital data and mathematical algorithms toperform data analysis. For example, most traditional hardware functions,such as mixing, filtering, and demodulation, are accomplished digitally,as are many measurement operations. The FFT algorithm is used forspectrum analysis, and the demodulator algorithms are used for vectoranalysis applications.Digitized data streamAnalog sfilterLO90 degsQuadraturedetector,digital filteringFrequency domainTimeQDemodulatorIModulation domainDigital IFandDSP techniquesItTime domainQ0 code 15Code domainFigure 1-1. The vector signal analyzer digitizes the analog input signal and uses DSP technologyto process and provide data outputs; the FFT algorithm produces frequency domain results,the demodulator algorithms produce modulation and code domain results2
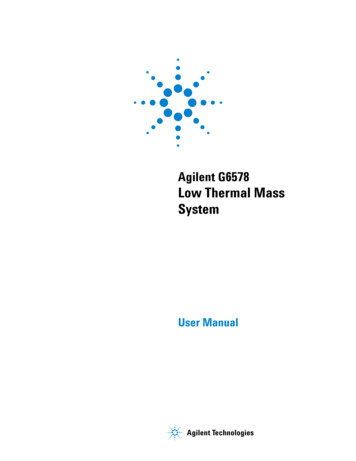
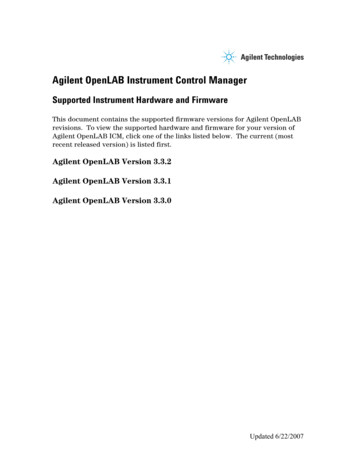
A significant characteristic of the VSA is that it is designed to measure andmanipulate complex data. In fact, it is called a vector signal analyzer becauseit has the ability to vector detect an input signal (measure the magnitudeand phase of the input signal). You will learn about vector modulation anddetection in Chapter 2. It is basically a measurement receiver with systemarchitecture that is analogous to, but not identical to, a digital communicationsreceiver. Though similar to an FFT analyzer, VSAs cover RF and microwaveranges, plus additional modulation-domain analysis capability. Theseadvancements are made possible through digital technologies such asanalog-to-digital conversion and DSP that include digital intermediatefrequency (IF) techniques and fast Fourier transform (FFT) analysis.Because the signals that people must analyze are growing more complex, thelatest generations of spectrum analyzers have moved to a digital architectureand often include many of the vector signal analysis capabilities previouslyfound only in VSAs. Some analyzers digitize the signal at the instrumentinput, after some amplification, or after one or more downconverter stages.In any of these cases, phase as well as magnitude is preserved in order toperform true vector measurements. Capabilities are then determined bythe digital signal processing capability inherent in the spectrum analyzerfirmware or available as add-on software running either internally(measurement personalities) or externally (vector signal analysis software)on a computer connected to the analyzer.VSA measurement advantagesVector analysis measures dynamic signals and produces complex data resultsThe VSA offers some distinct advantages over analog swept-tuned analysis.One of the major advantages of the VSA is its ability to better measuredynamic signals. Dynamic signals generally fall into one of two categories:time-varying or complex modulated. Time-varying are signals whosemeasured properties change during a measurement sweep (such as burst,gated, pulsed, or transient). Complex-modulated signals cannot be solelydescribed in terms of simple AM, FM, or PM modulation, and include mostof those used in digital communications, such as quadrature amplitudemodulation (QAM).Swept analysisVector analysisTime domainFourier analysisFrequency domainCarrierTime sampled dataAFrequencyresolutionbandwidthIF filterStart frequency0Sweep spanSimulated parallel-filter processingtf1fStop frequencyATime recordf2Display shows fullspectral displayfFrequency spectrumFigure 1-2. Swept-tuned analysis displays the instantaneous time response of a narrowband IF filterto the input signal. Vector analysis uses FFT analysis to transform a set of time domain samples intofrequency domain spectra.3
A traditional swept-spectrum analyzer1, in effect, sweeps a narrowbandfilter across a range of frequencies, sequentially measuring one frequency ata time. Unfortunately, sweeping the input works well for stable or repetitivesignals, but will not accurately represent signals that change during thesweep. Also, this technique only provides scalar (magnitude only) information,though some other signal characteristics can be derived by further analysisof spectrum measurements.The VSA measurement process simulates a parallel bank of filters andovercomes swept limitations by taking a “snapshot,” or time-record, of thesignal; then processing all frequencies simultaneously. For example, if theinput is a transient signal, the entire signal event is captured (meaning allaspects of the signal at that moment in time are digitized and captured);then used by the FFT to compute the “instantaneous” complex spectraversus frequency. This process can be performed in real-time, that is, withoutmissing any part of the input signal. For these reasons, the VSA is sometimesreferred to as a “dynamic signal analyzer” or a “real-time signal analyzer”.The VSA’s ability to track a fast-changing signal isn’t unlimited, however; itdepends on the VSA’s computational capability.The VSA decreases measurement timeParallel processing yields another potential advantage for high-resolution(narrow resolution bandwidth) measurements; faster measurement time.If you’ve used a swept-tuned spectrum analyzer before, you already knowthat narrow resolution bandwidth (RBW) measurements of small frequencyspans can be very time-consuming. Swept-tuned analyzers sweep frequenciesfrom point to point slowly enough to allow the analog resolution bandwidthfilters to settle. By contrast, the VSA measures across the entire frequencyspan at one time. However, there is analogous VSA settling time due to thedigital filters and DSP. This means the VSA sweep speed is limited by datacollection and digital processing time rather than analog filters. But thistime is usually negligible when compared to the settling time of analogfilters. For certain narrow bandwidth measurements, the VSA can completea measurement up to 1000 times faster than conventional swept-tunedanalyzers.In a swept-tuned spectrum analyzer, the physical bandwidth of the sweepingfilter limits the frequency resolution. The VSA doesn’t have this limitation.Some VSAs can resolve signals that are spaced less than 100 µHz apart.Typically, VSA resolution is limited by source and analyzer frequencystability, as well as by the amount of time you are willing to devote to themeasurement. Increasing the resolution also increases the time it takes tomeasure the signal (the length of the required time-record).Time-capture is a great tool for signal analysis and troubleshootingAnother feature that is extremely useful is the time-capture capability.This allows you to record actual signals in their entirety without gaps, andreplay them later for any type of data analysis. The full set of measurementfeatures can be applied to the captured signal. For example, you couldcapture a transmitted digital communications signal and then performboth spectrum and vector-modulation analysis to measure signal qualityor identify signal impairments.1. For more information on spectrum analyzers, seeAgilent Application Note 150, Spectrum AnalysisBasics, literature number 5952-0292.4
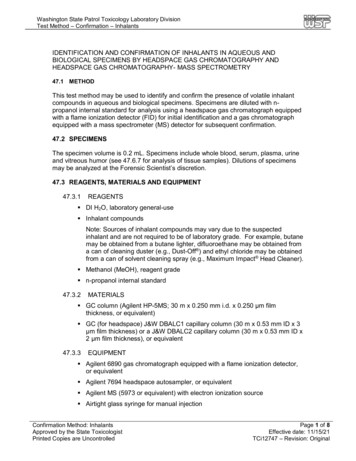
DSP provides multi-domain measurements in one instrumentThe use of digital signal processing (DSP) also yields additional benefits;it provides time, frequency, modulation, and code domain measurementanalysis in one instrument. Having these capabilities increases the analyzer’svalue to you and improves the quality of your measurements. FFT analysisallows easy and accurate views of both time and frequency domain data.The DSP provides vector modulation analysis, including both analog anddigital modulation analysis. The analog demodulator produces AM, FMand PM demodulation results, similar to that of a modulation analyzer,allowing you to view amplitude, frequency, and phase profiles versus time.The digital demodulator performs a broad range of measurements on manydigital communications standards (such as W-CDMA, GSM, cdma2000, andmore) and produces many useful measurement displays and signal-qualitydata.Although the VSA clearly provides important benefits, the conventionalanalog swept-tuned analyzers can provide higher frequency coverage andincreased dynamic range capability.VSA measurement concepts and theory of operationAs mentioned earlier, the VSA is fundamentally a digital system thatuses DSP to perform spectrum analysis with FFTs, and uses demodulatoralgorithms to perform vector-modulation analysis. You may recall fromFourier analysis, that the FFT is a mathematical algorithm that operates ontime-sampled data and provides time-to-frequency domain transformations.The analog signal must be digitized in the time-domain, then the FFTalgorithm executes to compute the spectra. Conceptually, the VSAimplementation is simple and straightforward: digitize the input signal,then compute the measurement results. See Figure 1-3. However, inpractice, there are many factors that must be accounted for in order forthe measurement to be meaningful and accurate. (For more informationabout FFT analysis, refer to the References section at the end of thisapplication note.)Digitzed 1kHz sine wave1 kHz sine wavetADCSampler andA/D converter. . . . . . . . . . . t. .Time record1 kHz spectrumFFT1 kHzFast Fourier transform(FFT) processingfFrequency spectrumFigure 1-3. 1 kHz FFT analysis example: digitize time-domain signal and use FFT analysis to convertit to the frequency domain5
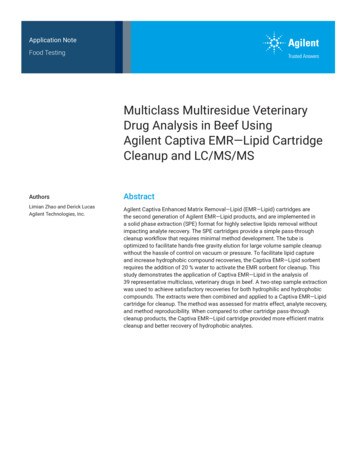
If you are familiar with FFT analysis, you already know the FFT algorithmmakes several assumptions about the signal it is processing. The algorithmdoesn’t check to verify the validity of these assumptions for a given input,and it will produce invalid results, unless you or the instrument validatesthe assumptions. Fortunately, as you will learn in the following discussion,the Agilent VSA implementation was designed with FFT-based analysis inmind. It has many integrated features to eliminate potential error sources,plus enhancements that provide swept-tuned usability in an FFT-basedanalyzer.Figure 1-4 illustrates a general system block diagram of a VSA analyzer.Different manufacturers might use slightly different designs and, throughDSP, many of the functions could occur at different places. Figure 1-4 showsa generalized diagram of the technique that Agilent uses in its VSAs. TheVSA spectrum analysis measurement process includes these fundamentalstages:1.2.3.4.5.6.Signal conditioning with frequency translationAnalog-to-digital conversionQuadrature detectionDigital filtering and resamplingData windowingFFT analysis (for vector modulation, blocks 5 and 6 are replacedwith the demodulator edetectorSignal ngfiltersSamplememory6FFTDemodulator"Vector modulationanalysis"Time-domainFigure 1-4. Vector signal analyzer simplified block diagramWindow"Spectrum analysis"DSPtechniquesNote: Actual VSA implementationmay be different.6DisplayCode-domainAttenuationAC/DC couplinggain amplifiers5Modulation-domainADCDigitalLO90 degsMixerRFinput4Time datacorrections3Resampling(arbitary spans)2Sampled timedata1Freq-domainThe first stage of the measurement process is called signal conditioning.This stage includes several important functions that condition and optimizethe signal for the analog-to-digital conversion and FFT analysis. The firstfunction is AC and DC coupling. This option is necessary if you need toremove unwanted DC biases in the measurement setup. Next, the signal iseither amplified or attenuated for optimal signal level into the mixer. Themixer stage provides frequency translation, or RF-to-IF downconversion,and mixes the signal down to the final IF. This operation is the same asthe superheterodyne function of the swept-tuned analyzer and extendsFFT analysis capabilities through microwave. In practice, it may take severaldownconversion stages to reach the final IF frequency. Some analyzersprovide external IF input capability; by providing your own IF, you canextend the upper frequency range of the analyzer to match a receiveryou provide.
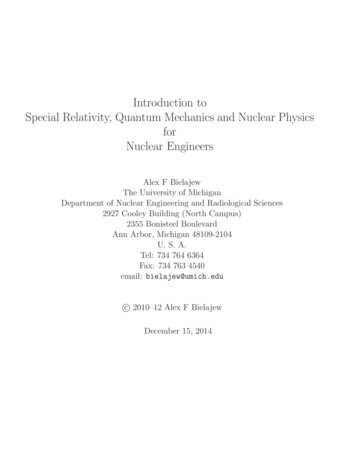
The final stage of the signal conditioning process is extremely important to asampled system and FFT analysis; signal alias protection. The anti-alias filterperforms this function. An analyzer that does not have adequate protectionfrom aliasing may show frequency components that are not part of theoriginal signal. The sampling theorem states that if the signal is sampledat a rate greater than 2 times the highest significant frequency componentpresent in the signal, the sampled signal can be reconstructed exactly.The minimum acceptable sample rate is called the Nyquist rate. Thus,fs 2 (fmax)wherefs sample ratefmax highest frequency componentIf the sampling theorem is violated, “aliasing” error products can result.Therefore, to prevent alias products for a given maximum frequency, theremust not be significant signal energy above 1/2 the sample rate. Figure 1-5shows a set of sample points, which fit two different waveforms. Thehigher-frequency waveform violates the sampling theorem. Unless ananti-alias filter is used, the two frequencies will be indistinguishable whenprocessed digitally.To prevent aliasing, two conditions must be satisfied:1. The input signal to the digitizer/sampler must be band limited. In otherwords, there must exist a maximum frequency ( fmax) above which nofrequency components are present.2. The input signal must be sampled at a rate that satisfies the samplingtheorem.The solution to the aliasing problem seems simple enough. First you selectthe maximum frequency ( fmax) that the analyzer will measure, then makesure the sampling frequency ( fs) is twice that frequency. This step satisfiescondition number 2 and makes sure that the analyzer can accurately measurethe frequencies of interest. Next you insert a low-pass filter (an anti-aliasingfilter) to remove all frequencies above fmax, thus ensuring that themeasurement will exclude all frequencies except those you are interestedin. This step satisfies condition number 1 and makes sure the signal isband limited.ActualsignalReconstructed "alias" signalUnwanted frequency components arefolded onto the spectrum below cutoff.X(f)ADC samplefspoints(a) Aliasing in the time-domainrecovered aliasspectrum followsdashed line.0fffs( f s /2)f(b) Aliasing in the frequency-domainFigure 1-5. Aliasing products occur when the signal is undersampled. Undesirable frequenciesappear under the alias of another (baseband) frequency7
There are two factors that complicate this simple anti-aliasing solution.The first, and easiest to address, is that the anti-alias filter has a finite rolloff rate. As shown in figure 1-6, there is a transition band in practical filtersbetween the passband and stopband. Frequencies within the transitionband could produce alias frequencies. To avoid these alias products, thefilter cutoff must be below the theoretical upper frequency limit of fs dividedby 2. An easy solution to this problem is to oversample (sample above theNyquist rate). Make the sampling frequency slightly above 2 times fmax sothat it is twice the frequency at which the stopband actually starts, not twicethe frequency you are trying to measure. Many VSA implementations usea guard band to protect against displaying aliased frequency components.The FFT computes the spectral components out to 50% of fs (equivalentlyfs/2). A guard band, between approximately 40% to 50% of fs (or fs/2.56 tofs/2), is not displayed because it may be corrupted by alias components.However, when the analyzer computes the inverse FFT, the signals in theguard band are used to provide the most accurate time-domain results.The high-roll-off-rate filter, combined with the guard band, suppressespotential aliasing components, attenuating them well below the noise floorof the analyzer.The second complicating factor in alias protection (limited frequencyresolution) is much harder to solve. First, an anti-alias filter that is designedfor wide frequency spans (high sample rates) is not practical for measuringsmall resolution bandwidths for two reasons; it will require a substantialsample size (memory allocation) and a prohibitively large number of FFTcomputations (long measurement times). For example, at a 10 MHz samplerate, a 10 Hz resolution bandwidth measurement would require more thana 1 million point FFT, which translates into large memory usage and a longmeasurement time. This is unacceptable because the ability to measuresmall resolution bandwidths is one of the main advantages of the VSA.One way of increasing the frequency resolution is by reducing fs, but this is atthe expense of reducing the upper-frequency limit of the FFT and ultimatelythe analyzer bandwidth. However, this is still a good approach because itallows you to have control over the resolution and frequency range of theanalyzer. As the sample rate is lowered, the cut-off frequency of the anti-aliasfilter must also be lowered, otherwise aliasing will occur. One possiblesolution would be to provide an anti-aliasing filter for every span, or a filterwith selectable cutoff frequencies. Implementing this scheme with analogfilters would be difficult and cost prohibitive, but it is possible to addadditional anti-alias filters digitally through DSP.Guard bandWidebandinput signalPassbandTransition StopbandBand limitedanalog signalADCf( fs / 2.56 ) ( fs / 2 )Anti-alias filterFigure 1-6. The anti-alias filter attenuates signals above fs/2. A guard band between 40% to 50%of fs is not displayed8
Digital decimating filters and resampling algorithms provide the solutionto the limited frequency resolution problem, and it is the solution usedin Agilent VSAs. Digital decimating filters and resampling perform theoperations necessary to allow variable spans and resolution bandwidths.The digital decimating filters simultaneously decrease the sample rate andlimit the bandwidth of the signal (providing alias protection). The samplerate into the digital filter is fs; the sample rate out of the filter is fs/n, where“n” is the decimation factor and an integer value. Similarly, the bandwidthat the input filter is “BW,” and the bandwidth at the output of the filteris “BW/n”. Many implementations perform binary decimation (divide-by-2sample rate reduction), which means that the sample rate is changed byinteger powers of 2, in 1/(2n) steps (1/2, 1/4, 1/8.etc). Frequency spansthat result from “divide by 2n” are called cardinal spans. Measurementsperformed at cardinal spans are typically faster than measurementsperformed at arbitrary spans due to reduced DSP operations.The decimating filters allow the sample rate and span to be changed bypowers of two. To obtain an arbitrary span, the sample rate must be madeinfinitely adjustable. This is done by means of a resampling or interpolationfilter, which follows the decimation filters. For more details regardingresampling and interpolation algorithms, refer to the References section atthe end of this application note.Even though the digital and resampling filters provide alias protection whilereducing the sample rate, the analog anti-alias filter is still required, sincethe digital and resampling filters are, themselves, a sampled system whichmust be protected from aliasing. The analog anti-alias filter protects theanalyzer at its widest frequency span with operation at fs. The digital filtersfollow the analog filter and provide anti-alias protection for the narrower,user-specified spans.The next complication that limits the ability to analyze small resolutionbandwidths is caused by a fundamental property of the FFT algorithm itself;the FFT is inherently a baseband transform. This means that the frequencyrange of the FFT starts from 0 Hz (or DC) and extends to some maximumfrequency, fs divided by 2. This can be a significant limitation in measurementsituations where a small frequency band needs to be analyzed. For example,if an analyzer has a sample rate of 10 MHz, the frequency range would be0 Hz to 5 MHz ( fs/2). If the number of time samples (N) were 1024, thefrequency resolution would be 9.8 kHz ( fs/N). This means that frequenciescloser than 9.8 kHz could not be resolved.As just mentioned, you can control the frequency span by varying the samplerate, but the resolution is still limited because the start frequency of thespan is DC. The frequency resolution can be arbitrarily improved, butat the expense of a reduced maximum frequency. The solution to theselimitations is a process called band selectable analysis, also known as zoomoperation or zoom mode. Zoom operation allows you to reduce the frequencyspan while maintaining a constant center frequency. This is very usefulbecause it allows you to analyze and view small frequency componentsaway from 0 Hz. Zooming allows you to focus the measurement anywherewithin the analyzers frequency range (Figure 1-7).9
Zoom operation is a process of digital quadrature mixing, digital filtering,and decimating/resampling. The frequency span of interest is mixed with acomplex sinusoid at the zoom span center frequency ( fz), which causes thatfrequency span to be mixed down to baseband. The signals are filtered anddecimated/resampled for the specified span, all out-of-band frequenciesremoved. This is the band-converted signal at IF (or baseband) and issometimes referred to as “zoom time” or “IF time”. That is, it is the timedomain representation of a signal as it would appear in the IF section ofa receiver. Zoom measurements are discussed further in the “Time-domaindisplay” section near the end of this chapter.Sample memoryThe output of the digital decimating filters represents a bandlimited, digitalversion of the analog input signal in time-domain. This digital data stream iscaptured in sample memory (Figure 1-4). The sample memory is a circularFIFO (first in, first out) buffer that collects individual data samples intoblocks of data called time records, to be used by the DSP for further dataprocessing. The amount of time required to fill the time record is analogousto the initial settling time in a parallel-filter analyzer. The time data collectedin sample memory is the fundamental data used to produce all measurementresults, whether in the frequency domain, time domain, or modulation domain.Time domain data correctionsTo provide more accurate data results, many VSAs implement time datacorrection capability through an equalization filter. In vector analysis, theaccuracy of the time data is very important. Not only is it the basis for all ofthe demodulation measurements, but it is also used directly for measurementssuch as instantaneous power as a function of time. Correcting the time datais the last step in creating a nearly ideal bandlimiting signal path. While thedigital filters and resampling algorithms provide for arbitrary bandwidths(sample rates and spans), the time-domain corrections determine the finalpassband characteristic of the signal path. Time-domain corrections wouldbe unnecessary if the analog and digital signal paths could be made ideal.Time-domain corrections function as an equalization filter to compensatefor passband imperfections. These imperfections come from many sources.The IF filters in the RF section, the analog anti-aliasing filter, the decimatingfilters, and the resampling filters all contribute to passband ripple andphase nonlinearities within the selected span.Broadband time-domain signalTime-domainbasebandDigital LO frequency spectrum at fz(a)t(d)fz0 HzFrequency translated version of the zoom spanFrequency-domainresponse(b)(e)Band selectableanalysis(zoom-mode)fmaxfz0 Hz–fstart0 HzZoom spanfstopSpectrum display(c)fstartfzfstop(Zoom span center frequency)(f)fstartfzfstopAnalyzer displayFigure 1-7. Band-selectable analysis (or zoom mode): (a) measured broadband signal,(b) spectrum of the measured signal, (c) selected zoom span and center frequency,(d) digital LO spectrum (@ zoom center frequency), (e) frequency span mixed down to baseband,(f) display spectrum annotation is adjusted to show the correct span and center frequency10
The design of the equalization filter begins by extracting information aboutthe analog signal path from the self-calibration data based on the instrument’sconfiguration. This is the data used to produce the frequency-domaincorrection output display. Once the analog correction vector has beencomputed, it is modified to include the effects of the decimating andresampling filters. The final frequency response computations cannot beperformed until after you have selected the span, because that determinesthe number of decimating filter stages and resampling ratio. The compositecorrection vector serves as the basis for the design of the digital equalizationfilter that is applied to the time data.Data windowing - leakage and resolution bandwidthThe FFT assumes that the signal it is processing is periodic from time recordto time record. However most signals are not periodic in the time recordand a discontinuity between time records will occur. Therefore, this FFTassumption is not valid for most measurements, so it must be assumed thata discontinuity exists. If the signal is not periodic in the time record, theFFT will not estimate the frequency components accurately. The resultanteffect is called leakage and has the affect of spreading the energy from asingle frequency over a broad range of frequencies. Analog swept-tunedspectrum analyzers will produce similar amplitude and spreading errorswhen the sweep speed is too fast for the bandwidth of the filter.Data windowing is the usual solution to the leakage problem. The FFT isnot the cause of the error; the FFT is generating an “exact” spectrum for thesignal in the time record. It is the non-periodic signal characteristics betweentime records that cause the error. Data windowing uses a window functionto modify the time-domain data by forcing it to become periodic in the timerecord. In effect, it forces the waveform to zero at both ends of the timerecord. This is accomplished by multiplying the time record by a weightedwindow function. Windowing distorts the data in the time domain to improveaccuracy in the frequency domain. See Figure 1-8.OriginalsignalSampledtime recordWindowfunctionXDiscontinuities inthe time-recordLogdBModifiedwaveform TruespectrumSpectrumwith leakagefLogdBReduced leakagespectrumfFigure 1-8. Window functions reduce the leakage errors in the frequency domain by modifying thetime domain waveform11
Analyzers automatically select the appropriate window filter based onassumptions of the user’s priorities, derived from the selected measurementtype. However, if you want to manually change the window type, VSAsusually have several built-in window types that you can select from. Eachwindow function, and the associated RBW filter shape, offers particularadvantages and disadvantages. A particular window type may trade offimproved amplitude accuracy and reduced “leakage” at the cost of reducedfrequency resolution. Because each window type produces differentmeasurement results (just how different depends on the characteristicsof the input signal and how you trigger on it), you should carefully selecta window type appropriate for the measurement you are trying to make.Table 1-1 summarizes four common window types and their uses.Table 1-1. Common window types and usesWindowCommon usesUniform (rectangular, boxcar)HanningGaussian topFlat topTransient and self-windowing dataGeneral purposeHigh dynamic rangeHigh amplitude accuracyThe window filter contributes to the resolution bandwidthIn traditional swept-tuned analyzers, the final IF filter determines theresolution bandwidth. In the FFT analyzers, the window type determinesthe resolution bandwidth filter shape. And the window type, along with thetime-record length, determines the width of the resolution bandwidth filter.Therefore, for a given window type, a change in resolution bandwidth willdirectly affect the time-record length. Conversely, any change to time-recordlength will cause a change in resolution bandwidth as shown in the followingformula:RBWwhere normalized ENBW / TENBW equivalent noise bandwidthRBW resolution bandwidthT time-record lengthEquivalent noise bandwidth (ENBW) is a figure of merit that compares thewindow filter to an ideal,
Vector Signal Analysis Basics Application Note 150-15. 2 This application note serves as a primer on the vector signal analyzer (VSA). . (DSP) to provide high-resolution spectrum and network analysis, but are limited to low frequencies due to the limits of analog-to-digital conversion (ADC) and signal processing technologies. Today's wide .