Transcription
Lecture 3:Network Design and TopologyCS 598: Advanced InternetworkingMatthew CaesarJanuary 25, 20111
Administrivia2
Today’s lecture:Internet topology How should I design my network’stopology? What is the network topology of theInternet?– How can we measure the Internettopology? Can we model the Internet’s topology,e.g., for simulation purposes?– Interconnection patterns, trafficdistribution3
Today’s lecture:Internet topology Preliminaries– Network elements: router/link design Designing the topology– Hub-and-spoke, backbones,provider/peering Modeling the topology– Graph-based characterizations Measuring the topology– Traceroute probes, locating IP addresses4
Modeling the Topology
Characterizing the Internettopology Can we characterize the Internet’stopology?– Build understanding to informprotocol/architecture design– Create models to inform provisioning,perform accurate simulations Approach: abstract network as a graph– Intradomain: node router, edge link– Interdomain: node AS, edge peering6
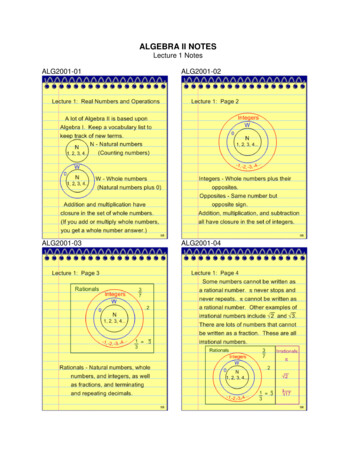
Erdős–Rényi model Edge exists betweeneach pair of nodes withan equal probability pp Edge probabilityindependent of otheredges Easy to mathematicallyanalyze, but not themost accurate model forreal-world networks7
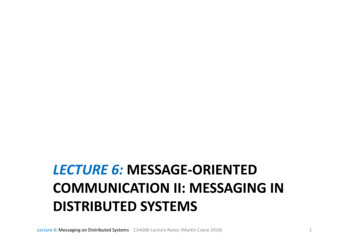
Waxman model(x1,y1)p ae-d/(bL)(x2,y2)d: distanceL: max distancebetween any two nodesParameters a 0, b 1 Place nodes in plane Probability of edgedepends on distancebetween nodes Aims to reflectgeographic layout ofnetwork– See also: gravitymodel for internettraffic8
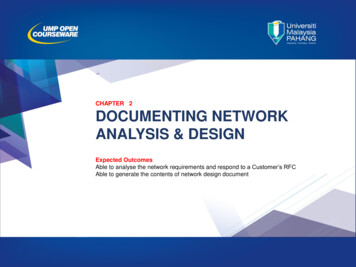
Transit-stub model Aims to modelstructural propertiessuch as networkbackbones Randomly generate agraph using Waxman’smethod9
Transit-stub model Aims to modelstructural propertiessuch as networkbackbones Randomly generate agraph using Waxman’smethod Expand each node toform a random graph(transit domain)10
Transit-stub model Aims to modelstructural propertiessuch as networkbackbones Randomly generate agraph using Waxman’smethod Expand each node toform a random graph(transit domain) Connect stub domainsto each transit domain11
Transit stub in practice Transit-stub looks good, but is it close to thereal thing? How to even answer this question? One way: write down a set of “metrics”,compare these metrics for generated graphagainst real Internet traces– Diameter, distribution of outdegree, mixing time,cut size, density, This approach was taken by “On the powerlaw relationships of the Internet topology,”Faloutsos, Faloutsos, Faloutsos, Sigcomm121999.
Faloutsos et al.’s findings Graphs can be decomposed into twocomponents: trees and core– 40-50% of nodes are in trees– Maximum observed depth of 3– 80% of trees are of depth 1 Outdegree is highly skewed13
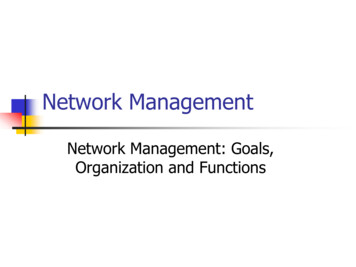
Router outdegrees are highlyskewed Plot [router outdegree] vs [rank, in order ofdecreasing outdegree] Exhibits Power Law distribution14
Do Waxman/Transit-stub give apower-law distribution?WaxmanTransit-stub15
Where do power laws comefrom? Power laws observed in WWW, socialnetworks, co-authorship of papers, actorsappearing in same movie, interactionsbetween proteins, etc. In these environments, there are “popular”nodes that are more desirable to connect to Idea of preferential attachment– A new node prefers to attach to an existing nodethat already has many connections– Eventually leads to system dominated by hubs16
Approach taken by the BRITEtopology generator Randomly generatea small graph17
Approach taken by the BRITEtopology generatorip diΣ djjϵG Randomly generatea small graph Incrementally add anode Connect to othernodes withprobabilityproportional toneighbor’soutdegree18
Measuring the Topology
Motivation for Measuring theTopology Business analysis– Comparisons with competitors– Selecting a provider or peer Scientific curiosity– Treating data networks like an organism– Understand structure and evolution of Internet Input to research studies– Network design, routing protocols, Interesting research problem in its own right– How to measure/infer the topology
Basic Idea: Measure from ManyAnglesSource 2Source 1
Where to Get Sources andDestinations? Source machines– Get accounts in many places Good to have a lot of friends– Use an infrastructure like PlanetLab Good to have friends who have lots of friends– Use public traceroute servers (nicely) http://www.traceroute.org Destination addresses– Walk through the IP address space One (or a few) IP addresses per prefix– Learn destination prefixes from public BGP tables http://www.route-views.org
Traceroute: Measuring theForwarding Path Time-To-Live field in IP packet header– Source sends a packet with a TTL of n– Each router along the path decrements theTTL– “TTL exceeded” sent when TTL reaches 0 Traceroute tool exploits this TTLbehaviorTTL 1sourceTimeexceededdestinationTTL 2Send packets with TTL 1, 2, 3, and record source of “time exceeded” message
Example Traceroute Output(Berkeley to CNN)Hop number, IP address, DNS nameNo responsefrom router1 169.229.62.1inr-daedalus-0.CS.Berkeley.EDU2 169.229.59.225soda-cr-1-1-soda-br-6-23 128.32.255.169vlan242.inr-202-doecev.Berkeley.EDU4 128.32.0.249gigE6-0-0.inr-666-doecev.Berkeley.EDU5 128.32.0.66qsv-juniper--ucb-gw.calren2.net6 net7 *?8 64.159.1.46?9 209.247.9.170pos8-0.hsa2.Atlanta2.Level3.net10 66.185.138.33pop2-atm-P0-2.atdn.net11 *?12 66.185.136.17pop1-atl-P4-0.atdn.net13 64.236.16.52www4.cnn.comNo name resolution
Problems with Traceroute Missing responses– Routers might not send “Time-Exceeded”– Firewalls may drop the probe packets– “Time-Exceeded” reply may be dropped Misleading responses– Probes taken while the path is changing– Name not in DNS, or DNS entry misconfigured– Forward path can differ from reverse path Mapping IP addresses– Mapping interfaces to a common router– Mapping interface/router to Autonomous System Angry operators who think this is an attack
Map Traceroute Hops to ASesTraceroute output: (hop number, IP)1 169.229.62.1AS252 169.229.59.225 AS25Berkeley3 128.32.255.169 AS254 128.32.0.249AS255 128.32.0.66AS11423 Calren6 209.247.159.109 AS33567 *AS33568 64.159.1.46AS33569 209.247.9.170AS335610 66.185.138.33AS166811 *AS166812 66.185.136.17AS166813 64.236.16.52AS5662 CNNLevel3AOLNeed accurateIP-to-AS mappings(for network equipment).
Candidate Ways to Get IP-to-ASMapping Routing address registry– Voluntary public registry such as whois.radb.net– Used by prtraceroute and “NANOG traceroute”– Incomplete and quite out-of-date Mergers, acquisitions, delegation to customers Origin AS in BGP paths– Public BGP routing tables such as RouteViews– Used to translate traceroute data to an AS graph– Incomplete and inaccurate but usually right Multiple Origin ASes (MOAS), no mapping, wrongmapping
Example: BGP Table (“show ip bgp” atRouteViews)Network* 3.0.0.0/8***** ** 9.184.112.0/20** ***Next HopMetric LocPrf Weight Path205.215.45.500 4006 701 80 i167.142.3.60 5056 701 80 i157.22.9.70 715 1 701 80 i195.219.96.2390 8297 6453 701 80 i195.211.29.2540 5409 6667 6427 3356 701 80 i12.127.0.2490 7018 701 80 i213.200.87.2549290 3257 701 80 i205.215.45.500 4006 6461 3786 i195.66.225.2540 5459 6461 3786 i203.62.248.40 1221 3786 i167.142.3.60 5056 6461 6461 3786 i195.219.96.2390 8297 6461 3786 i195.211.29.2540 5409 6461 3786 iAS 80 is General Electric, AS 701 is UUNET, AS 7018 is AT&TAS 3786 is DACOM (Korea), AS 1221 is Telstra
Problem of Missing Edges Limited collection of paths– Some edges might never be traversed– Especially low in the AS hierarchy– and backup links Example: paths from two tier-1 ISPs miss an edgeSprintAT&T?Harvardd1HarvardB-schoold2
Internet topology Preliminaries -Network elements: router/link design Designing the topology -Hub -and -spoke, backbones, provider/peering Modeling the topology -Graph-based characterizations Measuring the topology -Traceroute probes, locating IP addresses 4