Transcription
ANNUAL REPORTAMG FundsMarch 31, 2022AMG Pantheon Fund, LLCwww.amgfunds.com033122AR080
AMG FundsAMG Pantheon Fund, LLCAnnual Report—March 31, 2022TABLE OF CONTENTSPORTFOLIO MANAGER'S COMMENTS (unaudited)PAGE3FINANCIAL STATEMENTSStatement of Assets and Liabilities6Balance sheet, net asset value (NAV) per Unit computations andcumulative distributable earningsStatement of Operations8Detail of sources of income, expenses, and realized andunrealized gains (losses) during the fiscal yearStatements of Changes in Net Assets9Detail of changes in assets for the past two fiscal yearsStatement of Cash Flows10Detail of cash movements during the fiscal yearFinancial Highlights11Historical net asset values per Unit, distributions, total returns, income andexpense ratios, turnover ratios and net assetsNOTES TO FINANCIAL STATEMENTS16Accounting and distribution policies, details of agreements andtransactions with Fund management and affiliates, and descriptions ofcertain investment risksREPORT OF INDEPENDENT REGISTERED PUBLIC ACCOUNTING FIRM26OTHER TAX INFORMATION (unaudited)27DIRECTORS AND OFFICERS (unaudited)28Consolidated Financial Statements of AMG Pantheon Master Fund, LLCAppendix
AMG Pantheon Fund, LLCPortfolio Manager’s Comments (unaudited)OverviewFor the year ended March 31, 2022, AMG Pantheon Fund (the “Fund”) Class 4 units returned 18.36% while the MSCI World Index (the “Index”) returned 10.12% overthe same 12-month period. As the Fund invests substantially all of its assets in AMG Pantheon Master Fund, LLC (the “Master Fund”), the following discussionreflects the investments held in the Master Fund.Market Review and OutlookThe last year has been characterized by a slow emergence from the COVID-19 pandemic and a return to normal working and business conditions for much of theglobe. While certain geographies continue to grapple with the virus, vaccinations have quelled the worst of the pandemic in much of the world. 2022 has brought newchallenges in the form of geopolitical conflict, rising interest rates, and market volatility. Russia’s military action in Ukraine is obviously a matter of grave concern forthe global community and the immediate considerations are for the people living in the areas affected by the conflict. While the Master Fund has no direct exposure toRussia and Ukraine, there will likely be second order impacts stemming from sanctions and related fallout that will have further reaching implications in Europe andaround the world. We believe the implications of sanctions will be broad rather than acute. The direct impact of sanctions will be primarily on energy supply as well asa global reduction in supply and increased costs for some materials. Despite global economic and political challenges, we believe that the highest quality managerswill be able to appropriately navigate market turmoil and deliver compelling results for investors.Performance and PositioningThe Master Fund’s units returned 18.81% over the fiscal year versus a 10.12% return for the Index. While the first several months of the fiscal year were characterizedby a rising equity market, volatility returned in the later months of the fiscal year with four instances of the Index returning (2)% or less in a month. The Master Fundexhibited less volatility than the Index and significantly outperformed over the Index during the fiscal year.The Master Fund made 59 new investments over the last 12 months, resulting in approximately 714 million of new capital commitments. 28 of these investmentswere secondary investments, 23 were co-investments, and 8 were primary fund commitments. We believe the Master Fund was able to execute on its mandate toprovide a globally diversified portfolio to investors over the last year. Of the new investments that were completed over the last 12 months, 45 were in North America,12 were in Europe, one was in Asia, and one was in Australia. The Master Fund continues to seek opportunities on a global basis. As of March 31, 2022, the top foursector exposures in the Master Fund are as follows: Information Technology (31%), Healthcare (17%), Financials (15%), and Consumer Discretionary (12%).Pantheon Ventures (US) LP continues to favor investments in technology, healthcare, and financials while aiming to achieve diversification across industry sectorswithin the Master Fund. The Master Fund continues to deemphasize certain cyclical areas of the economy such as energy that are exposed to unpredictable commodityprice risk.During the twelve month period ended March 31, 2022, the Master Fund’s performance was driven primarily by uplift in co-investment deals, followed by theperformance of secondary holdings. Investments in primary funds detracted marginally from absolute performance during the period due to the “J-curve” effect of theearly stages of these investments.This commentary reflects the viewpoints of Pantheon Ventures (US) LP as of March 31, 2022 and is not intended as a forecast or guarantee of future results.3
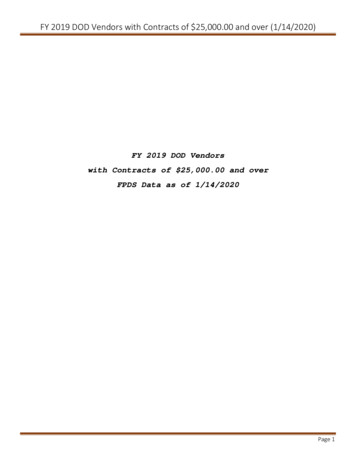
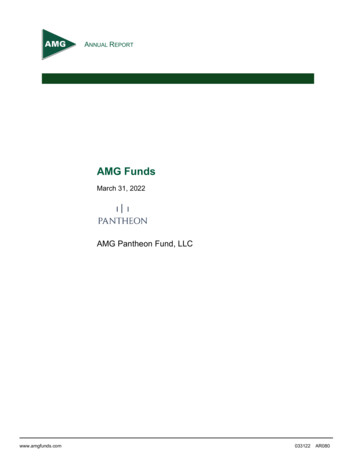
AMG Pantheon Fund, LLCPortfolio Manager’s Comments (continued)CUMULATIVE TOTAL RETURN PERFORMANCEThe Fund’s cumulative total return is based on the monthly change in net asset value (NAV), and assumes that all dividends and distributions were reinvested. Thisgraph compares a hypothetical 10,000 investment made in the Fund’s Class 4 units on October 1, 2014 to a 10,000 investment made in the MSCI World Index forthe same time period. The graph and table do not reflect the deduction of taxes that a unitholder would pay on a Fund distribution or redemption of units. The listedreturns for the Fund are net of expenses and the returns for the index exclude expenses. Total returns would have been lower had certain expenses not been reduced.Value of 10,000 Investment 25,000AMG Pantheon Fund, LLC Class 4MSCI World Index 24,764 20,565 20,000 15,000 10,000 5,000Sept-14 e table below shows the average annual total returns for AMG Pantheon Fund, LLC and MSCI World Index for the same time periods ended March 31, G Pantheon Fund, LLC—Class 13AMG Pantheon Fund, LLC—Class 2AMG Pantheon Fund, LLC—Class 3AMG Pantheon Fund, LLC—Class 4AMG Pantheon Fund, LLC—Class 27/1510/27/1509/30/1407/31/20MSCI World Index5,610.12%12.42%10.09%09/30/14†Average Annual Total Returns1AMG Pantheon Fund, LLC2The performance data shown represents past performance. Past performance is not a guarantee of future results. Current performance may be lower or higher than theperformance data quoted. The investment return and principal value of an investment will fluctuate so that an investor’s units, when redeemed, may be worth more orless than their original cost.Investors should carefully consider the Fund’s investment objectives, risks, charges and expenses before investing. For performance information through the mostrecent month end, current net asset values per unit for the Fund and other information, please call 877.355.1566 or visit our website at amgfunds.com for a freeprospectus. Read it carefully before investing or sending money.† Date reflects inception date of the Fund, not the index.1Total return equals income yield plus unit price change and assumes reinvestment of all dividends and capital gain distributions. Returns are net of fees and mayreflect offsets of Fund expenses as described in the prospectus. No adjustment has been made for taxes payable by unitholders on their reinvested dividends andcapital gain distributions. Returns for periods greater than one year are annualized. The listed returns on the Fund are net of expenses. All returns are in U.S.dollars ( ).2Effective July 31, 2020, Brokerage Class Units were renamed Class 1 Units, Advisory Class Units were renamed Class 2 Units, Institutional Class Units wererenamed Class 3 Units, Institutional Plus Class Units were renamed Class 4 Units, and Class 5 Units were established.4
AMG Pantheon Fund, LLCPortfolio Manager’s Comments (continued)3456The performance information for the Fund’s Class 1 units for periods prior to July 31, 2020 does not reflect the impact of the sales load that was in effect untilJuly 31, 2020.The Average Annual Total Returns include the impact of the maximum sales load of 3.50%.The MSCI World Index is a free float-adjusted market capitalization weighted index that is designed to measure the equity market performance of developed markets.The MSCI World Index consists of 23 developed market country indices. Please go to msci.com for most current list of countries represented by the Index. Unlikethe Fund, MSCI World Index is unmanaged, is not available for investment and does not incur fees.All MSCI data is provided “as is”. The products described herein are not sponsored or endorsed and have not been reviewed or passed on by MSCI. In no eventshall MSCI, its affiliates or any MSCI data provider have any liability of any kind in connection with the MSCI data or the products described herein. Copying orredistributing the MSCI data is strictly prohibited.5
AMG Pantheon Fund, LLCStatement of Assets and LiabilitiesMarch 31, 2022Assets:Investment in AMG Pantheon Master Fund, LLC, at value (cost 767,380,573; Units 44,516,888)Cash 909,480,0222,055,934Cash held in escrow69,396,364Receivable from Investment ManagerPrepaid expenses and other assetsTotal ptions in advance69,396,364Payable for Fund Units tendered565,684Accrued expenses:Administrative fees37,339Distribution fees376,445Other168,098Total Liabilities70,543,930Net Assets 910,709,442Net Assets Represent:Paid-in capital 769,936,897Distributable earnings140,772,545Net Assets 910,709,442The accompanying notes are an integral part of these financial statements.6
AMG Pantheon Fund, LLCStatement of Assets and Liabilities (continued)March 31, 2022Class 1:Net Assets 365,513,506Units outstanding17,899,406Net asset value, offering and redemption price per Unit 20.42Class 2:Net Assets 190,690,113Units outstanding9,134,616Net asset value, offering and redemption price per Unit 20.88Class 3:Net Assets 344,160,653Units outstanding16,220,264Net asset value, offering and redemption price per Unit 21.22Class 4:Net Assets 6,752,364Units outstanding313,030Net asset value, offering and redemption price per Unit 21.57Class 5:Net Assets 3,592,806Units outstanding176,783Net asset value and redemption price per Unit 20.32Maximum offering price per Unit 21.06The accompanying notes are an integral part of these financial statements.7
AMG Pantheon Fund, LLCStatement of OperationsFor the fiscal year ended March 31, 2022Expenses:Investment advisory and management feesAdministrative fees 3,767,889269,135Distribution fees - Class 11,286,184Distribution fees - Class 2597,812Distribution fees - Class 3601,348Distribution fees - Class 511,423Professional fees367,365Transfer agent fees206,113Registration fees122,331Directors fees and expenses68,215Reports to Investors16,584Custody fees10,554Miscellaneous expenses54,437Recoupment of prior expense reimbursementsTotal expenses before offsetsFee waiver714,0448,093,434(3,767,889)Net expenses4,325,545Net investment loss(4,325,545)Net Realized and Unrealized Gain (Loss):Capital gain distributions received26,594,705Net change in unrealized appreciation/depreciation of investments88,410,166Net realized and unrealized gainNet increase in net assets resulting from operationsThe accompanying notes are an integral part of these financial statements.8115,004,871 110,679,326
AMG Pantheon Fund, LLCStatements of Changes in Net AssetsFor the fiscal years ended March 31, 2022 and March 31, 2021For the fiscalyear endedMarch 31, 2022For the fiscalyear endedMarch 31, 2021Increase (Decrease) in Net Assets Resulting From Operations:Net investment loss (4,325,545) (611,259)Capital gain distributions received26,594,7051,839,968Net change in unrealized appreciation/depreciation of 87Net increase in net assets resulting from operationsDistributions to Investors:Class 1#(8,329,602)(66,957)Class 2#(5,044,649)(564,493)Class 3#(9,658,201)(1,168,584)Class 4#(197,808)(40,328)#Class 5Total distributions to al Unit Transactions:1Net increase from capital Unit transactionsTotal increase in net Net Assets:Beginning of yearEnd of year#1268,983,81895,116,857 910,709,442 268,983,818Effective July 31, 2020, Brokerage Class Units were renamed Class 1 Units, Advisory Class Units were renamed Class 2 Units,Institutional Class Units were renamed Class 3 Units, Institutional Plus Class Units were renamed Class 4 Units, and Class 5Units were established. (See Note 1 of the Notes to Financial Statements.)See Note 1(g) of the Notes to Financial Statements.The accompanying notes are an integral part of these financial statements.9
AMG Pantheon Fund, LLCStatement of Cash FlowsFor the fiscal year ended March 31, 2022Cash Flows from Operating Activities:Net increase in net assets resulting from operations 110,679,326Adjustments to reconcile net increase in net assets resulting from operations to net cash used inoperating activities:Capital gain distributions received(26,594,705)Net change in unrealized appreciation/depreciation of investments(88,410,166)Increase in receivable from Investment ManagerIncrease in prepaid expenses and other assetsIncrease in administrative fees payableIncrease in distribution fees payableIncrease in other accrued expensesPurchases of Master 45)Net cash used in operating activities(529,657,647)Cash Flows from Financing Activities:Proceeds from capital Unit transactions (including change in subscriptions in advance of 32,902,864 and decrease in capital stock receivable of 52,986)569,860,882Disbursements from capital Unit transactions tendered (including change in payable for Fund Unitstendered of 185,131)(2,600,799)Distributions paid in cash(3,443,066)Net cash provided by financing activitiesNet increase in cashCash at beginning of year563,817,01734,159,370137,292,928Cash at end of year1 71,452,298Supplemental Disclosure of Cash Flow InformationNon-Cash Transactions:Reinvestment of distributions 19,861,775Capital gain distributions received and subsequent reinvestment into the Master Fund2Gross amount of Units converted12Includes cash and cash held in escrow on the statement of assets and liabilities.See Note 1(g) of the Notes to Financial Statements for non-cash Unit conversions between the classes.The accompanying notes are an integral part of these financial statements.10 26,594,705 15,045,470
AMG Pantheon Fund, LLCFinancial HighlightsFor a Unit outstanding throughout each fiscal year2022For the fiscal years ended March 31,2021202020192018Class 1 Units*Net Asset Value, Beginning of Year 18.04Income (Loss) from Investment Operations:Net investment loss1,2(0.21)Net realized and unrealized gain frominvestmentsTotal from investment operationsLess Distributions to Investors from:Net investment income 13.55 14.06 13.12 .104.660.461.161.53–––(0.17)–Net realized gain on investments(0.72)(0.17)(0.97)(0.05)(0.01)Total distributions to unitholders(0.72)(0.17)(0.97)(0.22)(0.01)Net Asset Value, End of YearTotal Return1 20.4217.49% 18.0434.63% 13.55 14.06 13.123.10%8.97%13.18%Ratio/Supplemental Data:Ratio of net expenses to average netassets1.10%30.92%31.00%1.00%1.00%Ratio of gross expenses to averagenet 1.00%)(1.00%)(1.00%)14%0%0%59%0%5 365,514 36,768 15 14 13Ratio of net investment loss toaverage net assets1Portfolio turnover rate (Master Fund)Net assets, end of year (in thousands)*Effective July 31, 2020, Brokerage Class Units were renamed Class 1 Units.1Total return and net investment income would have been lower had certain expenses not been offset.2Per Unit numbers have been calculated using average Units.3Such ratio includes recoupment of waived/reimbursed fees from prior periods amounting to 0.13% and 0.01% for the fiscal yearsended March 31, 2022 and March 31, 2021, respectively.4Excludes the impact of expense reimbursements or fee waivers and expense reductions, but includes expense recoupmentsand non-reimbursable expenses, if any, such as interest and taxes.5Less than 0.5%.11
AMG Pantheon Fund, LLCFinancial Highlights (continued)For a Unit outstanding throughout each fiscal year2022For the fiscal years ended March 31,2021202020192018Class 2 Units*Net Asset Value, Beginning of Year 18.39Income (Loss) from Investment Operations:Net investment loss1,2(0.16)Net realized and unrealized gain frominvestmentsTotal from investment operationsLess Distributions to Investors from:Net investment income 13.76 14.19 13.27 .214.800.541.241.60–––(0.27)–Net realized gain on investments(0.72)(0.17)(0.97)(0.05)(0.01)Total distributions to unitholders(0.72)(0.17)(0.97)(0.32)(0.01)Net Asset Value, End of YearTotal Return1 20.8817.76% 18.3935.12% 13.76 14.19 13.273.64%9.53%13.69%Ratio/Supplemental Data:Ratio of net expenses to average netassets0.85%30.56%30.50%0.50%0.50%Ratio of gross expenses to averagenet .50%)(0.50%)(0.50%)14%0%0%59%0%5 190,690 73,555 33,062 11,955 1,430Ratio of net investment loss toaverage net assets1Portfolio turnover rate (Master Fund)Net assets, end of year (in thousands)*Effective July 31, 2020, Advisory Class Units were renamed Class 2 Units.1Total return and net investment income would have been lower had certain expenses not been offset.2Per Unit numbers have been calculated using average Units.3Such ratio includes recoupment of waived/reimbursed fees from prior periods amounting to 0.13% and less than 0.005% for thefiscal years ended March 31, 2022 and March 31, 2021, respectively.4Excludes the impact of expense reimbursements or fee waivers and expense reductions, but includes expense recoupmentsand non-reimbursable expenses, if any, such as interest and taxes.5Less than 0.5%.12
AMG Pantheon Fund, LLCFinancial Highlights (continued)For a Unit outstanding throughout each fiscal yearFor the fiscal years ended March 31,20212020201920222018Class 3 Units*Net Asset Value, Beginning of Year 18.63Income (Loss) from Investment Operations:Net investment loss1,2(0.12)Net realized and unrealized gain frominvestmentsTotal from investment operationsLess Distributions to Investors from:Net investment income 13.91 14.30 13.37 .314.890.581.271.65–––(0.29)–Net realized gain on investments(0.72)(0.17)(0.97)(0.05)(0.01)Total distributions to unitholders(0.72)(0.17)(0.97)(0.34)(0.01)Net Asset Value, End of YearTotal Return1 21.22 18.6318.07%35.39% 13.91 14.30 13.373.89%9.70%14.06%Ratio/Supplemental Data:Ratio of net expenses to average netassets0.60%30.30%30.25%0.25%0.25%Ratio of gross expenses to averagenet .25%)(0.25%)(0.25%)14%0%0%59%0%5 344,161 153,552 58,897 17,122 1,672Ratio of net investment loss toaverage net assets1Portfolio turnover rate (Master Fund)Net assets, end of year (in thousands)*Effective July 31, 2020, Institutional Class Units were renamed Class 3 Units.1Total return and net investment income would have been lower had certain expenses not been offset.2Per Unit numbers have been calculated using average Units.3Such ratio includes recoupment of waived/reimbursed fees from prior periods amounting to 0.13% and less than 0.005% for thefiscal years ended March 31, 2022 and March 31, 2021, respectively.4Excludes the impact of expense reimbursements or fee waivers and expense reductions, but includes expense recoupmentsand non-reimbursable expenses, if any, such as interest and taxes.5Less than 0.5%.13
AMG Pantheon Fund, LLCFinancial Highlights (continued)For a Unit outstanding throughout each fiscal year2022For the fiscal years ended March 31,2021202020192018Class 4 Units*Net Asset Value, Beginning of Year 18.88Income (Loss) from Investment Operations:Net investment loss1,2(0.07) 14.06 14.41 13.44 11.77(0.01)(0.00)3(0.00)3(0.00)3Net realized and unrealized gain frominvestments3.485.000.621.331.68Total from investment operations3.414.990.621.331.68Less Distributions to Investors from:Net investment income–––(0.31)–Net realized gain on investments(0.72)(0.17)(0.97)(0.05)(0.01)Total distributions to unitholders(0.72)(0.17)(0.97)(0.36)(0.01)Net Asset Value, End of YearTotal Return1 21.5718.36% 18.8835.72% 14.064.15% 14.4110.11% 13.4414.26%Ratio/Supplemental Data:Ratio of net expenses to average netassets0.35%40.05%40.00%50.00%50.00%5Ratio of gross expenses to averagenet .00%)5(0.00%)5(0.00%)514%0%0%59%0%7 6,752 5,095 3,144 3,868 3,680Ratio of net investment loss toaverage net assets1Portfolio turnover rate (Master Fund)Net assets, end of year (in thousands)*Effective July 31, 2020, Institutional Plus Class Units were renamed Class 4 Units.1Total return and net investment income would have been lower had certain expenses not been offset.2Per Unit numbers have been calculated using average Units.3Less than (0.005).4Such ratio includes recoupment of waived/reimbursed fees from prior periods amounting to 0.13% and less than 0.005% for thefiscal years ended March 31, 2022 and March 31, 2021, respectively.5Less than 0.005% or (0.005%).6Excludes the impact of expense reimbursements or fee waivers and expense reductions, but includes expense recoupmentsand non-reimbursable expenses, if any, such as interest and taxes.7Less than 0.5%.14
AMG Pantheon Fund, LLCFinancial Highlights (continued)For a Unit outstanding throughout each fiscal periodFor the fiscalyear endedMarch 31, 2022For the fiscalperiod endedMarch 31, 2021*Class 5 UnitsNet Asset Value, Beginning of Period 18.01 14.37Income (Loss) from Investment Operations:Net investment loss1,2Net realized and unrealized gain from investmentsTotal from investment operations(0.25)(0.11)3.283.923.033.81Less Distributions to Investors from:Net realized gain on investmentsTotal distributions to unitholdersNet Asset Value, End of Period(0.72)(0.17)(0.72)(0.17) 20.32Total Return1,317.13% 18.0126.73%4Ratio/Supplemental Data:Ratio of net expenses to average net assetsRatio of gross expenses to average net assets7Ratio of net investment loss to average net assets1Portfolio turnover rate (Master %Net assets, end of period (in thousands) 3,5930%4 13*Class commenced operations on July 31, 2020.1Total return and net investment income would have been lower had certain expenses not been offset.2Per Unit numbers have been calculated using average Units.3Excludes the effects of any sales charges.4Not annualized.5Annualized.6Such ratio includes recoupment of waived/reimbursed fees from prior periods amounting to 0.13% and less than 0.005% for thefiscal years ended March 31, 2022 and March 31, 2021, respectively.7Excludes the impact of expense reimbursements or fee waivers and expense reductions, but includes expense recoupmentsand non-reimbursable expenses, if any, such as interest and taxes.15
AMG Pantheon Fund, LLCNotes to Financial StatementsMarch 31, 20221. ORGANIZATION AND SUMMARY OF SIGNIFICANT ACCOUNTING POLICIESAMG Pantheon Fund, LLC (the “Fund”) is organized as a Delaware limited liability company andis registered under the Investment Company Act of 1940, as amended (the “1940 Act”) as aclosed-end, non-diversified management investment company. The Fund’s term is perpetualunless the Fund is otherwise terminated under the terms of the Fund’s organizationaldocuments. The Fund’s investment objective is to seek long-term capital appreciation. Inpursuing its investment objective, the Fund invests substantially all of its assets in AMGPantheon Master Fund, LLC, an affiliate of the Fund, which has the same investment objectiveand investment policies as those of the Fund. AMG Pantheon Master Fund, LLC makesinvestments directly and through its wholly owned subsidiaries, AMG Pantheon SubsidiaryFund, LLC (the “Corporate Subsidiary”) and AMG Pantheon Lead Fund, LLC (the “Lead Fund”and together with AMG Pantheon Master Fund, LLC and the Corporate Subsidiary, the “MasterFund” or the “Underlying Funds”). As of March 31, 2022, the Fund owned 84.7% of the Units inthe Master Fund. The performance of the Fund is directly affected by the performance of theMaster Fund. The consolidated financial statements of the Master Fund, including theConsolidated Schedule of Investments, are included elsewhere in this report and should be readin conjunction with the Fund’s financial statements.The Fund offers five classes of Units (each a “Unit” and collectively, “Units”). On July 31, 2020,Brokerage Class was renamed Class 1, Advisory Class was renamed Class 2, InstitutionalClass was renamed Class 3, Institutional Plus was renamed Class 4, and the Fund beganoffering Class 5 Units. Each Unit is offered to “accredited investors” (as defined in Regulation Dunder the Securities Act of 1933, as amended (the “Securities Act”)) and may be purchased ona continuous basis as of the first business day of each month at the class’s net asset value(“NAV”) per Unit. The Units of Class 1, Class 2, Class 3, Class 4, and Class 5 generally haveidentical voting rights, but each Unit class may vote separately when required by law. DifferentUnit classes may have different net asset values per Unit to the extent the Unit classes paydifferent distribution amounts and/or the expenses of such Unit classes differ. Each Unit classhas its own expense structure. Sales of Units of Class 5 will incur a sales load up to 3.50%. Forthe fiscal year ended March 31, 2022, investors in Class 5 paid 44,650 to the distributor, thesub-distributor, selling agents or other financial intermediaries relating to sales loads charged onClass 5 subscriptions. Effective July 31, 2020, the sales load of up to 3.50% applicable to theFund’s Class 1 Units was eliminated. The Fund has registered 2,000,000,000 in Units for saleunder the Securities Act and offers Units of Class 1, Class 2, Class 3, Class 4, and Class 5 tothe public under the Securities Act.To provide liquidity to unitholders of the Fund (“Investors”), the Fund may, from time to time,offer to repurchase Units pursuant to written tenders by Investors. Repurchases will be made atsuch times, in such amounts and on such terms as may be determined by the Fund’s Board ofDirectors (the “Board” or the “Directors”).The Fund’s financial statements are prepared in accordance with accounting principlesgenerally accepted in the United States of America (“U.S. GAAP”), including accounting and16
AMG Pantheon Fund, LLCNotes to Financial Statements (continued)reporting guidance pursuant to Accounting Standards Codification Topic 946 applicable toinvestment companies. U.S. GAAP requires management to make estimates and assumptionsthat affect the reported amounts of assets and liabilities and disclosure of contingent assets andliabilities at the date of the financial statements and the reported amounts of income andexpenses during the reporting period. Actual results could differ from those estimates and suchdifferences could be material. The following is a summary of significant accounting policiesfollowed by the Fund in the preparation of its financial statements:a. VALUATION OF INVESTMENTS: The Fund records its investment in the Master Fundat a value based on the NAV per Unit of the Master Fund. Valuation policies forsecurities held by the Master Fund are discussed in Note 1(a) of the Master Fund’sNotes to Consolidated Financial Statements.b. SECURITY TRANSACTIONS: For financial reporting purposes, contributions to andwithdrawals from the Master Fund are accounted for on a trade date basis. Securitytransactions are accounted for as of trade date. Realized gains and losses onwithdrawals from the Master Fund and on securities sold are determined on the basis ofidentified cost. For the fiscal year ended March 31, 2022, the Fund purchased 525,511,345 of the Master Fund and did not redeem any Units of the Master Fund.The Master Fund may, from time to time, offer to repurchase Units pursuant to writtentenders by the Master Fund’s investors. Repurchases will be made at such times, insuch amounts and on such terms as may be determined by the Master Fund’s Board ofDirectors.c. INVESTMENT INCOME AND EXPENSES: Dividend income, including distributions fromthe Master Fund, is recorded on the ex-dividend date. Expenses are recorded on anaccrual basis. Legal fees are apportioned between the Fund and the Master Fund basedon level of service. The Fund indirectly bears its proportional share of the Master Fund’sexpenses, which is reflected in the NAV of the Master Fund’s Units. During the fiscalyear ended March 31, 2022, the Fund’s proportional share of the Master Fund’sexpenses, current tax expense and deferred tax expense were 7,439,727, 989,269and 1,245,624 respectively, which represents 1.38%, 0.18% and 0.23%, respectively,of the Fund’s average investment balance in the Master Fund.Investment income, realized and unrealized gains and losses, the common expenses ofthe Fund, and certain Fund level expense reductions, if any, are allocated on a pro-ratabasis to each class based on the relative net assets of each class to the total net assetsof the Fund.d. DIVIDENDS AND DISTRIBUTIONS: Fund distributions resulting from either netinvestment income or realized net capital gains, if any, will normally be declared andpaid at least annually as described in the Fund’s prospectus. Distributions to Investorsare recorded on the ex-dividend d
While the Master Fund has no direct exposure to . The direct impact of sanctions will be primarily on energy supply as well as a global reduction in supply and increased costs for some materials. Despite global economic and political challenges, we believe that the highest quality managers . Prepaid expenses and other assets 208,450 Total .