Transcription
Flow CytometryFlow Cytometry Basics Guide
Table of ContentsChapter 1Principles of the Flow CytometerFluidics System. . . . . . . . . . . . . . . . . . . . . . . . . . . . . . . . . . . . . . . . . . . . . . . . . . . . . . . . . . . . . . . . . . . . . . . . . . . 3Optics and Detection. . . . . . . . . . . . . . . . . . . . . . . . . . . . . . . . . . . . . . . . . . . . . . . . . . . . . . . . . . . . . . . . . . . . . . . 4Signal and Pulse Processing. . . . . . . . . . . . . . . . . . . . . . . . . . . . . . . . . . . . . . . . . . . . . . . . . . . . . . . . . . . . . . . . . 6Electrostatic Cell Sorting. . . . . . . . . . . . . . . . . . . . . . . . . . . . . . . . . . . . . . . . . . . . . . . . . . . . . . . . . . . . . . . . . . . . 9Chapter 2Principles of FluorescenceFluorophores and Light . . . . . . . . . . . . . . . . . . . . . . . . . . . . . . . . . . . . . . . . . . . . . . . . . . . . . . . . . . . . . . . . . . . . 11Fluorescence. . . . . . . . . . . . . . . . . . . . . . . . . . . . . . . . . . . . . . . . . . . . . . . . . . . . . . . . . . . . . . . . . . . . . . . . . . . . 12Why Use a Fluorescent Marker? . . . . . . . . . . . . . . . . . . . . . . . . . . . . . . . . . . . . . . . . . . . . . . . . . . . . . . . . . . . . . 13Which Fluorophores are Useful for Flow Cytometry?. . . . . . . . . . . . . . . . . . . . . . . . . . . . . . . . . . . . . . . . . . . . . . 13Single and Tandem Dyes. . . . . . . . . . . . . . . . . . . . . . . . . . . . . . . . . . . . . . . . . . . . . . . . . . . . . . . . . . . . . . . . . 14Fluorescent Proteins . . . . . . . . . . . . . . . . . . . . . . . . . . . . . . . . . . . . . . . . . . . . . . . . . . . . . . . . . . . . . . . . . . . . 14Fluorescence Compensation. . . . . . . . . . . . . . . . . . . . . . . . . . . . . . . . . . . . . . . . . . . . . . . . . . . . . . . . . . . . . . . . 16Compensation Controls. . . . . . . . . . . . . . . . . . . . . . . . . . . . . . . . . . . . . . . . . . . . . . . . . . . . . . . . . . . . . . . . . . 18Chapter 3Data AnalysisGates and Regions . . . . . . . . . . . . . . . . . . . . . . . . . . . . . . . . . . . . . . . . . . . . . . . . . . . . . . . . . . . . . . . . . . . . . . . 19Single-Parameter or Univariate Histograms. . . . . . . . . . . . . . . . . . . . . . . . . . . . . . . . . . . . . . . . . . . . . . . . . . . . . 21Two-Parameter or Bivariate Histograms . . . . . . . . . . . . . . . . . . . . . . . . . . . . . . . . . . . . . . . . . . . . . . . . . . . . . . . 22Backgating to Confirm Gating Strategies. . . . . . . . . . . . . . . . . . . . . . . . . . . . . . . . . . . . . . . . . . . . . . . . . . . . . . . 24Chapter 4Controls in Flow cytometryUnstained Controls . . . . . . . . . . . . . . . . . . . . . . . . . . . . . . . . . . . . . . . . . . . . . . . . . . . . . . . . . . . . . . . . . . . . . . . 25Isotype Controls . . . . . . . . . . . . . . . . . . . . . . . . . . . . . . . . . . . . . . . . . . . . . . . . . . . . . . . . . . . . . . . . . . . . . . . . . 26Single Staining and Compensation Controls. . . . . . . . . . . . . . . . . . . . . . . . . . . . . . . . . . . . . . . . . . . . . . . . . . . . 27Fc Blocking Controls. . . . . . . . . . . . . . . . . . . . . . . . . . . . . . . . . . . . . . . . . . . . . . . . . . . . . . . . . . . . . . . . . . . . . . 28Fluorescence Minus One Controls. . . . . . . . . . . . . . . . . . . . . . . . . . . . . . . . . . . . . . . . . . . . . . . . . . . . . . . . . . . . 29Intracellular Staining Controls . . . . . . . . . . . . . . . . . . . . . . . . . . . . . . . . . . . . . . . . . . . . . . . . . . . . . . . . . . . . . . . 30Biological Controls . . . . . . . . . . . . . . . . . . . . . . . . . . . . . . . . . . . . . . . . . . . . . . . . . . . . . . . . . . . . . . . . . . . . . . . 30Chapter 5Optimizing your ExperimentsSample Preparation. . . . . . . . . . . . . . . . . . . . . . . . . . . . . . . . . . . . . . . . . . . . . . . . . . . . . . . . . . . . . . . . . . . . . . . 31Live/Dead Exclusion . . . . . . . . . . . . . . . . . . . . . . . . . . . . . . . . . . . . . . . . . . . . . . . . . . . . . . . . . . . . . . . . . . . . . . 32Autofluorescence. . . . . . . . . . . . . . . . . . . . . . . . . . . . . . . . . . . . . . . . . . . . . . . . . . . . . . . . . . . . . . . . . . . . . . . . . 34Doublet Discrimination. . . . . . . . . . . . . . . . . . . . . . . . . . . . . . . . . . . . . . . . . . . . . . . . . . . . . . . . . . . . . . . . . . . . 34Collect a Statistically Relevant Number of Cells. . . . . . . . . . . . . . . . . . . . . . . . . . . . . . . . . . . . . . . . . . . . . . . . . . 35Permeabilization and Fixation for Intracellular Antigens. . . . . . . . . . . . . . . . . . . . . . . . . . . . . . . . . . . . . . . . . . . . 36Flow Cytometry Basics Guide 1
Chapter 6Multicolor Panel BuildingResolution of Signal. . . . . . . . . . . . . . . . . . . . . . . . . . . . . . . . . . . . . . . . . . . . . . . . . . . . . . . . . . . . . . . . . . . . . . . 37Instrument Configuration. . . . . . . . . . . . . . . . . . . . . . . . . . . . . . . . . . . . . . . . . . . . . . . . . . . . . . . . . . . . . . . . . . . 38Fluorophore Separation. . . . . . . . . . . . . . . . . . . . . . . . . . . . . . . . . . . . . . . . . . . . . . . . . . . . . . . . . . . . . . . . . . . . 38Antigen Density. . . . . . . . . . . . . . . . . . . . . . . . . . . . . . . . . . . . . . . . . . . . . . . . . . . . . . . . . . . . . . . . . . . . . . . . . . 38Fluorophore Properties . . . . . . . . . . . . . . . . . . . . . . . . . . . . . . . . . . . . . . . . . . . . . . . . . . . . . . . . . . . . . . . . . . . . 38Marker Expression Patterns . . . . . . . . . . . . . . . . . . . . . . . . . . . . . . . . . . . . . . . . . . . . . . . . . . . . . . . . . . . . . . . . 39Dump Channels. . . . . . . . . . . . . . . . . . . . . . . . . . . . . . . . . . . . . . . . . . . . . . . . . . . . . . . . . . . . . . . . . . . . . . . . . . 39Antibody Titration . . . . . . . . . . . . . . . . . . . . . . . . . . . . . . . . . . . . . . . . . . . . . . . . . . . . . . . . . . . . . . . . . . . . . . . . 39Panel Building Tools . . . . . . . . . . . . . . . . . . . . . . . . . . . . . . . . . . . . . . . . . . . . . . . . . . . . . . . . . . . . . . . . . . . . . . 40Chapter 7Common Applications and New TechnologyImmunophenotyping. . . . . . . . . . . . . . . . . . . . . . . . . . . . . . . . . . . . . . . . . . . . . . . . . . . . . . . . . . . . . . . . . . . . . . 41Apoptosis . . . . . . . . . . . . . . . . . . . . . . . . . . . . . . . . . . . . . . . . . . . . . . . . . . . . . . . . . . . . . . . . . . . . . . . . . . . . . . 42Proliferation and Cell Cycle . . . . . . . . . . . . . . . . . . . . . . . . . . . . . . . . . . . . . . . . . . . . . . . . . . . . . . . . . . . . . . . . . 43Signaling and Phosphoflow. . . . . . . . . . . . . . . . . . . . . . . . . . . . . . . . . . . . . . . . . . . . . . . . . . . . . . . . . . . . . . . . . 44Small Particle Detection. . . . . . . . . . . . . . . . . . . . . . . . . . . . . . . . . . . . . . . . . . . . . . . . . . . . . . . . . . . . . . . . . . . .Gene Expression and Transfection . . . . . . . . . . . . . . . . . . . . . . . . . . . . . . . . . . . . . . . . . . . . . . . . . . . . . . . . . . .Absolute Quantification. . . . . . . . . . . . . . . . . . . . . . . . . . . . . . . . . . . . . . . . . . . . . . . . . . . . . . . . . . . . . . . . . . . .Particle Internalization . . . . . . . . . . . . . . . . . . . . . . . . . . . . . . . . . . . . . . . . . . . . . . . . . . . . . . . . . . . . . . . . . . . . .Fluorescence in situ Hybridization and RNA Detection . . . . . . . . . . . . . . . . . . . . . . . . . . . . . . . . . . . . . . . . . . . .Innovations in Flow Cytometry. . . . . . . . . . . . . . . . . . . . . . . . . . . . . . . . . . . . . . . . . . . . . . . . . . . . . . . . . . . . . . .444445454545Recommended Reading. . . . . . . . . . . . . . . . . . . . . . . . . . . . . . . . . . . . . . . . . . . . . . . . . . . . . . . . . . . . . . . . . . . 46Chapter 8Common ProtocolsSample Preparation. . . . . . . . . . . . . . . . . . . . . . . . . . . . . . . . . . . . . . . . . . . . . . . . . . . . . . . . . . . . . . . . . . . . . . . 47Preparation of Cells for Flow Cytometry . . . . . . . . . . . . . . . . . . . . . . . . . . . . . . . . . . . . . . . . . . . . . . . . . . . . . . . 48Preparation of Tissue Culture Cells Stored in Liquid Nitrogen. . . . . . . . . . . . . . . . . . . . . . . . . . . . . . . . . . . . . 49Preparation of Tissue Culture Cells in Suspension . . . . . . . . . . . . . . . . . . . . . . . . . . . . . . . . . . . . . . . . . . . . . 49Preparation of Adherent Tissue Culture Cell Lines. . . . . . . . . . . . . . . . . . . . . . . . . . . . . . . . . . . . . . . . . . . . . .Preparation of Human Peripheral Blood Mononuclear Cells . . . . . . . . . . . . . . . . . . . . . . . . . . . . . . . . . . . . . .Preparation of Peritoneal Macrophages, Bone Marrow, Thymus, and Spleen Cells . . . . . . . . . . . . . . . . . . . .Direct Immunofluorescence Staining of Surface Epitopes of Cells and Blood. . . . . . . . . . . . . . . . . . . . . . . . .50515152Indirect Immunofluorescence Staining of Surface Epitopes of Cells and Blood. . . . . . . . . . . . . . . . . . . . . . . 53Direct Staining of Intracellular Antigens and Cytokines: Leucoperm Accessory Reagent Method . . . . . . . . . 54Direct Immunofluorescence Staining of Intracellular Antigens: Methanol plus Leucoperm Method. . . . . . . . . 56Direct Immunofluorescence Staining of Intracellular Cytokines in Blood. . . . . . . . . . . . . . . . . . . . . . . . . . . . . 57Propidium Iodide Staining of Cells for Cell Cycle Analysis. . . . . . . . . . . . . . . . . . . . . . . . . . . . . . . . . . . . . . . . 60BrdU Staining of Cells for Cell Cycle Analysis and Apoptosis . . . . . . . . . . . . . . . . . . . . . . . . . . . . . . . . . . . . . 61Chapter 9TroubleshootingTroubleshooting Guide . . . . . . . . . . . . . . . . . . . . . . . . . . . . . . . . . . . . . . . . . . . . . . . . . . . . . . . . . . . . . . . . . . . . 63Glossary . . . . . . . . . . . . . . . . . . . . . . . . . . . . . . . . . . . . . . . . . . . . . . . . . . . . . . . . . . . . . . . . . . . . . . . . . . . . . . . 652 Flow Cytometry Basics Guide
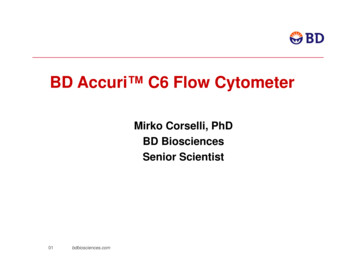
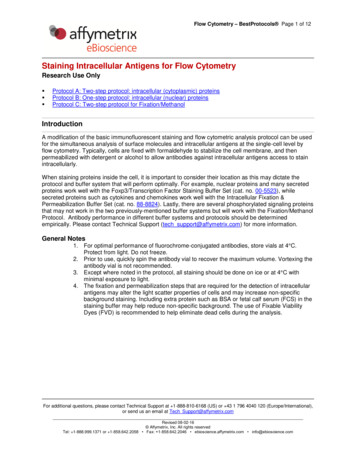
Principles of the Flow Cytometer1Principles of theFlow CytometerFluidics SystemOne of the fundamentals of flow cytometry is the ability to measure the properties ofindividual particles. When a sample enters a flow cytometer, the particles are randomlydistributed in the 3-D space of the sample line, the diameter of which is significantly largerthan the diameter of most cells. The sample must therefore be ordered into a stream ofsingle particles that can be interrogated individually by the instrument’s detection system.This process is managed by the fluidics system.The fluidics system consists of a central core through which the sample fluid is injected,enclosed by an outer sheath fluid. Due to narrowing of the sheath (in a nozzle or cuvette) thefluid velocity is increased. The sample is introduced into the center and is focused by theBernoulli effect (Figure 1). This allows the creation of a stream of particles in single file and iscalled hydrodynamic focusing. Under optimal conditions (laminar flow) there is no mixing ofthe central fluid stream and the sheath fluid.Sheath fluidHydrodynamic focusing regionCells in single fileFig. 1. Hydrodynamic focusing produces a single stream of particles.Without hydrodynamic focusing, the cuvette (typically 250 x 250 µm or 180 x 480 µm) ornozzle of the instrument (typically 70-130 µm) would not create a focused stream of cells andanalysis of single cells would not be possible. With hydrodynamic focusing the cells flow insingle file through the illumination source, called the interrogation point, allowing single cellanalysis.Flow Cytometry Basics Guide 3
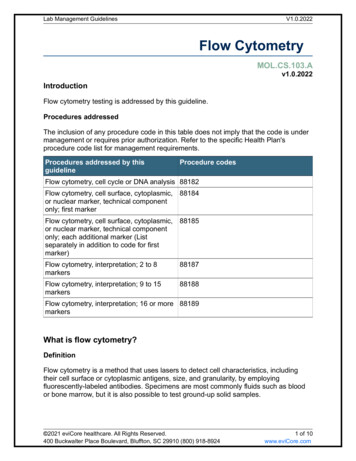
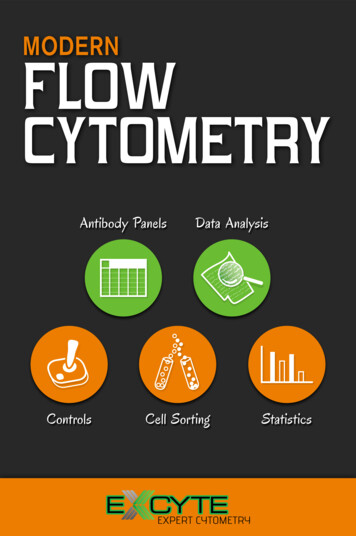
Principles of the Flow CytometerOptics and DetectionAfter hydrodynamic focusing, each particle passes through one or more beams of focusedlight. Light scattering or fluorescence emission (from autofluorescence or if the particle islabeled with a fluorophore) provides information about the particle’s properties. Lasers arethe most commonly used light sources in flow cytometry.Lasers produce a single wavelength of light (a laser line) at a specific frequency. They areavailable at different wavelengths ranging from ultraviolet to far red and have a variablerange of power levels (photon output/time typically specified in mW).Light that is scattered in the forward direction after interacting with a particle, typically upto 20o offset from the laser beam's axis, is collected by a photomultiplier tube (PMT) orphotodiode and is known as the forward scatter (FSC) channel. This angle can howevervary depending on your instrument, leading to variation of FSC signals between differentmachines. This FSC measurement can give an estimation of a particle's size with largerparticles refracting more light than smaller particles, but this can depend on several factorssuch as the sample, the wavelength of the laser, the collection angle and the refractiveindex of the sample and sheath fluid. A good example of this is in the detection of smallparticles. When the particles are smaller than the wavelength of the illumination source, e.g.a 200 nm exosome passing through a 488 nm laser, does not necessarily scatter light in aforward direction.Light measured at a 90o angle to the excitation line is called side scatter (SSC). The SSCcan provide information about the relative complexity (for example, granularity and internalstructures) of a cell or particle; however as with forward scatter this can depend on variousfactors. Both FSC and SSC are unique for every particle and a combination of the two maybe used to roughly differentiate cell types in a heterogeneous population such as blood.However, this depends on the sample type and the quality of sample preparation, sofluorescent labeling is generally required to obtain more detailed information.Fluorescence measurements taken at different wavelengths can provide quantitative andqualitative data about fluorophore-labeled cell surface receptors or intracellular moleculessuch as DNA and cytokines. Most flow cytometers use separate channels and detectorsto detect emitted light, the number of which vary according to the instrument and themanufacturer. Detectors are either photomultiplier tubes or avalanche photodiodes (APD).PMTs are the most commonly used detectors.The specificity of detection is controlled by optical filters, which block certain wavelengthswhilst transmitting (passing) others. There are three major filter types. Long pass filtersallow light through above a cutoff wavelength; short pass filters permit light below acertain wavelength and band pass filters transmit light within a specified narrow rangeof wavelengths (termed a band width). These dichroic filters can block light by phasedreflection allowing certain light to pass through and interfering with other wavelengths(Figure 2).4 Flow Cytometry Basics Guide
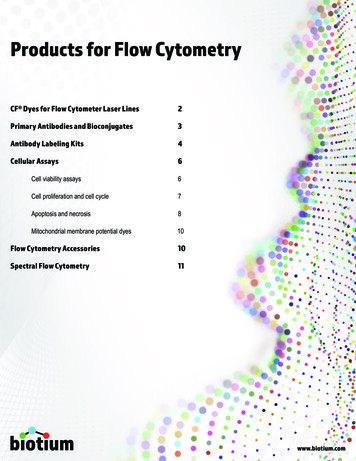
Principles of the Flow Cytometer575 nm Short Pass Filter 575 nm light transmittedLight source520 nm Long Pass Filter 520 nm light transmittedLight source630/20 nm Band Pass Filter620–640 nm light transmittedLight source540 nm Dichroic Short Pass Mirror 540 nm light transmittedLight source 540 nm light reflectedFig. 2. Different types of optical filters.A dichroic filter is also a mirror when placed at an angle to the oncoming light. This typeof filter can now perform two functions. First, it allows specific wavelengths to pass in theforward direction, second it can reflect light at a 90o angle. This allows the light path tobe passed through a series of filters. The precise choice and order of the filters can bearranged so that multiple signals can be detected simultaneously (Figure 3).Flow Cytometry Basics Guide 5
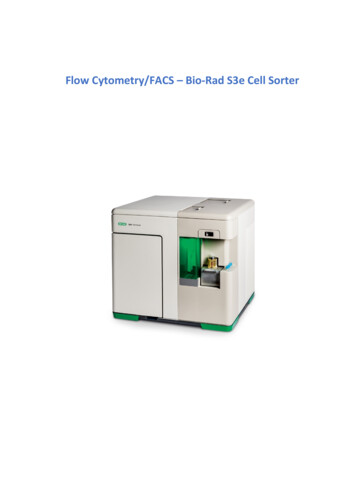
Principles of the Flow CytometerFL detectorPMT 4FL detectorPMT 2FL detectorPMT 3Optical pathFL detectorPMT 1Mirrors and filtersSide scatter(SSC)Pinhole eliminates stray lightSSCdetectorPMTLensFluorescence objective focusesdim fluorescence signals on thepinhole and collimation lensPinholeFSCdetectorPMTObjective lensForward scatter (FSC)Obscuration barFig. 3. Schematic overview of a typical flow cytometer setup. FL, fluorescence; PMT, photomultiplier tube; SSC, side scatter;FSC, forward scatter; blue arrow, light path.Signal and Pulse ProcessingAny time a particle passes through the interrogation point and generates a signal a pulseis generated in every detector. These pulses reflect the passage of the particle through thelaser beam or beams and the signal generated at each point in the cell’s path. These pulsescan be mapped by plotting signal as a function of time.As the particle enters the laser beam spot, it will generate scattered light and fluorescencesignals, which will ultimately manifest in a stream of electrons (current) from the anode ofthe PMT. The magnitude of the current is proportional to the number of photons that hit thephotocathode and thus is also proportional to the intensity of the scatter or fluorescencesignal generated by the particle. As the particle enters the laser beam spot, the output of thePMT will begin to rise, reaching peak output when the particle is located in the center of thelaser beam (Figure 4).At this point, the particle is fully illuminated (the laser beam’s photons are at highest densityin the center of the laser beam focus) and will produce a maximum amount of optical signal.As the particle flows out of the laser beam the current output of the PMT will drop back tobaseline. This generation of a pulse is termed an “event”.6 Flow Cytometry Basics Guide
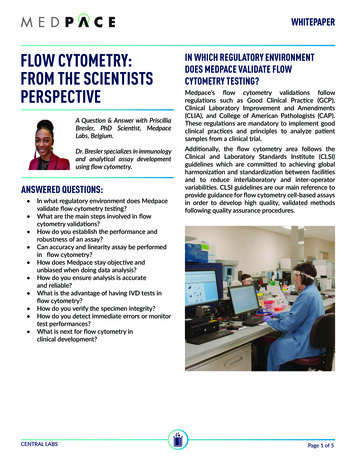
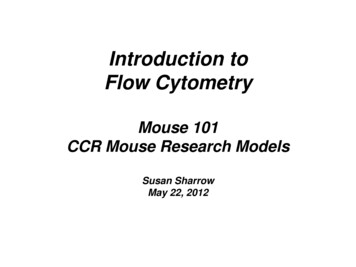
Principles of the Flow CytometerHeight: The maximum amount of currentoutput by the PMT.AreaHeightPhotocurrentArea: The integral of the pulse.WidthWidth: The time interval during whichthe pulse occurs.Signal intensity can be measured by eitherheight or area.The width parameter measures the timethat the cell spends in the laser.TimeFig. 4. Quantifying the pulse by measuring its height, area, and width.However not all signals that are generated correspond to a particle of interest. To avoid theprocessing of unwanted signals a decision is made upon the signal intensity (threshold) of adedicated detector, the trigger channel. This determination is made based upon the triggerparameter and threshold level. PMTs are extremely sensitive and detect signal from a variety ofsources that are irrelevant to experimental data including stray light, dust, very small particlesand debris. The number of these pulses in the system can be orders of magnitude higherthan the number of pulses that are generated by experimental particles. Including these inthe dataset would give high levels of background, substantially mask out relevant data pointsand overload the electronic's ability to process relevant signals. Therefore it is desirable andnecessary to have a threshold below which non-essential data is not detected. This is doneby designating a parameter as the trigger for recording events, usually forward scatter, andsetting a level in that parameter as the threshold. Any pulse that fails to exceed the thresholdlevel is ignored in all detectors (Figure 5A); any pulse that surpasses the threshold level is fullyprocessed by the electronics (Figure meTimeForward scatterForward scatterFig. 5. Determining whether a pulse is ignored (A) or fully processed (B).Flow Cytometry Basics Guide 7
Principles of the Flow CytometerAs the pulses are generated, their quantification is necessary for fluorescence signals tobe displayed on plots, analyzed and interpreted. This is the job of the signal processingelectronics. The majority of flow cytometers are now digital systems. The analog currentfrom the PMT is first digitized or broken down into very small slices by the analog to digitalconverter (ADC). This process is called “sampling”. A sample of a pulse captures the signal atan instant in time and stores it as a digital value. Together these samples represent the entirepulse and optical signal from the particle.The electronics quantify the entire pulse by calculating its height, area and width. The heightand area, or maximum and integral, respectively, are used to measure signal intensitybecause their magnitudes are proportional to the number of photons that interacted with thePMT. The width, on the other hand, is proportional to the time that the particles spent in thelaser and can be used to distinguish between single particles or closely interacting particlesand doublets (this will be discussed later).Although data is collected in a linear scale, data display is usually log scale for fluorescencestudies because it expands weak signals and compresses strong signals, resulting in adistribution that is easy to display on a histogram. Linear display is required when very smalldifferences in fluorescence signal must be assessed, for example in DNA analysis wherethere may only be a two-fold increase in fluorescence.The measurement from each detector is referred to as a parameter. Each parameter can bedisplayed in height, area and width values on the histograms and dot plots in flow cytometrysoftware. These are used to measure fluorescence intensity, compare populations anddesignate sorting decisions.8 Flow Cytometry Basics Guide
Principles of the Flow CytometerElectrostatic Cell SortingA cell sorter provides the ability to separate cells identified by flow cytometry. Droplet basedcell sorters first analyze the particles but also have hardware that can generate dropletsand a means of deflecting or directing wanted particles into a collection tube. Droplets canbe formed by using high-frequency (cycles/second, Hz) vibration of the nozzle at an optimalamplitude (in volts) over a period of time. This is typically created by a piezoelectric crystal.There are two types of electrostatic sorters, which differ where the particles are interrogatedby the laser. Sense-in-air sorters illuminate particles as they exit the nozzle and enter thestream. In cuvette sorters, particles are illuminated in a quartz cuvette before they enterthe stream. After the particles are illuminated at what is called the interrogation point, theycontinue down the stream. Data collected from the particles as they pass through the lasersat the interrogation point is sent to a computer, where the decision is made whether a givenparticle meets the criteria the user has defined for a desired particle. As the particle continuesto travel down the stream, the stream eventually breaks into droplets and the particle ofinterest is captured in a drop. To prevent the break-off point happening at random distancesfrom the nozzle and to maintain consistent droplet sizes, the nozzle is vibrated at highfrequency.One of the most critical parameters of sorting is to measure the time between the point ofinterrogation and the exact point where the droplet breaks off. The time and therefore thedistance is called the drop delay. When the particle gets to the last connected drop, theentire stream is charged at the nozzle. As the particle of interest-containing drop breaksoff, the drop becomes charged. The droplet then passes through an electrical field, and isdeflected into a tube or plate. Uncharged particles pass into the waste (Figure 6).Charging wirein the nozzle1231Optical interrogation andlight collection2Stream partitioninginto droplets3 Stream and droplet chargingas the target particle passesthrough the break-off4Droplet deflection throughan electrostatic field5Uncharged droplets passinto the wasteDeflection plates generatean electrical field4Charged droplets5WasteFig. 6. Electrostatic flow sorting.Flow Cytometry Basics Guide 9
Principles of the Flow CytometerThe speed of cell sorting depends on several factors, including particle size and the rateof droplet formation. A typical nozzle is 70-130 µm in diameter and can produce 10,00090,000 droplets per second. The stability of the break-off dictates the accuracy of thesorting.Common uses of cell sorting include analysis of identified cell populations and singlecells in subsequent downstream applications where DNA, protein or cellular function isinvestigated. Purifying cells based on markers such as CD34 in hematopoietic stem cellsor viability is often used, as is selecting cells, either in populations or single cell cloning, forfurther culture.10 Flow Cytometry Basics Guide
Principles of Fluorescence21Principles of FluorescenceFluorophores and LightFluorophores are fluorescent markers used to detect the expression of cellular moleculessuch as proteins or nucleic acids. They functionally accept light energy (for example, froma laser) at a given wavelength and re-emit it at a longer wavelength. These two processesare called excitation and emission. Emission follows excitation extremely rapidly, commonlyin nanoseconds and is known as fluorescence. Before considering the different types offluorophores available for flow cytometry, it is necessary to understand the principles of lightabsorbance and emission.Light is a form of electromagnetic energy that travels in waves. These waves have both afrequency and length, the latter of which determines the color of the light. The light thatcan be visualized by the human eye represents a narrow wavelength band (380-700 nm)between ultraviolet (UV) and infrared (IR) radiation (Figure 7). Sunlight, for example,contains UV and IR light that, although invisible to the eye can be felt as warmth on theskin and measured scientifically using photodetectors. The visible spectrum can be furthersubdivided according to color, red, orange, yellow, green, blue and violet. Red light hasa longer wavelength and lower energy, whereas violet light has a shorter wavelength andhigher energy.Higher energyLower energyUltravioletInfrared400 nm500 nm600 nm700 nmVisible spectrumFig. 7. The electromagnetic spectrum.Flow Cytometry Basics Guide 11
Principles of FluorescenceFluorescenceWhen a fluorophore absorbs light, its electrons become
8 Flow Cytometry Basics Guide Principles of the Flow Cytometer As the pulses are generated, their quantification is necessary for fluorescence signals to be displayed on plots, analyzed and interpreted . This is the job of the signal processing electronics . The majority of flow cytometers are now digital systems . The analog current