Transcription
Statistical Models of Horse Racing OutcomesUsing RDr Alun Owen, Coventry University, UKaa5845@coventry.ac.ukMathSport International 2019
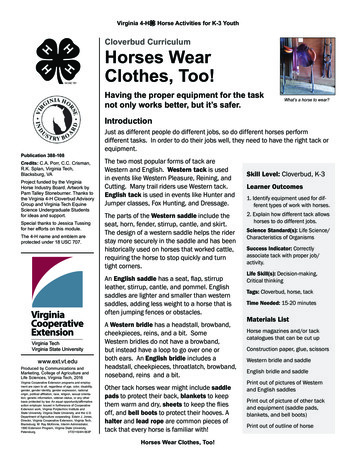
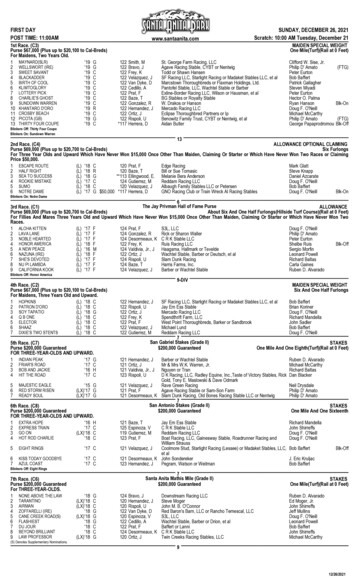
Royal Ascot 20th June 2019The Britannia Stakes (1 mile 8 furlongs)https://www.youtube.com/watch?v sZsF3Q3IJEEFrankie Dettori riding TurgenevFrankie Dettori had won 4/4 races so farHe was the strong favourite @ 7/2 to win this 5th race of the dayHarry Bentley riding Biometric @ 28/1MathSport International 2019
Data: Flat Turf Handicaps in the UK16,685 horses taking part in 1,693 ition1position2position3finposentiregelding- unique reference number for each race;- reference number (or name) for each horse in each race (must be unique within a race);- age of the horse (years);- win percentage by offspring of the horse’s sire (father) prior to this race;- win percentage achieved by the horse’s trainer prior to this race;- days since last race (days since Last Time Out);- finishing position in the previous race (1, 2, 3 or 4, 0 anywhere else);- finishing position two races ago (1, 2, 3 or 4, 0 anywhere else);- finishing position three races ago (1, 2, 3 or 4, 0 anywhere else);- finishing position in the current race;- male horse that has not been castrated (1 yes, 0 no) ;- male horse that has been castrated (1 yes, 0 no) ;note that a horse that is neither a gelding nor an entire was female;blinkers, visor, cheekpieces or tonguetie (each 1 yes if they were wearing these, 0 no).win- indicator of whether each horse won (yes) or not (no);sp- starting price obtained from Betfair (adjusted for commission);
race.id horse.ref agesireSR trainerSR daysLTO position1 position2 position3 finpos winspentire gelding blinkers visor cheekpieces 77.110142004no5010000MathSport International 2019
Data Management Sire SR and Trainer SR both capped at 20% daysLTO capped at 60 days SP adjusted for Betfair Commission assumed to be 5% Training set 70% of races (11,710 horses taking part in1,181 ) todevelop a model and possible betting strategy; Test set 30% of races 4,975 horses from 512 races for out-of-sampleassessments.MathSport International 2019
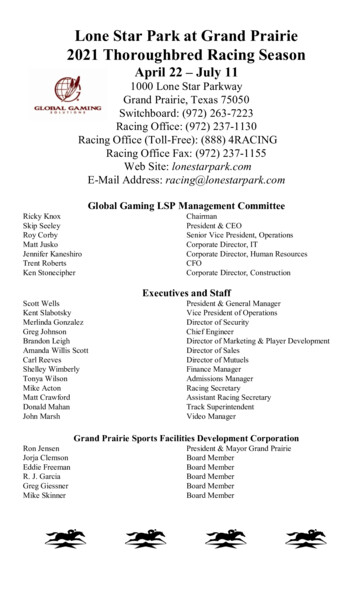
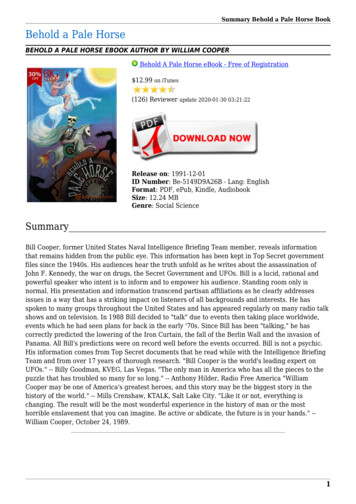
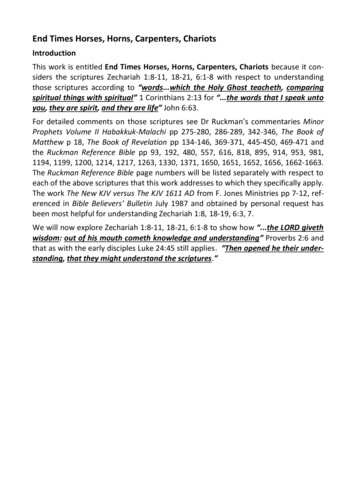
Win Proportion versus Age (Training Set)Hence define new variable: age.diff abs(age-4.5)Supports evidence in Gramm and Marksteiner (2011)
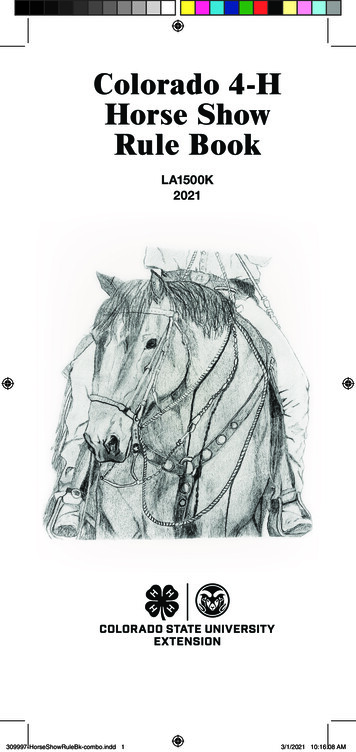
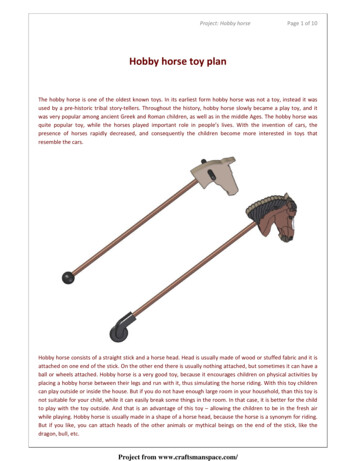
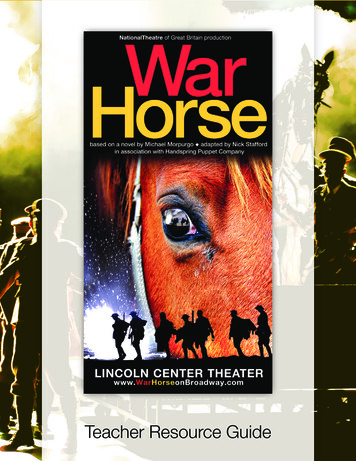
Win Proportion versusSireSR, TrainerSR,daysLTO (Training Set)
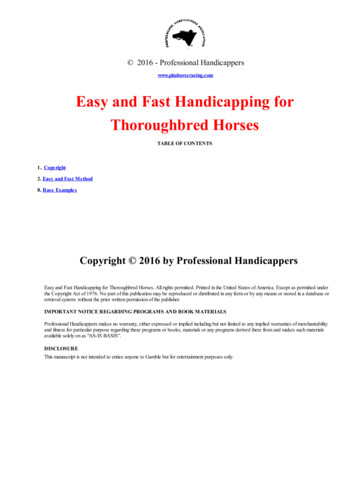
(Training Set) Win Proportion v Position in the horse's:previous race ( )two races ago (- - - - -)three races ago ( )
(Training Set) Win Proportion versusblinkers, visor, cheekpieces or 10.1000.1010.1030.102
Multinomial logistic regression model(Discrete choice models)Consider “estimated” relative ratings or utilities, 𝑉𝑖 , for horses i 1, ,n in a raceAnd “true” (unknown) ratings/utilities 𝑈𝑖 , then:𝑈𝑖 𝑉𝑖 𝜀𝑖 ,𝜀𝑖 is the (random) difference between the estimated and true ratings/utilitiesProbability that horse i will win the race is:𝑃𝑖 Prob 𝑈𝑖 𝑈𝑗 𝑗 𝑖 Prob 𝑉𝑖 𝜀𝑖 𝑉𝑗 𝜀𝑗 , 𝑗 𝑖 . Prob 𝜀𝑗 𝜀𝑖 𝑉𝑖 𝑉𝑗 , 𝑗 𝑖 .This is the cumulative distribution of 𝜀𝑗 over all 𝑗 𝑖.The logistic model derived by assuming that 𝜀𝑖 follows an extreme value distribution (Gumbeldistribution):F 𝜀𝑗 exp exp 𝜀𝑗
Multinomial logistic regression model(Discrete choice model)By making the assumption above, it can then be shown that the probability 𝑃𝑖 that horse iwill win a race involving n horses is given by:exp(𝑉𝑖 )𝑃𝑖 𝑛.σ𝑖 1 exp(𝑉𝑖 )We relate the rating/utility, 𝑉𝑖 , for horse i to horse-specific variables (age, sireSR etc.) using𝑉𝑖 𝛽1 𝑥𝑖1 𝛽2 𝑥𝑖2 𝛽𝑝 𝑥𝑖𝑝 ,where 𝑥𝑖1 , 𝑥𝑖2 , , 𝑥𝑖𝑝 are the p horse-specific variables (age, sireSR etc.) for horse iand β1, β2, , βp are model parameters to be estimated.
Specification in R Using mlogit packagemlogit(win age.diff sireSR trainerSR daysLTO position1 position2 position3 entire gelding blinkers visor cheekpieces tonguetie 0 0,data h.dat)Alternative-specific variables are the horse-specific variables.Individual-specific variables are the race-specific variables.Often this is the source of confusion that prevents manyimplementing the multinomial logistic model for horse racing.
Specification in Rh.dat - mlogit.data(data model.data,choice "win",chid.var "race.id",alt.var "horse.ref",shape "long")choiceindicator of which horse won each race(in our data set this is the variable called win);chid.var defines the choice sets (races) from which winner is chosen(in our data set this is race.id);alt.var defines the choice alternatives (horses) in each set (race)(in our data set this is horse.ref)
ParameterEstimateStd. Errorpage.diff-0.1530.0314 0.001sireSR0.0480.0093 0.001trainerSR0.0510.0093 30.1170.103640.1300.1013entire0.4990.1297 0.001gelding0.5570.0948 69Position1Position2Position3 0.001 0.0010.43
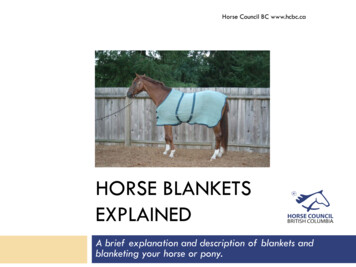
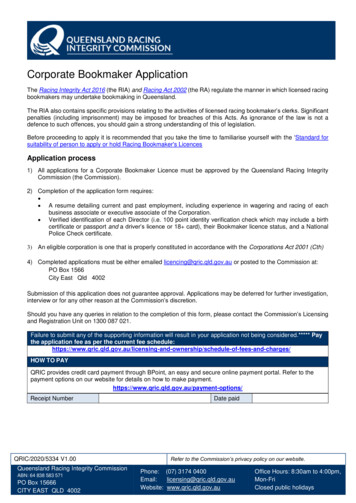
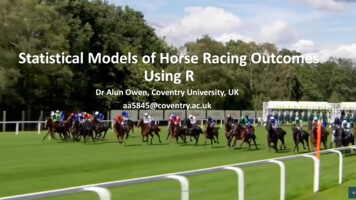
Calibration for the model (o) and market implied win probabilities ( )Here we adjust market probabilities to account for Betfair Commission
𝑃1 and 𝑃 2 v Model (𝑁1𝑃1 ex p lo g 𝑃𝑗𝑘𝑁𝑘 1) and Market (------) Win Probabilities𝑁1𝑃2 ex p log 1 𝑃𝑗𝑘𝑁𝑘 12𝑛𝑘 lo g 𝑃𝑖𝑘𝑖 𝑗2
Betting on unseen data (Test Set)Unit bets placed "virtually" on horses where:1. model win probability was greater than 0.152. ratio of win probability of model/market (adjusted for commission) 1.3
MathSport International 2019
Efficiency of Race Track BettingMarkets, eds. Haush, Lo and Ziemba.MathSport International 2019Discrete Choice Methods andSimulation, Kenneth Train.
Independence from irrelevant alternatives (IIA)exp(𝑉𝑖 )𝑃𝑖 σ𝑛𝑖 1 exp(𝑉𝑖 )exp(𝑉𝑖 ) ൚ exp(𝑉 ) 𝑗𝑃𝑗exp(𝑉𝑗 )𝑛σ𝑖 1 exp(𝑉𝑖 )Depends only on horses i and jSuppose have three horses A, B and C with model win probabilities 0.4, 0.4, 0.2 and hencemodel implied (decimal) odds 2.5, 2.5, 5.0If horse A becomes a non-runner the probabilities will change to 0.4/0.6 0.67 for B and0.2/0.6 0.33 for C and hence odds of 1.5 and 3.0.Need to be happy this is sensible?MathSport International 2019
EucaristωƴMathSport International 2019
Data Management Sire SR and Trainer SR both capped at 20% daysLTO capped at 60 days SP adjusted for Betfair Commission assumed to be 5% Training set 70% of races (11,710 horses taking part in1,181 ) to develop a model and possible betting strategy; Test set 30% of races 4,975 horses from 512 races for out-of-sample assessments.