Transcription
Network for Greening the Financial SystemNGFS Climate Scenariosfor central banks and supervisorsJune 2021
Joint forewordIt is our very great pleasure to present the second iteration of the NGFS’ climate scenarios. They represent a true milestonein the race to better understand the risks from climate change.The world is at a critical juncture where climate pathways could move in materially different directions: from a successfultransition to net-zero emissions by 2050; to a hot house world with global warming of 3 C or more by 2100. In the faceof such uncertainty, climate scenario analysis is a vital tool that helps us to prepare for a range of future pathways. And itdoes this by focussing minds on a variety of different outcomes, challenging users to consider what risks and opportunitiesmight arise – and crucially, what action might be required today in light of these potential challenges tomorrow.Frank EldersonChair of the NGFSSarah BreedenChair of the workstreamon “Macrofinancial”A major obstacle to undertaking this analysis has been the availability of detailed scenarios that analyse both the physicaland transition risks from climate change and their economic impacts. The challenges and costs of creating such scenariosare beyond most individual firms or institutions, so it is against this background that the NGFS has developed a commonset of scenarios. These scenarios are designed to act as a foundation for analysis across many institutions, creating muchneeded consistency and comparability of results. Indeed, a growing number of central banks, supervisors and privatefirms are already using NGFS scenarios as a basis to better understand risks to financial systems, economies and their ownbusinesses and balance sheets.We are proud of how far these scenarios have come in a very short time. It was just one year ago that the NGFS released its first iteration of NGFS scenarios, a milestone in itself. Thefirst iteration provided a foundation for climate scenario exercises by offering a consistent set of pathways for global changes in policy, the energy system, and the climate. Whilst anambitious first step, these scenarios represented a foundation for future work.This second iteration of the scenarios takes a huge step forward. Not only does it include a mapping to impacts at a country level, but it includes nearly 1,000 economic, financial,transition and physical variables across six different scenarios. These have been created through a suite of models, supported by a consortium of world leading climate scientistsand modelling groups. The variables are calibrated to the latest available data and will be kept up to date in future iterations to ensure their continued relevance. And all variablesare made available for free on the NGFS website so that anyone can take advantage of the wealth of information they provide.Huge strides have been made, but the opportunity to deepen scenarios further remains large. For this reason, the NGFS will continue to invest in developing these scenarios, andto welcome views from others on where development can be most valuably focussed. In doing this, we remain cognisant that the modelling of future pathways that encompasschanges in policy and climate are subject to significant uncertainties and valuable debate. To help navigate this uncertainty the NGFS scenarios: provide six scenarios with variableassumptions on future changes in policy and technology; utilise multiple models to provide a range of results and hedge against model bias; and are transparent on the underlyingmodels and methodologies used.We are grateful to all of those that have contributed to these scenarios and look forward to seeing them applied in practice. After all, as we improve our understanding of how thefuture can play out, we will be better equipped to take the actions that are needed today to reduce the risks of tomorrow.NGFS SCENARIOS2
AcknowledgementsThe Network for Greening the Financial System (NGFS) is a group of 91 centralbanks and supervisors and 14 observers committed to sharing best practices,contributing to the development of climate –and environment– related riskmanagement in the financial sector and mobilising mainstream finance to supportthe transition toward a sustainable economy.The NGFS Workstream on “Macrofinancial” has been working on updating theJune 2020 NGFS Scenarios in partnership with an academic consortium from thePotsdam Institute for Climate Impact Research (PIK), International Institute forApplied Systems Analysis (IIASA), University of Maryland (UMD), Climate Analytics(CA), the Swiss Federal Institute of Technology in Zurich (ETHZ) and the NationalInstitute of Economic and Social Research (NIESR). This work was made possibleby grants from Bloomberg Philanthropies and ClimateWorks Foundation.Special thanks is given to lead coordinating authors: Ryan Barrett (Bank of England),Antoine Boirard (NGFS Secretariat/Banque de France), Theresa Löber (Bankof England), Clément Payerols (NGFS Secretariat/Banque de France) and Edo Schets(Bank of England).Thanks is also given to contributing authors: Thomas Allen (Banque de France),Cathy Ansell (World Bank), Thessa Beck (CA), Christoph Bertram (PIK), Gilbert Cette(Banque de France), Stéphane Dees (Banque de France), Jae Edmonds (JGCRI/UMD),Jérôme Hilaire (PIK), Dawn Holland (NIESR), Ian Hurst (NIESR), Elmar Kriegler(PIK), Iana Liadze (NIESR), Olivier Mahul (World Bank), Miguel Molico (Bankof Canada), Laura Parisi (European Central Bank), Franziska Piontek (PIK),Carl Friedrich Schleussner (CA) and Bas van Ruijven (IIASA).NGFS SCENARIOS3
OverviewContents5TransitionOverview of the scenariosScenarios in detail:13Physical risks25Economic impacts34Development pipelinePhysicalTransition risks42EconomicDevelopment4Annex / ReferencesNGFS SCENARIOS
OverviewOverview of the scenarios
OverviewKey messagesScenarios differ markedly in their physical and transition impacts, with significant uncertaintyin the size of the estimates and variation across regions. The NGFS Scenarios have been developed to provide a common starting point for analysing climate risks to the economy and financial system. While developedprimarily for use by central banks and supervisors they may also be useful to the broader private sector, government and academia. In this second iteration, the NGFS scenarios have been brought up to date, including by incorporating countries’ commitments to reach net‑zero emissions, andhave been enriched with an expanded set of macroeconomic variables, country‑level granularity, and an online portal through which users can explore the physicalrisks from climate change. Reaching net zero CO2 emissions by 2050 on a global basis will require an ambitious transition across all sectors of the economy. The NGFS scenarios highlight a fewimportant themes including rapid decarbonisation of electricity, increasing electrification, more efficient uses of resources, and a spectrum of new technologiesto tackle remaining hard‑to‑abate emissions. The impacts on the economy will be modest, and even positive depending on how smoothly the transition occurs. While stronger policy incentives will be neededto spur on the transition, new economic modelling in this release suggests that higher private and public investment in new technologies and sectors would offsetimpacts on both demand and supply. However, it is prudent to assess a wide range of outcomes across different sectors and regions given the potential uncertainties. The NGFS scenarios also highlightthe increased macro‑financial risks that could crystallize in scenarios with divergent policies or delay followed by stronger action, and from physical risks.NGFS SCENARIOS6
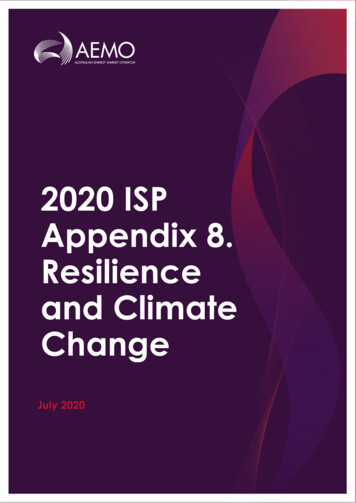
OverviewObjectives and frameworkThe NGFS scenarios explore the impacts of climate change and climate policy with the aimof providing a common reference framework.NGFS scenarios FrameworkHigh The NGFS scenarios explore a set of six scenarios which are consistent with the NGFS framework (see figure)published in the First NGFS Comprehensive Report covering the following dimensions:– Orderly scenarios assume climate policies are introduced early and become gradually more stringent.Both physical and transition risks are relatively subdued. These six scenarios were chosen to show a range of lower and higher risk outcomes. The scenarios havebeen further refined since the first iteration that was published in June 2020 to leverage the latest versionsof models, reflect the shifts in climate policy since 2018, and reflect the near‑term IMF growth projectionfrom COVID‑19.Transition risks– Hot house world scenarios assume that some climate policies are implemented in some jurisdictions, butglobally efforts are insufficient to halt significant global warming. The scenarios result in severe physicalrisk including irreversible impacts like sea‑level rise.DivergentNet Zero(1.5 C)Low– Disorderly scenarios explore higher transition risk due to policies being delayed or divergent acrosscountries and sectors. For example, carbon prices would have to increase abruptly after a period of delay.DisorderlyNet Zero2050(1.5 C)Too little, too lateDelayedtransitionBelow2 CNDCsOrderlyLowCurrentpoliciesHot house worldPhysical risksHighPositioning of scenarios is approximate, based on an assessment ofphysical and transition risks out to 2100.NGFS SCENARIOS7
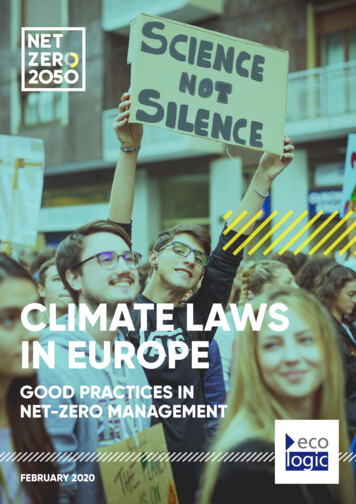
OverviewScenario narrativesHot house worldDisorderlyOrderlyEach NGFS scenario explores a different set of assumptions for how climate policy, emissions,and temperatures evolve.Net Zero 2050 limits global warming to 1.5 C throughstringent climate policies and innovation, reachingglobal net zero CO2 emissions around 2050. Somejurisdictions such as the US, EU and Japan reach netzero for all GHGs.Below 2 C gradually increases the stringency ofclimate policies, giving a 67% chance of limiting globalwarming to below 2 C.Divergent Net Zero reaches net zero around 2050 butwith higher costs due to divergent policies introducedacross sectors leading to a quicker phase out of oil use.Delayed transition assumes annual emissions donot decrease until 2030. Strong policies are neededto limit warming to below 2 C. CO2 removal is limited.Nationally Determined Contributions (NDCs) includesall pledged policies even if not yet implemented.Current Policies assumes that only currentlyimplemented policies are preserved, leading to highphysical risks.CO2 emissions by scenario50Carbon price developmentGt CO2 / year8003 C401.5 C7001.5 C1.8 C600500302.5 C20400300100USD (2010) t/CO21.7 C20202030Delayed transitionCurrent policiesNet Zero 2050 (1.5 C)20401.8 C1.5 C1.5 C2050Divergent NZNDCsBelow 2 CSource: IIASA NGFS Climate Scenarios Database, REMIND model.End of century warming outcomes shown.2001.7 C100020202030Delayed transitionCurrent policiesNet Zero 2050 (1.5 C)20402.5 C3 C2050Divergent NZNDCsBelow 2 CSource: IIASA NGFS Climate Scenarios Database, REMIND model.Carbon prices are weighted global averages. End of century warmingoutcomes shown.NGFS SCENARIOS8
OverviewScenarios at a glanceScenarios are characterised by their overall level of physical and transition risk. This is drivenby the level of policy ambition, policy timing, coordination and technology levers.Physical riskCategoryScenarioOrderlyDisorderlyHot House WorldTransition riskPolicy ambitionPolicy reactionTechnologychangeCarbon dioxideremovalRegional policyvariation Net Zero 20501.5 CImmediate andsmoothFast changeMedium useMedium variationBelow 2 C1.7 CImmediate andsmoothModerate changeMedium useLow variationDivergent Net Zero1.5 CImmediate butdivergentFast changeLow useMedium variationDelayed transition1.8 CDelayedSlow/Fast changeLow useHigh variationNationallyDeterminedContributions(NDCs) 2.5 CNDCsSlow changeLow useLow variation3 C None – currentpoliciesSlow changeLow useLow variationCurrent PoliciesColour coding indicateswhether the characteristicmakes the scenario moreor less severe from amacro‑financial riskperspective Lower riskModerate riskHigher risk* See slide 18 for more details. Risks will be higher in the countries and regions that have stronger policy. For example in Net Zero 2050 the EU, USA and Japan reach net zero GHGs by 2050, but globally only netzero CO2 is reached by this point. This assessment is based on expert judgment based on how changing this assumption affects key drivers of physical and transition risk. For example, higher temperatures arecorrelated with higher impacts on physical assets and the economy. On the transition side economic and financial impacts increase with: a) strong, sudden and/or divergent policy,b) fast technological change even if carbon price changes are modest, c) limited availability of carbon dioxide removal meaning the transition must be more abrupt in other partsof the economy, d) stronger policy in those particular countries and/or regions.NGFS SCENARIOS9
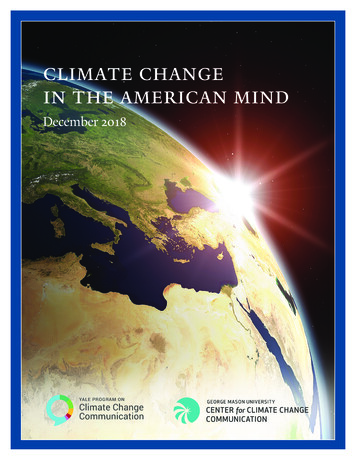
OverviewTransmission channelsClimate risks could affect the economy and financial system through a range of differenttransmission channels. Physical risks affect the economy in two ways.– Acute impacts from extreme weather eventscan lead to business disruption and damagesto property. There is some evidence that withincreased warming they could also lead topersistent longer term impacts on the economy.These events can increase underwriting risksfor insurers, possibly leading to lower insurancecoverage in some regions, and impair asset values.– Chronic impacts, particularly from increasedtemperatures, sea levels rise and precipitation,may affect labour, capital, land and natural capitalin specific areas. These changes will require asignificant level of investment and adaptationfrom companies, households and governments.Transmission channelsClimate risks to financial risksClimate risksEconomic transmission channelsTransition risks Policy and regulation Technologydevelopment Consumer preferencesMicroAffecting individual businesses and householdsPhysical risks Chronic ivity, sealevels) Acute (e.g. heatwaves,floods, cyclones andwildfires)Businesses Property damage and businessdisruption from severe weather Stranded assets and new capitalexpenditure due to transition Changing demand and costs Legal liability (from failure tomitigate or adapt)Households Loss of income (from weatherdisruption and health impacts,labour market frictions) Property damage (from severeweather) or restrictions (fromlow-carbon policies) increasingcosts and affecting valuationsMacroAggregate impacts on the macroeconomy Capital depreciation and increased investment Shifts in prices (from structural changes, supply shocks) Productivity changes (from severe heat, diversion of investment tomitigation and adaptation, higher risk aversion) Labour market frictions (from physical and transition risks) Socioeconomic changes (from changing consumption patterns,migration, conflict) Other impacts on international trade, government revenues, fiscalspace, output, interest rates and exchange rates.Climate and economy feedback effectsFinancial risksCredit risk Defaults by businessesand households Collateral depreciationMarket risk Repricing of equities,fixed income,commodities etc.Financial system contagion Transition risks will affect the profitability ofbusinesses and wealth of households, creatingfinancial risks for lenders and investors. They will alsoaffect the broader economy through investment,productivity and relative price channels, particularlyif the transition leads to stranded assets.Underwriting risk Increased insured losses Increased insurance gapOperational risk Supply chain disruption Forced facility closureLiquidity risk Increased demand forliquidity Refinancing riskEconomy and financial system feedback effectsNGFS SCENARIOS10
OverviewAvailable data and resourcesThe NGFS scenarios provide a range of data on transition risk, physical risk and economicimpacts. This is produced by a suite of models aligned in a coherent way. Transition and economic variables are madeavailable in the NGFS Scenarios Database hostedby IIASA. The transition pathways were producedby three teams: PIK (REMIND‑MAgPIE model), IIASA(MESSAGEix‑GLOBIOM model) and UMD (GCAMmodel). Economic variables were produced by theNational Institute for Economic and Social Research(NIESR) (NiGEM model).NGFS suite of models approachTransition riskPhysical riskTemperaturealignment*Transition pathwaysIntegrated AssessmentModels1.5 C, 2 C, 3 C Selected climate variables can be explored throughthe NGFS CA Climate Impact Explorer hosted byClimate Analytics. Additional data are availablevia the ISIMIP project. Physical risk analysis wassupported by Climate Analytics, ETH Zurich and PIK.Carbon pricesand energy useChronic climateimpactsEarth System ModelsClimate Impact ModelsAcute climate impactsNatural CatastropheModelsCountry productivitydamagesNot yetintegratedMacro-financial impactsMacroeconomic Model Key data and resources can be explored interactivelyon the NGFS Climate Scenarios website.Data available in the IIASA portalData available in the NGFS CA Climate Impact ExplorerNGFS SCENARIOS11
OverviewUncertainty in climate scenariosClimate risks could affect the economy and financial system through a range of differenttransmission channels.A key guiding principle of the project has been embracing the uncertainty inherentin scenario modelling. This is captured in the following ways: Transition risk: the NGFS provides six different scenarios so that users canexplore how a range of different climate policy pathways change the results. Foreach scenario, three different models were used to provide estimates of modeluncertainty. The uncertainty range for energy and industrial CO2 emissions inthree of the six scenarios is shown in the right chart. Estimates of the amountof emissions implied by current policies differ considerably in the medium term(grey lines). There are also different estimates for when net zero CO2 emissionsmust be reached in order to limit warming to 1.5 C: 2050 for REMIND and GCAMand 2060 for MESSAGEix (blue lines). There are other uncertainties that are notcaptured due to modelling simplifications such as behavioural change, policyheterogeneity and market allocation of capital. Physical risk: A visualisation tool, the NGFS CA Climate Impact Explorer, wasdeveloped for this release to allow users to explore the range of possibleoutcomes for different climate change indicators at the country level. It shows,for example, the different level of precipitation or heatwave risk for a given risein mean average temperatures (’warming level’). Economic impacts: The sensitivity of the economic modelling was tested toseveral assumptions, such as the choice of government policy (slide 39).Differences in energy and industrial CO2 emissions50Gt CO2 / yearUncertainty infuture emissionsimplied bycurrent policies40*30Uncertainty in timing of netzero to reach a giventemperature target20100-1020202030Delayed transitionGCAM2040Current policiesMESSAGEix20502060Net Zero 2050 (1.5 C)REMINDSource: IIASA NGFS Climate Scenarios Database.* Emissions estimates for 2020 were based on pre‑pandemic trends as this data had not been finalised at thetime of the models runs. The pandemic was estimated to reduce emissions by approximately 7%. There isin any case usually a /‑ 5% level of uncertainty in estimation.NGFS SCENARIOS12
TransitionTransition risksScenarios in detail
Understanding transition risk Transitioning away from fossil fuels andcarbon‑intensive production and consumptionrequires significant shift towards emissions‑neutralalternatives in all sectors (left chart). Policy‑makerscan induce this transition by increasing the implicitcost of emissions. As it takes time to develop anddeploy alternative technologies, climate policiesmay lead to higher costs in the interim. The NGFS transition pathways have been modelledusing three detailed integrated assessmentmodels (IAMs)*. They can be used to assess thechanges in energy, land‑use and policy neededto meet a particular temperature outcome orcarbon budget (right figure). This is not necessarilythe socially optimal price which depends on anassessment of avoided damages and valuing impactson present vs. future generations.* These models have been used extensively to inform policy and decisionmakers and feature in several climate assessment reports, cf. IPCC, 2014.IPCC, 2018. UNEP, 2018.Sector GHG emissionsModelling climate policy and climate changeNet Zero 205015Climate impacts can befed back in to baselineGt CO2 eq / yearClimateImpactsClimate modelscan be alignedto assessphysical impacts10ClimateChange5IAMs estimatetemperature outcomegiven range of climatesensitivities0SocioeconomicDevelopmentIAMs start with ahypotheticalbaseline basedon the SSPsEnergy &Land UseAssess changesin energy, land-useand policy neededto meet carbon budgetEmissionsSource: SENSES scenario Electricity2050SteelTransportationSource: IIASA NGFS Climate Scenarios Database, GCAM model.AFOLU is agriculture, forestry and other land use.NGFS SCENARIOS14TransitionEliminating most greenhouse gas emissions will affect all sectors of the economy, and givesrise to transition risks for the economy and financial system.
Emissions prices In the IAMs used to produce the NGFS scenarios, ahigher emissions price implies more stringent policy.Models suggest that a carbon price of around 160/tonne would be needed by the end of the decadeto incentivise a transition towards net zero by 2050(right chart). This price is a measure of overall policyintensity. In reality, governments are pursuing arange of fiscal and regulatory policies, which havevarying costs and benefits. Shadow emissions prices are sensitive to:– T he level of ambition to mitigate climatechange. Higher ambition translates into higheremissions prices.– The timing of policy implementation. Higheremissions prices are needed in the medium tolong‑term if action is delayed.– The distribution of policy measures across sectorsand regions.– Technology assumptions such as the availabilityand viability of carbon dioxide removal.Carbon prices across modelsCarbon price development800Net Zero 2050USD (2010) t/CO27001.5 C8001.5 C7001.8 C6006005005004004003003002001.7 C100020202030Delayed transitionCurrent policiesNet Zero 2050 (1.5 C)20402.5 C3 C2050Divergent NZNDCsBelow 2 CSource: IIASA NGFS Climate Scenarios Database, REMIND model.Carbon prices are weighted global averages.USD (2010) / t CO21.5 C rangec. average 160/tby INDSource: IIASA NGFS Climate Scenarios Database.* Emissions prices are defined as the marginal abatement cost of an incremental tonne of greenhouse gas emissions. Prices are influenced by the stringency of policy as well as how technology costs will evolve. Prices tend tobe lower in emerging economies which reduces efficiency but reflects equity considerations.NGFS SCENARIOS15TransitionA key indicator of the level of transition risk is the shadow emissions price, a proxy for governmentpolicy intensity and changes in technology and consumer preferences.
Commodity markets The future pathways of commodity prices are highlyuncertain. IAMs include a baseline assumption thatprices increase in line with increasing marginalextraction costs (right chart). In mitigation scenariossome downward pressure comes from decliningfossil fuel use (left chart). However, this does notcapture the full range of outcomes. Pathways donot account for the possibility of ’sell‑off’ behaviourfrom producers, or other volatility between 5‑yeartime steps. Users may wish to make further assumptions whenusing commodity prices for macro‑financial analysis.A change in oil prices is likely to affect producers andconsumers differently, and a carbon price can drivea wedge between producer and consumer prices.The extent to which prices change also depends onhow quickly alternative energy sources are deployed.Oil prices by scenarioOil volumes by scenarioIndex (2020 100)Index (2020 100)2002001501501001005050020202030Current policies GCAMCurrent policies MESSAGEixCurrent policies REMIND20402050Divergent NZ GCAMDivergent NZ MESSAGEixDivergent NZ REMINDSource: IIASA NGFS Climate Scenarios Database.020202030Current policies GCAMCurrent policies MESSAGEixCurrent policies REMIND20402050Divergent NZ GCAMDivergent NZ MESSAGEixDivergent NZ REMINDSource: IIASA NGFS Climate Scenarios Database.NGFS SCENARIOS16TransitionA key driver of transition risk is the future pathway of fossil fuel prices and volumes, with potentialspill-over effects to the broader economy.
Energy investment Transitioning to a net zero economy would requireinvestment flows to be geared towards massdeployment of green electricity and electricitystorage (left chart). There is some legacy capitalinvestment in fossil fuel extraction, which is a holisticmeasure of all investments in mining, shipping andports for fossil fuels, transmission and distributionfor gas as well as the transport and refining for oil. By 2050, renewables and biomass would deliver 68%of global primary energy needs (right chart). This isa marked contrast to the current policies scenariowhere fossil fuels continue to be the dominantsource of primary energy, even after accountingfor current technology trends.Primary energy mix by scenarioCumulative energy investment to 2050Net Zero 2050 *Per centTrillion en electricityextractionand storageCurrent policiesNuclearNet Zero 2050 (1.5 C)Source: IIASA NGFS Climate Scenarios Database, REMIND model.202020302050Current policiesCoalGasNuclearOil202020302050Net Zero 2050 (1.5 C)Renewablesincluding BiomassSource: IIASA NGFS Climate Scenarios Database, REMIND model.Direct equivalent accounting method used, which is predominant inpublications on long‑term transition pathways.* Fossil power generation investments include investments into generation with CCS, which dominate in the Net Zero 2050 scenario. Investments into fossil fuel extraction are estimated based on constant investment intensityassumption of fuel use, and so likely overestimate the required investments where declining demand can be met with existing projects requiring less investments than new ones.NGFS SCENARIOS17TransitionSignificant investment flows would need to be directed towards green energy in the comingdecades to achieve net zero.
Carbon dioxide removal Carbon Dioxide Removal (CDR) involves removingcarbon from the atmosphere through increasingforest cover and soil sequestration (land use) orgrowing crops for bioenergy (bioenergy with carboncapture and storage, BECCS). CDR assumptions play an important role in IAMs.If deployed effectively lower warming outcomescould be achieved, or targets could be reachedsooner given the practical difficulty of eliminatingall emissions in the near term. However, they onlycurrently take place on a limited scale and face theirown challenges. The NGFS scenarios assume low to mediumavailability of these technologies. Howeverpatterns vary strongly across models (right chart)depending on cost assumptions. They also varysubstantially across countries depending on thecosts and availability of CDR options.CO2 removals across modelCO2 removals in Net Zero 205040Net Zero 2050Gt CO2 / yearGt CO2CDR BECCS0-230-4Solid lines(REMIND)corresponds toCO2 removalson chart left.Other modelsshown forcomparison.-620-8Sources of CO2removals (shaded area)shown on chart right10CDR Land use0-2-402020203020402050-8CO2 removalsGross CO2 emissions-6Net CO2 emissionsSource: IIASA NGFS Climate Scenarios Database, REMIND e: IIASA NGFS Climate Scenarios Database.NGFS SCENARIOS18TransitionThe speed and timing of the transition depends on the availability and deployment of variousforms of carbon dioxide removal, i.e. the long‑term storage of carbon in soils, plants and rocks.
Agriculture, forestry and land use Land uses such as agriculture account for significantemissions (left chart). As shown on the previous slide,preventing deforestation would play a significantrole in lowering CO2 emissions and even provide anet sink in some models and time periods.Changes in land useLand use emissionsNet Zero 205012Net Zero 2050Gt CO2 e / year in Net Zero 2050Cumulative change (million ha)20015010 The increase in forest cover and bioenergy croplandin a Net Zero by 2050 scenario would have to befacilitated by a reduction in other land uses, e.g.cropland for food production and pasture land (rightchart). The types of land cover that are reduced varyacross models.8 Emissions from other important GHGs, Methane(CH4) and Nitrous Oxide (N2O), reduce more graduallyin the scenarios compared to CO2 (left chart). Still,this would imply significant reductions in emissionsintensity given the increase in population duringthe first half of the 050N2OSource: IIASA NGFS Climate Scenarios Database, REMIND-MAgPIE model.-2002020Energy cropsForest203020402050Food cropsPastureSource: IIASA NGFS Climate Scenarios Database, REMIND-MAgPIE model.NGFS SCENARIOS19TransitionChanges in agriculture, forestry and land use are important as they account for about 20% oftotal greenhouse gas emissions and forest cover can help remove CO2 from the atmosphere.
Sector pathwaysNet Zero 2050Net Zero 2050USD (2010) trillionElectricityDirect costs To understand how transition risks materialiseacross different sectors of the economy, UNEP‑FIhas developed Risk Factor Pathways (RFPs), whichrepresent key corporate credit risk drivers: directand indirect emissions costs, changes in revenue,and required low‑carbon investment.* The NGFSscenarios can be used to calculate these
NGFS SCENARIOS 6 The NGFS Scenarios have been developed to provide a common starting point for analysing climate risks to the economy and financial system. While developed primarily for use by central banks and supervisors they may also be useful to the broader private sector, government and academia.