Transcription
SOCIAL CLASS IN AUSTRALIABEYOND THE ‘WORKING’AND ‘MIDDLE’ CLASSESANUPOLLSEPTEMBER 2015ANU College ofArts & SocialSciences
ANUPOLLSOCIAL CLASS IN AUSTRALIA:BEYOND THE ‘WORKING’ AND ‘MIDDLE’ CLASSESDr Jill Sheppard & Dr Nicholas BiddleANU Centre for Social Research and MethodsANU College of Arts and Social SciencesReport No. 19September 2015About the pollANUpoll is conducted for The Australian National University (ANU)by the Social Research Centre, an ANU Enterprise business.The poll is a national random sample of the adult population,and is conducted by telephone. In this poll, 1,200 people wereinterviewed between 13 and 27 July 2015 with a response rateof 21 per cent. The results have been weighted to represent thenational population. The poll’s margin of error is 2.5 per cent.Suggested citation: Sheppard, J. and Biddle, N. ANU Poll 19Social Class, 2015, [Computer file]. Canberra: AustralianData Archive, The Australian National University, 2015.
CONTENTSVice-Chancellor’s message1Social class: how we describe ourselves2Social class: how the data describe us4Established working class: age and disadvantage6Established middle class: medium advantage, medium capital7Mobile middle class: turning education into wealth8Emergent affluent class: earning but not saving9Established affluent class: advantaged all-rounders10Attitudes and behaviours: class differences11Key trends12ANUpoll questions13Social Class in Australiai
iiANUPOLL September 2015
VICE–CHANCELLOR’S MESSAGESocial research so often makes us question ourdeeply held beliefs about the world we live in.So it is with this, the 19th ANUpoll, which revealsgreater stratification in Australian society thanwe might otherwise have thought. Almost allAustralians perceive themselves as being fromeither the working or middle class of society.The findings presented here show that Australiansociety is best explained by five classes, insteadof just those two.It also, however, confirms some of our usual assumptions.The way we perceive our class membership aligns closely withwhat our economic, cultural and social capital says about us.We are aware of how what we have and what we do can shapeour place in society.The study also confirms that class defines our society lessthan it does British society. Based on these findings, it iseasier for Australians to move between classes from onegeneration to another, and to advance beyond the financialand social positions of our parents and grandparents. We donot rely so heavily on inherited class status in determining ourown positions.The ANUpoll is designed to inform public and policy debate, aswell as to assist scholarly research. It builds on the University’slong tradition of social survey research, which began in the1960s. Today, it fulfils the University’s mission of addressing andcontributing to issues of national importance.I trust that the release of this poll’s findings will ignite debate onclass and stratification in Australian society, while contributing toour understanding of Australian society generally.Professor Ian Young AOVice-Chancellor and PresidentSocial Class in Australia1
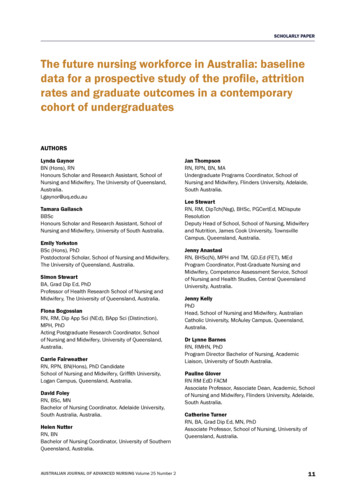
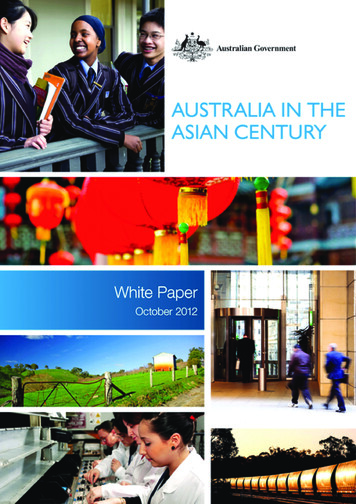
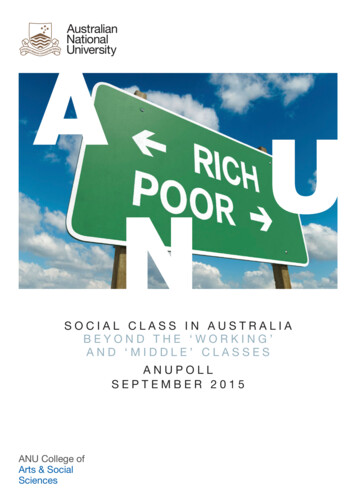
SOCIAL CLASS:H O W W E D E S C R I B E O U R S E LV E SKey Points Almost all Australians view themselves as belongingto a social class. More than half say they belong to the middle class. Two in five Australians describe themselves asworking class. Only two per cent see themselves as upper class. The tendency to view ourselves as middle class islongstanding, but is likely to have become stronger as‘white collar’ industries have expanded.Social class is a little like ‘swagger’.It is hard to define, and tough to measure,but you know it when you see it.One way of measuring the existence of class in a society is toexplore citizens’ thoughts about it. Although Australians thinkand talk about social class less than our counterparts in Britain,France, and Europe generally, we are surprisingly willing toidentify ourselves as members of one class or another. Almostall (94 per cent) of the Australians surveyed responded that theybelong to either the upper, middle or working class.Most Australians (52 per cent) view themselves as belongingto the middle class. Forty per cent describe themselves asbelonging to the working class, and only two per cent areprepared to admit to belonging to the upper class of Australiansociety (with six per cent providing no answer). There are nodifferences between self-described class membership on thebasis of gender, but it does have some relationship with age: theyoungest (between 18 and 24 years of age) and oldest (55 andolder) Australians disproportionately view themselves as middlerather than working class.Australians’ tendency to describe themselves as belonging tothe middle class is a long-standing phenomenon. Given a rangeof five classes from which to choose, 45 per cent of respondentsto the 2009 Australian Survey of Social Attitudes describedthemselves as middle class. A further 30 per cent describedthemselves as either upper-middle or lower-middle class.In 1987, the Australian Election Study found that 44 per centof Australians self-described as middle class, outnumberedslightly by the 47 per cent who viewed themselves as belongingto the working class. There is a small observable shift from selfdescribing as working class to middle class between 1987 and2015, which can most likely be explained by the concurrent shiftdecrease in manufacturing and other ‘blue collar’ industries andincrease in service and related professional industries.The inclination to view ourselves as either working or middleclass is not confined to Australians. The Gallup and GeneralSocial Survey polls in the United States regularly find that morethan 90 per cent of Americans view themselves as either middleor working class. While that number used to split evenly betweenmiddle and working class identifiers (i.e. 45 per cent identifyingas working class, and 45 per cent as middle class), since theglobal financial crisis in 2007 the self-described working class isgrowing while the self-described middle class shrinks. In Britain,where ‘working class’ traditionally refers to manual workers –coal miners and similar – the self-described working class tendsto be smaller than in Australia and the United States.2ANUPOLL September 2015
Upper Class 2%Middle Class 51.5%Per centageWorking Class 40.3%Refused/Don’t know 6.2%“Which social class would you say you belong to?”Source: ANUpoll on Social Class, 2015Social Class in Australia3
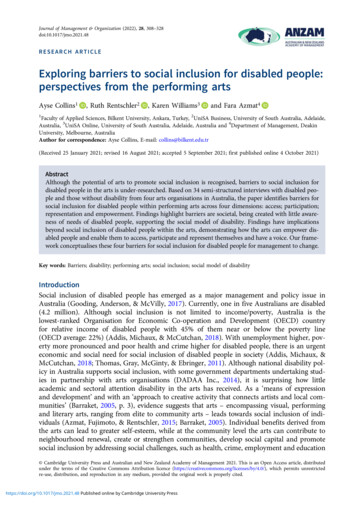
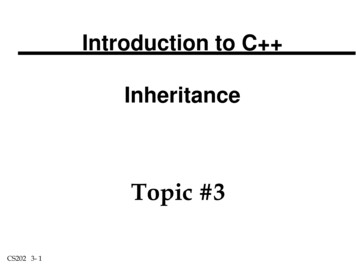
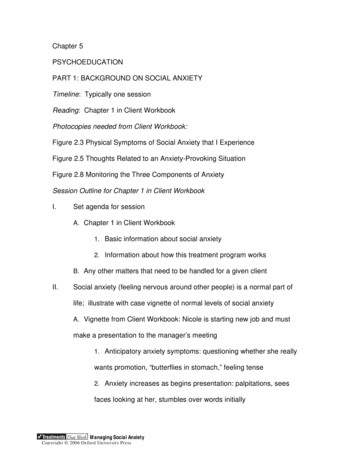
SOCIAL CLASS:H O W T H E D ATA D E S C R I B E U SKey Points Five classes can be identified in Australian society. They are: ‘established affluent’, ‘emergentaffluent’, ‘mobile middle’, ‘established middle, and‘established working’. The classes are based on respondents’ economic, socialand cultural capital. Most Australians self-described class approximates theirobjective class membership.Asking Australians howthey perceive their ownclass membership isimportant, but it onlyreveals half of the storyabout social class inAustralia.If self-described class membership is to be believed, there areonly two classes in Australia: working and middle. There wouldbe no one at the upper bounds of society. If class designations –‘working’, ‘middle’, ‘upper’, and variations of each – are to meananything in an objective sense, at least some Australians shouldbelong to the upper class. Otherwise, the middle class will alsoinclude the wealthiest, well-resourced and most advantagedmembers of the society, as well as those closer to the middle.Going beyond Australians’ self-described class, this study looksat what they do, who they know and what they have, to proposeobjective categories of social class in Australia. Building on astudy conducted by the British Broadcasting Corporation (BBC)and academic sociologists in the United Kingdom, social classis measured here by respondents’ possession of certain typesof ‘capital’. This approach draws on the work of sociologistand theorist Pierre Bourdieu, who emphasises the role ofeconomic, social and cultural capital in defining and entrenchingsocial stratification.To allow for comparison with British society, Australians wereasked almost identical questions to participants of the BBCstudy. Economic capital is measured by respondents’ householdincome and the estimated value of property they own (bymortgage or outright). Social capital is measured, in line with theBBC study, as the total number of occupations (from a providedlist) respondents can name among their social contacts. Thesecond measure of social capital is the mean occupationstatus score (using the Australian Socioeconomic Index 2006developed at the ANU) of respondents’ social contacts.4ANUPOLL September 2015Cultural capital is measured as the number of ‘highbrow’ and‘emerging’ cultural activities that respondents report havingundertaken in the past year. Highbrow activities include goingto the opera, going to the theatre, watching dance or balletperformances, and listening to classical music. Emergingactivities include going to gigs, listening to rock, listening to rapor hip-hop, playing video games, watching sport, and going tothe gym or exercising.From these six measures covering three forms of capital, it ispossible to identify five distinct, meaningful social classes amongrespondents and, by inference, Australian society. Employinglatent class analysis, a five class model was found to explainenough variation between individuals that the classes tell ussomething meaningful about society. Estimating greater than fiveclasses in the model did not add to its explanatory power. Bycontrast, the British study identified seven distinct classes. Whileinfluenced by it, Australia’s economic and social structures haveclearly evolved along different lines to Britain.The five observable (or ‘objective’)classes in Australian society can bedescribed as an established affluentclass, an emergent affluent class, amobile middle class, an establishedmiddle class, and an established workingclass. These classes are made up ofindividuals and there is obviously somevariation within each class. However,members of each class share plenty ofcommon traits.Each class is characterised by the possession of economic,social and cultural capital among its members. There arealso observable differences in the mean ages, educationalqualifications and the occupational prestige of members ineach class. Across all classes, but particularly the working andmiddle classes, there is evidence of intergenerational mobility inoccupational prestige. It is particularly notable in the two middleclasses, where the mean prestige score is almost ten pointshigher than members’ parents.The affluent classes, on the other hand, more closely reflectthe positions of their parents. In the case of the establishedaffluent class, members appear to enjoy the benefits of theirparents’ occupational prestige, earning high incomes at loweroccupational prestige than all but the working class.There are also clear differences in how members of eachobjective class describe themselves. The self-described andobjective classes are closely related, but not perfectly so. Thisis particularly evident in the self-reported middle and workingclasses. However, of the small minority of Australians whodescribe themselves as upper class, more than 40 per cent
Establishedworking(24 per cent)Establishedmiddle(26 per cent)Mobile middle(25 per cent)Emergentaffluent(11 per cent)Establishedaffluent(14 per cent)Household income (annual) 20,000 to 40,000 60,000 to 80,000 80,000 to 100,000 80,000 to 100,000 80,000 to 100,000Property value 250,000 to 500,000 500,000 to 1,000,000 500,000 to 1,000,000 500,000 to 1,000,000 500,000 to 1,000,000Total occupations known socially(range 0-18)6.610.712.51411.5Mean social contact prestige score(range 0-100)18.332.036.941.834.3‘Highbrow’ activities (range 0-4)1.11.51.41.61.6Emerging activities (range 0-7)2.83.64.15.24.5Age (years)66.258.350.433.241.4Education (range 1-12)6.67.78.48.28.1Mother’s occupational prestige score(range 0-100)40.347.446.948.850.7Father’s occupational prestige score(range 0-100)40.848.345.258.150.2R’s occupational prestige score(range 0-100)48.85554.954.251.3Mean characteristics by objective social class.Source: ANUpoll on Social Class, 2015belong to the established affluent class, while 29 per cent belongto the middle classes. Fewer than 10 per cent belong to theestablished working class.Australians who describe themselves as belonging to the middleclass overwhelmingly belong to either of the two objective middleclasses. Almost 30 per cent belong to the mobile middle class,transitioning out of the established middle class of their parentsand closer to the emergent affluent class. Nearly one quarterbelong to either of the two affluent classes, and a similar numberin the established working class.Self-described working class Australians predominantly belongto either the established working or middle classes, highlightingthat respondents appear keenly aware of their social status.Interestingly, almost one half belong to the either the establishedor mobile middle classes, which have among the highestmean occupational prestige of all five classes: occupationalprestige does not seem to preclude Australians from thinking ofthemselves as working lished AffluentEmergent AffluentMobile MiddleEstablished MiddleEstablished WorkingObjective class membership as a per centage ofself-described class membership.Source: ANUpoll on Social Class, 2015Social Class in Australia5
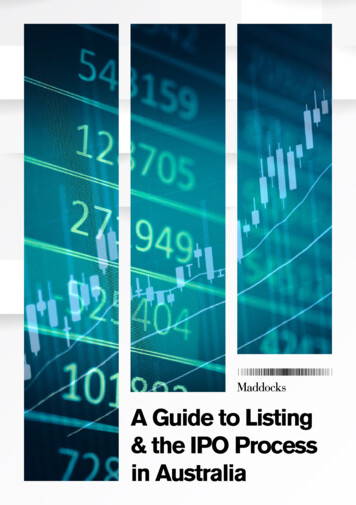
E S TA B L I S H E D W O R K I N G C L A S S :A G E A N D D I S A D VA N TA G EAs 24 per cent of the population, theestablished working class is one of thelargest of the five objective classes.Established working class Australians arethe oldest group, with a mean age of 66years. They have the lowest participationin both highbrow and emerging culturalactivities, the lowest social contact scoreand the lowest occupational prestigeamong their contacts.Key Points Members of the established working class have thelowest incomes, lowest occupational prestige and lowesteducational attainment of the five classes. They have largely advanced beyond the occupationalprestige of their parents, but started from the lowestbase of the classes. They are the oldest class on average, with a mean ageof 66.Members of this class have not received the intergenerationaladvantages typical of other classes: their parents worked in lowprestige jobs, and members currently earn the lowest householdincomes and possess the least valuable property assets. Theyalso have the lowest level of educational attainment of the fiveclasses, entrenching their relative intergenerational disadvantage.naio0.6Mean (Standardised)0.40.20– 0.2– 0.4Established WorkingEstablished Middle– 0.8Mobile Middle– 1.0Emergent Affluent– 1.5Established AffluentMean characteristics of the established working class, with variable scoringstandardised to allow for comparison across different measures.Source: ANUpoll on Social Class, 20156ANUPOLL September 2015natiopaRSc ’s oor cce u0.8– 0.6latupccFSc athor er’e sOccOMSc othor ere atsstivonlCntMPr eaes ntig Soe ehcttslIn the British study on which this study is based, the closestequivalent class is the ‘traditional working class’. However, whilethe established working class has the fewest advantages – orthe least capital – in Australia, in Britain a less advantaged classexists, which British researchers have titled the ‘precariat’. Thereis no evidence of such a class in the Australian data.
E S TA B L I S H E D M I D D L E C L A S S :M E D I U M A D VA N TA G E , M E D I U M C A P I TA LTrue to their name, the establishedmiddle class sits squarely in themiddle of the five classes in terms ofincome, assets, social and culturalcapital, educational attainment andintergenerational advantage.Key Points Members of the established middle class sit close tothe mean in terms of household income, property value,social and cultural capital, educational attainment andoccupational prestige. On average, they have outperformed their parents interms of occupational prestige but have not convertedthat into high household incomes. The Australian middle class has the second lowest meanhousehold incomes; the equivalent British class has thesecond highest.They are slightly older than other classes and – probably asa result – slightly less likely to participate in emerging culturalactivities such as going to gigs, using social media or listening torap music. It also appears that Australians tend to be right whenthey describe themselves as middle class. At 26 per cent of thepopulation, the established middle class is the largest of theobjective classes.While members of the established middle class have, likemembers of the established working class, outperformed theirparents in terms of occupational prestige, they have not entirelytransitioned to a different class. They have among the lowestaverage educational attainment, the highest occupationalprestige (which may be a factor of their age relative to moreadvantaged classes), but the second lowest household incomes.naionalattioupRSc ’s oor cce upaccFSc athor er’e sOccOMSc othor ere atsstivonlCntMPr eaes ntig Soe ehcttslThe Australian established middle class closely resembles the‘established middle class’ in Britain, although the British middleclass earns the second highest incomes among the sevenobservable classes. There are more Australians seeminglytransitioning out of the middle class towards affluence than areevident in the British data.0.80.6Mean (Standardised)0.40.20– 0.2– 0.4– 0.6– 0.8Established WorkingEstablished MiddleMobile Middle– 1.0Emergent Affluent– 1.5Established AffluentMean characteristics of the established middle class, with variable scoringstandardised to allow for comparison across different measures.Source: ANUpoll on Social Class, 2015Social Class in Australia7
MOBILE MIDDLE CLASS:T U R N I N G E D U C AT I O N I N T O W E A LT HMembers of the mobile middle class – thesecond largest class, with 25 per centof the population – come from similarbackgrounds to those of the establishedmiddle class, but are distinguished byhigher levels of educational attainmentand consequently higher rates ofhousehold income.Key Points Australians in the mobile middle class have come fromsimilar backgrounds to members of the establishedmiddle class, but with higher educational attainmenthave begun to transition closer to the affluentclass, earning high incomes and reporting highproperty wealth. Mobile middle class members are highly social, but notparticularly interested in cultural activities.They have almost identical occupational prestige tothe established middle class, but are on average eightyears younger.Also separating Australians in this class from those in theestablished middle class is their high rates of social capital.They have social contacts from a wider range of occupations,and those contacts have higher occupational prestige than thoseof established middle class members. Australians in the mobilemiddle class tend to socialise with people whose occupationalprestige is higher than their own, perhaps reflecting the upwardlymobile nature of this class.naio0.6Mean (Standardised)0.40.20– 0.2– 0.4Established WorkingEstablished Middle– 0.8Mobile Middle– 1.0Emergent Affluent– 1.5Established AffluentMean characteristics of the mobile middle class, with variable scoringstandardised to allow for comparison across different measures.Source: ANUpoll on Social Class, 20158ANUPOLL September 2015natiopaRSc ’s oor cce u0.8– 0.6latupccFSc athor er’e sOccOMSc othor ere atsstivonlCntMPr eaes ntig Soe ehcttslThere is no obvious equivalent to this class in British society.The classes transitioning out of the middle class in Britain areyounger, more highly educated and have higher cultural capital.
EMERGENT AFFLUENT CLASS:EARNING BUT NOT SAVINGThe emergent affluent class shares manyof the characteristics of the mobile middleclass, with two key differences: they areyounger, and in more of a hurry.Key Points Emergent affluent class members tend to resemblecommon ‘millennial generation’ stereotypes: they areyoung, benefit from intergenerational advantage, andearn much but save little.This class reflects many of the common ‘millennial’ generationstereotypes: they come from relative advantage, they are welleducated, have high incomes but few assets, they are highlysocial, and enmeshed in emerging culture but show relativelylittle interest in highbrow cultural activities. Members of this class are younger, have loweroccupational prestige and less interest in highbrowcultural activities than members of the establishedaffluent class. They are on track to join the established affluent classwithin their lifetimes.They have only average rates of occupational prestigethemselves, with their income outstripping their standing withinthe workforce. On the basis of their youth, the advantages oftheir parents’ status, their educational attainment and currenthousehold incomes, members of this emergent class appearlikely to entrench themselves in the established affluent classthroughout their lifetimes.naiotionalatupRSc ’s oor cce upaccFSc athor er’e sOccOMSc othor ere atsstivonlCntMPr eaes ntig Soe ehcttslThe corresponding British study shows three distinct subgroupswithin this class, which do not appear in Australia: the ‘technicalmiddle class’, ‘new affluent workers’, and ‘emergent serviceworkers’. Members of these three British ‘subclasses’ reporthigh rates of emerging cultural capital, social capital andhousehold incomes, but few savings.0.80.6Mean (Standardised)0.40.20– 0.2– 0.4– 0.6– 0.8Established WorkingEstablished MiddleMobile Middle– 1.0Emergent Affluent– 1.5Established AffluentMean characteristics of the emergent affluent class, with variable scoringstandardised to allow for comparison across different measures.Source: ANUpoll on Social Class, 2015Social Class in Australia9
E S TA B L I S H E D A F F L U E N T C L A S S :A D VA N TA G E D A L L - R O U N D E R SResembling an older generation ofemergent affluent class Australians, theestablished affluent class possess aboveaverage rates of economic, cultural andsocial capital.Key Points Members of the established affluent class do not havethe highest incomes or greatest wealth, but benefit fromintergenerational advantage more than other classes. In many ways, this class resembles an older generationof members of the emergent affluent class.They do not report extremely high rates of any specific measureof capital or advantage. Instead, they are well rounded in whatthey possess. Established affluent Australians are less advantaged andpossess less capital than their British equivalents.Established affluent class Australians have the strongestintergenerational advantage, in terms of parents’ occupationalprestige. They only outperform their parents’ prestige by anaverage of one point, across a 100-point scale: in this regardthey are the least mobile of any of the classes.Members of this class have the most diverse social networks,but not necessarily the most occupationally prestigiousnetworks. Similarly, they do not have particularly highoccupational prestige themselves, at slightly below the mean ofall Australians. As with the emergent affluent class, their incomesoutperform their occupational ranks.naio0.6Mean (Standardised)0.40.20– 0.2– 0.4Established WorkingEstablished Middle– 0.8Mobile Middle– 1.0Emergent Affluent– 1.5Established AffluentMean characteristics of the established affluent class, with variable scoringstandardised to allow for comparison across different measures.Source: ANUpoll on Social Class, 201510ANUPOLL September 2015natiopaRSc ’s oor cce u0.8– 0.6latupccFSc athor er’e sOccOMSc othor ere atsstivonlCntMPr eaes ntig Soe ehcttslThe equivalent class in British society is the ‘elite’ class,evoking notions of entrenched nobility. Moreover, the Britishelite has the highest incomes, savings and cultural capital ofthe seven classes in that society. In contrast, the most notablecharacteristic of the Australian established affluent class istheir intergenerational advantage, which has not translated intoparticularly high incomes or savings.
AT T I T U D E S A N D B E H AV I O U R S :CLASS DIFFERENCESKey Points Australian social classes also differ by political opinionsand attitudes. The affluent classes are the most satisfied with thedirection in which the country is heading, and the leastlikely to agree that it is government’s role to reduceinequalities between rich and poor Australians. The established affluent class is the most likely to favourtax cuts. The mobile and emerging classes, at both the middleand affluent levels, are the most supportive of increasedgovernment services.The classes inAustralian society,both self-describedand objective, are alsodistinguishable by theirattitudes to governmentand the economy.The self-described working class is more likely to report thatthey are either dissatisfied or very dissatisfied with the way thecountry is heading (45 per cent) compared to those who identifyas being in the upper or middle classes (37 per cent). Thereare three groupings on this question for the objective classmeasures. The established working and established middleclasses are the most dissatisfied (46 and 44 per cent), whereasthe emerging affluent and established affluent classes (36 and 37per cent) are the least dissatisfied. The mobile middle class is abit more ambivalent as a group (41 per cent).Some of the most intractable class conflict historically hasrelated to how much tax people should pay and the adequacy ofgovernment provided services. There are still some differences inthese views by class in contemporary Australia, but not always inthe direction we might expect. Respondents were asked: ‘If thegovernment had a choice between reducing taxes or spendingmore on social services, which do you think it should do?’ Thereare no real differences by self-described class in the per centagewho said they favoured reducing taxes (15 per cent), but thereare some differences in the per centage who were in favourof increasing services: 56 per cent for the affluent and middleclasses, and 51 per cent for the working class.Comparing attitudes by objective class reveals greaterdifferences. Around 20 per cent of the established affluentclass are in favour of reducing taxes compared to 12 per centof the established middle class. The emerging affluent and themobile middle are the most supportive of increasing services (56per cent for both), with the established affluent class the leastsupportive (47 per cent).Class differences appear to matter most when it comes toincome inequality. While the affluent and middle classes areslightly more likely to be in favour of increased services, theyare significantly less likely to feel that it is probably or definitelythe government’s role to reduce income differences betweenthe rich and the poor: 61 per cent compared to 71 per cent forthe working class. These differences hold across the objectiveclassification, with the established working class being 73 percent in favour compared to the other four classes ranging from62 to 65 per cent.Social Class in Australia11
K E Y T R E N D S : M O S T I M P O R TA N TPROBLEMS AND POLITICAL MOODVery satisfied9SatisfiedSource: ANUpolls March 2008-July 201512ANUPOLL September 15Mar-15Jul-14“What do you think is the most important problemfacing Australia today?”Source: ANUpolls March 2008 - July Jul-08Nov-080Mar-0810Dec-1020The consequent eight-point turnaround in net satisfaction alsomeans that net satisfaction has declined from 19 per cent inMarch to just 11 per cent in July: a fall of almost 50 per cent ina four month period. While this continues a long term trend insatisfaction with the country’s direction, from its high of 53 points– with 73 per cent satisfied and only 20 per cent dissatisfied – inthe very first ANUpoll in March 2008, it also represents a rapiddecline and the lowest net satisfaction recorded to date. Further,the current ANUpoll was conducted prior to Bronwyn Bishop’sresignation as Speaker of the House of Representatives, andrelated focus on parliamentarians’ travel entitlements. It is likelythat net dissatisfaction decreased even further during thatperiod. It remains to be seen if it will improve following MalcolmTurnbull’s installment as Prime Minister.Jun-103015Oct-0940Very dissatisfiedJul-095024Mar-0960Dissatisfied“All things considered, are you satisfied or dissatisfiedwith the way the country is heading?”Source: ANUpoll on National Identity, 2015Sep-08Economy/JobsImmigrationBetter Government8Per centageNet satisfaction (satisfied minus dissatisfied)Each ANUpoll has asked Australians to name the most (andsecond most) important problems facing the country. With theexception of only one instance, in July 2011, they have namedthe economy and jobs as the most important issue. This pollcontinues that trend, with 28 per cent nominating the economyand jobs (or some variation on those issues). Slightly moreAustralians nominate the need for ‘be
2 ANUPOLL September 2015 Key Points Almost all Australians view themselves as belonging to a social class. More than half say they belong to the middle class. Two in five Australians describe themselves as working class. Only two per cent see themselves as upper class. The tendency to view ourselves as middle class is longstanding, but is likely to have become stronger as