Transcription
Red Hat JBoss Enterprise ApplicationPlatform 7.2Performance Tuning GuideFor Use with Red Hat JBoss Enterprise Application Platform 7.2Last Updated: 2019-09-26
Red Hat JBoss Enterprise Application Platform 7.2 Performance TuningGuideFor Use with Red Hat JBoss Enterprise Application Platform 7.2
Legal NoticeCopyright 2019 Red Hat, Inc.The text of and illustrations in this document are licensed by Red Hat under a Creative CommonsAttribution–Share Alike 3.0 Unported license ("CC-BY-SA"). An explanation of CC-BY-SA isavailable athttp://creativecommons.org/licenses/by-sa/3.0/. In accordance with CC-BY-SA, if you distribute this document or an adaptation of it, you mustprovide the URL for the original version.Red Hat, as the licensor of this document, waives the right to enforce, and agrees not to assert,Section 4d of CC-BY-SA to the fullest extent permitted by applicable law.Red Hat, Red Hat Enterprise Linux, the Shadowman logo, the Red Hat logo, JBoss, OpenShift,Fedora, the Infinity logo, and RHCE are trademarks of Red Hat, Inc., registered in the United Statesand other countries.Linux is the registered trademark of Linus Torvalds in the United States and other countries.Java is a registered trademark of Oracle and/or its affiliates.XFS is a trademark of Silicon Graphics International Corp. or its subsidiaries in the United Statesand/or other countries.MySQL is a registered trademark of MySQL AB in the United States, the European Union andother countries.Node.js is an official trademark of Joyent. Red Hat is not formally related to or endorsed by theofficial Joyent Node.js open source or commercial project.The OpenStack Word Mark and OpenStack logo are either registered trademarks/service marksor trademarks/service marks of the OpenStack Foundation, in the United States and othercountries and are used with the OpenStack Foundation's permission. We are not affiliated with,endorsed or sponsored by the OpenStack Foundation, or the OpenStack community.All other trademarks are the property of their respective owners.AbstractThis book is a guide of performance tuning for Red Hat JBoss Enterprise Application Platform.
Table of ContentsTable of Contents.CHAPTER. . . . . . . . . . 1. .INTRODUCTION. . . . . . . . . . . . . . . . . . . . . . . . . . . . . . . . . . . . . . . . . . . . . . . . . . . . . . . . . . . . . . . . . . . . . . . . . . . . . . . . . . . . . . . . . . . . . . . .4. . . . . . . . . . . . .1.1. ABOUT THE USE OF EAP HOME IN THIS DOCUMENT4.CHAPTER. . . . . . . . . . 2. . MONITORING. . . . . . . . . . . . . . . PERFORMANCE. . . . . . . . . . . . . . . . . . . . . . . . . . . . . . . . . . . . . . . . . . . . . . . . . . . . . . . . . . . . . . . . . . . . . . . . . . . . . . . . . 5. . . . . . . . . . . . .2.1. CONFIGURING JBOSS EAP FOR REMOTE MONITORING CONNECTIONS52.2. JCONSOLE62.2.1. Connecting to a Local JBoss EAP JVM Using JConsole72.2.2. Connecting to a Remote JBoss EAP JVM Using JConsole2.3. JAVA VISUALVM2.3.1. Connecting to a Local JBoss EAP JVM Using VisualVM2.3.2. Connecting to a Remote JBoss EAP JVM Using VisualVM891011.CHAPTER. . . . . . . . . . 3. . DIAGNOSING. . . . . . . . . . . . . . .PERFORMANCE. . . . . . . . . . . . . . . . . ISSUES. . . . . . . . . . . . . . . . . . . . . . . . . . . . . . . . . . . . . . . . . . . . . . . . . . . . . . . . . . . . . . . 13.3.1. ENABLING GARBAGE COLLECTION LOGGING133.2. JAVA HEAP DUMPS133.2.1. Creating a Heap Dump3.2.1.1. OpenJDK and Oracle JDK3.2.1.2. IBM JDK3.2.2. Analyzing a Heap Dump3.3. IDENTIFYING HIGH CPU UTILIZATION BY JAVA THREADS1313141415. . . . . . . . . . . 4.CHAPTER. . .JVM. . . . .TUNING. . . . . . . . . . . . . . . . . . . . . . . . . . . . . . . . . . . . . . . . . . . . . . . . . . . . . . . . . . . . . . . . . . . . . . . . . . . . . . . . . . . . . . . . . 16.4.1. SETTING A FIXED HEAP SIZE4.2. CONFIGURING THE GARBAGE COLLECTOR1616Garbage Collection Logging Options4.3. ENABLING LARGE PAGES16164.4. ENABLING AGGRESSIVE OPTIMIZATIONS4.5. SETTING ULIMITS17184.6. HOST CONTROLLER AND PROCESS CONTROLLER JVM TUNING19.CHAPTER. . . . . . . . . . 5. . EJB. . . . . SUBSYSTEM. . . . . . . . . . . . . .TUNING. . . . . . . . . . . . . . . . . . . . . . . . . . . . . . . . . . . . . . . . . . . . . . . . . . . . . . . . . . . . . . . . . . . . . . . . . . . .20.5.1. BEAN INSTANCE POOLS205.1.1. Creating a Bean Instance Pool205.1.2. Specifying the Instance Pool a Bean Should Use215.1.3. Disabling the Default Bean Instance Pool215.2. BEAN THREAD POOLS215.2.1. Creating a Bean Thread Pool5.2.2. Configuring EJB Services to Use a Specific Bean Thread Pool5.3. EXCEPTIONS THAT INDICATE EJB SUBSYSTEM TUNING MIGHT BE REQUIRED222222.CHAPTER. . . . . . . . . . 6. . .DATASOURCE. . . . . . . . . . . . . . .AND. . . . . RESOURCE. . . . . . . . . . . . ADAPTER. . . . . . . . . . .TUNING. . . . . . . . . . . . . . . . . . . . . . . . . . . . . . . . . . . . . . . . . . . . . . . . . . .24.6.1. MONITORING POOL STATISTICS246.1.1. Datasource Statistics6.1.1.1. Enabling Datasource StatisticsEnable Datasource Statistics Using the Management CLIEnable Datasource Statistics Using the Management Console242424246.1.1.2. Viewing Datasource StatisticsView Datasource Statistics Using the Management CLIView Datasource Statistics Using the Management Console6.1.2. Resource Adapter StatisticsEnable Resource Adapter Statistics2525262626View Resource Adapter Statistics261
Red Hat JBoss Enterprise Application Platform 7.2 Performance Tuning Guide6.2. POOL ATTRIBUTES6.3. CONFIGURING POOL ATTRIBUTES6.3.1. Configuring Datasource Pool Attributes6.3.2. Configuring Resource Adapter Pool Attributes27282829. . . . . . . . . . . 7.CHAPTER. . MESSAGING. . . . . . . . . . . . . .SUBSYSTEM. . . . . . . . . . . . . .TUNING. . . . . . . . . . . . . . . . . . . . . . . . . . . . . . . . . . . . . . . . . . . . . . . . . . . . . . . . . . . . . . . . . . .30. . . . . . . . . . . 8.CHAPTER. . .LOGGING. . . . . . . . . . SUBSYSTEM. . . . . . . . . . . . . . TUNING. . . . . . . . . . . . . . . . . . . . . . . . . . . . . . . . . . . . . . . . . . . . . . . . . . . . . . . . . . . . . . . . . . . . . . 31.8.1. DISABLING LOGGING TO THE CONSOLE8.2. CONFIGURING LOGGING LEVELS8.3. CONFIGURING THE LOCATION OF LOG FILES313131.CHAPTER. . . . . . . . . . 9. . .UNDERTOW. . . . . . . . . . . . .SUBSYSTEM. . . . . . . . . . . . . TUNING. . . . . . . . . . . . . . . . . . . . . . . . . . . . . . . . . . . . . . . . . . . . . . . . . . . . . . . . . . . . . . . . . . . .32.9.1. BUFFER CACHES329.2. CONFIGURING BYTE BUFFER POOLS9.3. JSP CONFIGURATION9.4. LISTENERS323333. . . . . . . . . . . 10.CHAPTER. . . IO. . . SUBSYSTEM. . . . . . . . . . . . . .TUNING. . . . . . . . . . . . . . . . . . . . . . . . . . . . . . . . . . . . . . . . . . . . . . . . . . . . . . . . . . . . . . . . . . . . . . . . . . . . .35.10.1. CONFIGURING WORKERS10.1.1. Monitoring Worker Statistics353510.2. CONFIGURING BUFFER POOLS35. . . . . . . . . . . 11.CHAPTER. . .JGROUPS. . . . . . . . . . .SUBSYSTEM. . . . . . . . . . . . . TUNING. . . . . . . . . . . . . . . . . . . . . . . . . . . . . . . . . . . . . . . . . . . . . . . . . . . . . . . . . . . . . . . . . . . . . .37.11.1. MONITORING JGROUPS STATISTICS11.2. NETWORKING AND JUMBO FRAMES373811.3. MESSAGE BUNDLING11.4. JGROUPS THREAD POOLS383911.5. JGROUPS SEND AND RECEIVE BUFFERS39. . . . . . . . . . . 12.CHAPTER. . . TRANSACTIONS. . . . . . . . . . . . . . . . . .SUBSYSTEM. . . . . . . . . . . . . TUNING. . . . . . . . . . . . . . . . . . . . . . . . . . . . . . . . . . . . . . . . . . . . . . . . . . . . . . . . . . . . . . .40. . . . . . . . . . . .A.APPENDIX. . REFERENCE. . . . . . . . . . . . . .MATERIAL. . . . . . . . . . . . . . . . . . . . . . . . . . . . . . . . . . . . . . . . . . . . . . . . . . . . . . . . . . . . . . . . . . . . . . . . . . . . . . . . 41.2A.1. DATASOURCE STATISTICSA.2. RESOURCE ADAPTER STATISTICS4144A.3. IO SUBSYSTEM ATTRIBUTES44
Table of Contents3
Red Hat JBoss Enterprise Application Platform 7.2 Performance Tuning GuideCHAPTER 1. INTRODUCTIONA JBoss EAP installation is optimized by default. However, configurations to your environment,applications, and use of JBoss EAP subsystems can impact performance, meaning additionalconfiguration might be needed.This guide provides optimization recommendations for common JBoss EAP use cases, as well asinstructions for monitoring performance and diagnosing performance issues.IMPORTANTYou should stress test and verify all performance configuration changes underanticipated conditions in a development or testing environment prior to deploying themto production.1.1. ABOUT THE USE OF EAP HOME IN THIS DOCUMENTIn this document, the variable EAP HOME is used to denote the path to the JBoss EAP installation.Replace this variable with the actual path to your JBoss EAP installation.If you installed JBoss EAP using the ZIP install method, the install directory is the jboss-eap-7.2directory where you extracted the ZIP archive.If you installed JBoss EAP using the RPM install method, the install directory is/opt/rh/eap7/root/usr/share/wildfly/.If you used the installer to install JBoss EAP, the default path for EAP HOME is {user.home}/EAP-7.2.0:For Red Hat Enterprise Linux and Solaris: /home/USER NAME/EAP-7.2.0/For Microsoft Windows: C:\Users\USER NAME\EAP-7.2.0\If you used the Red Hat CodeReady Studio installer to install and configure the JBoss EAPserver, the default path for EAP HOME is {user.home}/devstudio/runtimes/jboss-eap:For Red Hat Enterprise Linux: /home/USER NAME/devstudio/runtimes/jboss-eap/For Microsoft Windows: C:\Users\USER NAME\devstudio\runtimes\jboss-eap orC:\Documents and Settings\USER NAME\devstudio\runtimes\jboss-eap\NOTEEAP HOME is not an environment variable. JBOSS HOME is the environment variableused in scripts.4
CHAPTER 2. MONITORING PERFORMANCECHAPTER 2. MONITORING PERFORMANCEYou can monitor JBoss EAP performance using any tool that can examine JVMs running on yourmachine. Red Hat recommends that you use either JConsole, for which JBoss EAP includes apreconfigured wrapper script, or Java VisualVM. Both these tools provide basic monitoring of JVMprocesses, including memory usage, thread utilization, loaded classes, and other JVM metrics.If you will be running one of these tools locally on the same machine that JBoss EAP is running on, thenno configuration is necessary. However, if you will be running one of these tools to monitor JBoss EAPrunning on a remote machine, then some configuration is required for JBoss EAP to accept remoteJMX connections.2.1. CONFIGURING JBOSS EAP FOR REMOTE MONITORINGCONNECTIONSFor a Standalone Server1. Ensure that you have created a management user. You might want to create a separatemanagement user to monitor your JBoss EAP server. See the JBoss EAP Configuration Guidefor details.2. When starting JBoss EAP, bind the management interface to the IP address that you will use toremotely monitor the server: EAP HOME/bin/standalone.sh -bmanagement IP ADDRESS WARNINGThis exposes all the JBoss EAP management interfaces, including themanagement console and management CLI, to the specified network.Ensure that you only bind the management interface to a private network.3. Use the following URI with your management user name and password in your JVM monitoringtool to connect to the JBoss EAP server. The URI below uses the default management port(9990).service:jmx:remote http://IP ADDRESS:9990For a Managed Domain HostUsing the above procedure of binding the management interface on a managed domain host will onlyexpose the host controller JVM for remote monitoring, and not the individual JBoss EAP serversrunning on that host.To configure JBoss EAP to remotely monitor individual servers on a managed domain host, follow theprocedure below.1. Create a new user in the ApplicationRealm that you will use to connect to the JBoss EAPservers for remote monitoring. See the JBoss EAP Configuration Guide for details.5
Red Hat JBoss Enterprise Application Platform 7.2 Performance Tuning Guide2. In the management CLI, run the following commands to add a remoting port to the socketbinding group, and add remoting to the ApplicationRealm. If necessary, replace the profilename and socket binding group in the following commands with the ones that you are using./profile full/subsystem jmx/remoting-connector jmx:add(use-management-endpoint false)/socket-binding-group full-sockets/socket-binding remoting:add(port 4447)/profile full/subsystem remoting/connector remoting-connector:add(socketbinding remoting,security-realm ApplicationRealm)3. When starting your JBoss EAP managed domain host, bind one or both of the followinginterfaces to an IP address that you will use for monitoring.If you want to connect to individual JBoss EAP server JVMs running on your manageddomain host, bind the public interface: EAP HOME/bin/domain.sh -b IP ADDRESSIf you want to connect to the JBoss EAP host controller JVM, also bind the managementinterface: EAP HOME/bin/domain.sh -bmanagement IP ADDRESS WARNINGThis exposes all the JBoss EAP management interfaces, including themanagement console and management CLI, to the specified network.Ensure that you only bind the management interface to a privatenetwork.4. Use the following details in your JVM monitoring tool:To connect to individual JBoss EAP server JVMs running on your managed domain host,use the following URI with your ApplicationRealm user name and password that wascreated earlier.service:jmx:remote://IP ADDRESS:4447To connect to different JBoss EAP servers on a single host, add the respective server’s portoffset value to the above port number.To connect to the JBoss EAP host controller JVM, use the following URI with amanagement user name and password.service:jmx:remote://IP ADDRESS:99902.2. JCONSOLEA preconfigured JConsole wrapper script is bundled with JBoss EAP. Using this wrapper script ensures6
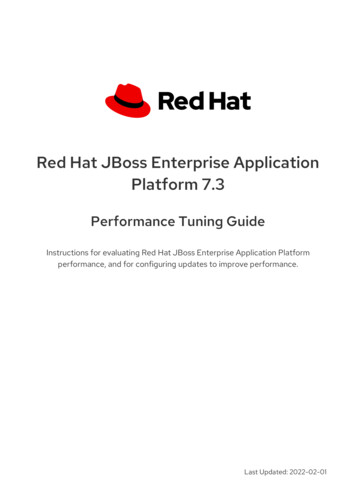
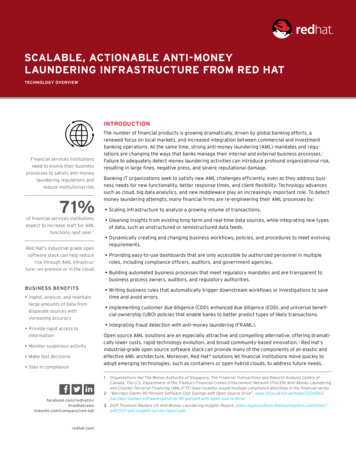
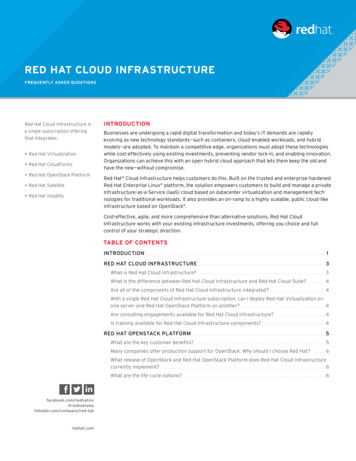
CHAPTER 2. MONITORING PERFORMANCEA preconfigured JConsole wrapper script is bundled with JBoss EAP. Using this wrapper script ensuresthat all the required libraries are added to the class path, and also provides access to the JBoss EAPmanagement CLI from within JConsole.2.2.1. Connecting to a Local JBoss EAP JVM Using JConsoleTo connect to a JBoss EAP JVM running on the same machine as JConsole:1. Run the jconsole script in EAP HOME/bin.2. Under Local Process, select the JBoss EAP JVM process that to want to monitor.For a standalone JBoss EAP server, there is one JBoss EAP JVM process.Figure 2.1. JConsole Local Standalone JBoss EAP Server JVMA JBoss EAP managed domain host has multiple JVM processes you can connect to: a hostcontroller JVM process, a process controller JVM process, and a JVM process for eachJBoss EAP server on the host. You can determine which JVM you have connected to by7
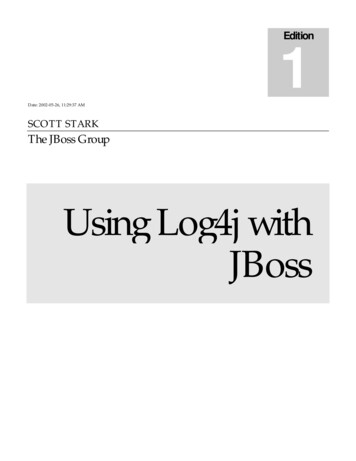
Red Hat JBoss Enterprise Application Platform 7.2 Performance Tuning Guidelooking at the JVM arguments.Figure 2.2. JConsole Local Managed Domain JBoss EAP JVMs3. Click Connect.2.2.2. Connecting to a Remote JBoss EAP JVM Using JConsolePrerequisitesConfigure JBoss EAP for remote monitoring connections .Download and extract a ZIP installation of JBoss EAP to your local machine. See the JBoss EAPInstallation Guide for details.8
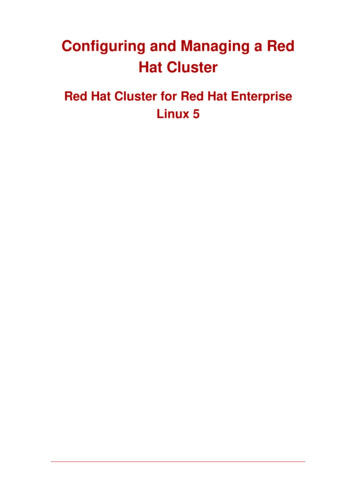
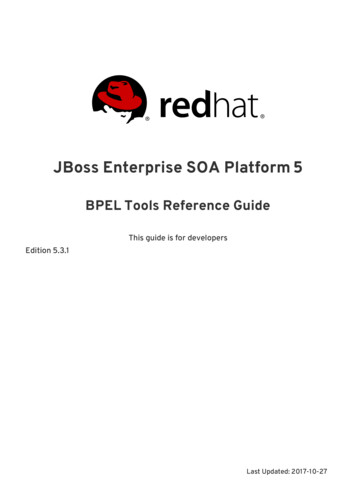
CHAPTER 2. MONITORING PERFORMANCE1. Run the jconsole script in EAP HOME/bin.2. Under Remote Process, insert the URI for the remote JBoss EAP JVM process that to want tomonitor.See the instructions on configuring JBoss EAP for remote monitoring connections for the URIto use.Figure 2.3. JConsole Remote JBoss EAP JVM3. Ensure that you provide the user name and password for the monitoring connection.4. Click Connect.2.3. JAVA VISUALVMJava VisualVM is included with the Oracle JDK, and is located at JAVA HOME/bin/jvisualvm. If you arenot using the Oracle JDK, VisualVM is also available for download from the VisualVM website. Note thatVisualVM does not work with the IBM JDK.9
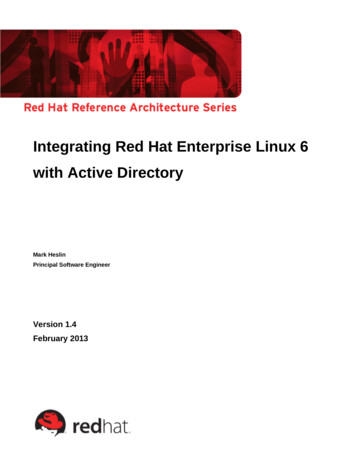
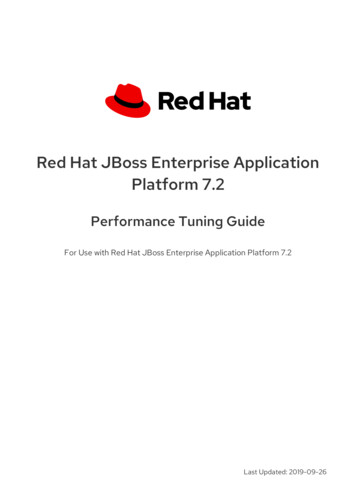
Red Hat JBoss Enterprise Application Platform 7.2 Performance Tuning GuideThe following sections provide instructions for using VisualVM to connect to a local or remote JBossEAP JVM. See the VisualVM documentation for other information on using VisualVM.2.3.1. Connecting to a Local JBoss EAP JVM Using VisualVMTo connect to a JBoss EAP JVM running on the same machine as VisualVM:1. Open VisualVM, and find the Applications pane on the left side of the VisualVM window.2. Under Local, double-click the JBoss EAP JVM process that you want to monitor.For a standalone JBoss EAP server, there is one JBoss EAP JVM process.Figure 2.4. VisualVM Local Standalone JBoss EAP Server JVMA JBoss EAP managed domain host has multiple JVM processes you can connect to: a hostcontroller JVM process, a process controller JVM process, and a JVM process for eachJBoss EAP server on the host. You can determine which JVM you have connected to bylooking at the JVM arguments.Figure 2.5. VisualVM Local Managed Domain JBoss EAP JVMs10
CHAPTER 2. MONITORING PERFORMANCEFigure 2.5. VisualVM Local Managed Domain JBoss EAP JVMs2.3.2. Connecting to a Remote JBoss EAP JVM Using VisualVMPrerequisitesConfigure JBoss EAP for remote monitoring connections .Download and extract a ZIP installation of JBoss EAP to your local machine. See the JBoss EAPInstallation Guide for details.1. You must add the required JBoss EAP libraries to your class path to remotely monitor a JBossEAP JVM. Start VisualVM with the arguments for required libraries on your local machine. Forexample: visualvm -cp:a EAP HOME/bin/client/jboss-cli-client.jar -JDmodule.path EAP HOME/modules2. In the File menu, select Add JMX Connection.3. Complete the details for your remote JBoss EAP JVM:In the Connection field, insert the URI for the remote JBoss EAP JVM process that to wantto monitor. See the instructions on configuring JBoss EAP for remote monitoringconnections for the URI to use.Select the Use security credentials check box, and enter the user name and password forthe monitoring connection.If you are not using an SSL connection, select the Do not require SSL connection check11
Red Hat JBoss Enterprise Application Platform 7.2 Performance Tuning GuideIf you are not using an SSL connection, select the Do not require SSL connection checkbox.Figure 2.6. VisualVM Remote JBoss EAP JVM4. Click OK.5. In the Applications pane on the left side of the VisualVM window, double-click on the JMX itemunder the remote host to open the monitoring connection.12
CHAPTER 3. DIAGNOSING PERFORMANCE ISSUESCHAPTER 3. DIAGNOSING PERFORMANCE ISSUES3.1. ENABLING GARBAGE COLLECTION LOGGINGExamining garbage collection logs can be useful when attempting to troubleshoot Java performanceissues, especially those related to memory usage.Other than some additional disk I/O activity for writing the log files, enabling garbage collection loggingdoes not significantly affect server performance.Garbage collection logging is already enabled by default for a standalone JBoss EAP server running onOpenJDK or Oracle JDK. For a JBoss EAP managed domain, garbage collection logging can be enabledfor the host controller, process controller, or individual JBoss EAP servers.1. Get the correct JVM options for enabling garbage collection logging for your JDK. Replace thepath in the options below to where you want the log to be created.NOTEThe Red Hat Customer Portal has a JVM Options Configuration Tool that canhelp you generate optimal JVM settings.For OpenJDK or Oracle JDK:-verbose:gc -Xloggc:/path/to/gc.log -XX: PrintGCDetails -XX: PrintGCTimeStamps XX: PrintGCApplicationStoppedTimeFor IBM JDK:-verbose:gc -Xverbosegclog:/path/to/gc.log2. Apply the garbage collection JVM options to your JBoss EAP server.See the JBoss EAP Configuration Guide for instructions on how to apply JVM options to astandalone server or servers in a managed domain .3.2. JAVA HEAP DUMPSA Java heap dump is a snapshot of a JVM heap created at a certain point in time. Creating and analyzingheap dumps can be useful for diagnosing and troubleshooting issues with Java applications.Depending on which JDK you are using, there are different ways of creating and analyzing a Java heapdump for a JBoss EAP process. This section covers common methods for Oracle JDK, OpenJDK, andIBM JDK.3.2.1. Creating a Heap Dump3.2.1.1. OpenJDK and Oracle JDKCreate an On-Demand Heap DumpYou can use the jcmd command to create an on-demand heap dump for JBoss EAP running onOpenJDK or Oracle JDK.13
Red Hat JBoss Enterprise Application Platform 7.2 Performance Tuning Guide1. Determine the process ID of the JVM that you want to create a heap dump from.2. Create the heap dump with the following command: jcmd JAVA PID GC.heap dump -all true FILENAME.hprofThis creates a heap dump file in the HPROF format, usually located in EAP HOME orEAP HOME/bin. Alternatively, you can specify a file path to another directory.Create a Heap Dump Automatically on OutOfMemoryErrorYou can use the -XX: HeapDumpOnOutOfMemoryError JVM option to automatically create a heapdump when an OutOfMemoryError exception is thrown.This creates a heap dump file in the HPROF format, usually located in EAP HOME or EAP HOME/bin.Alternatively, you can set a custom path for the heap dump using -XX:HeapDumpPath /path/. If youspecify a file name using -XX:HeapDumpPath, for example, XX:HeapDumpPath /path/filename.hprof, the heap dumps will overwrite each other.See the JBoss EAP Configuration Guide for instructions on how to apply JVM options to a standaloneserver or servers in a managed domain .3.2.1.2. IBM JDKWhen using the IBM JDK, heap dumps are automatically generated when an OutOfMemoryError isthrown.Heap dumps from the IBM JDK are saved in the /tmp/ directory as a portable heap dump (PHD)formatted file.3.2.2. Analyzing a Heap DumpHeap Dump Analysis ToolsThere are many tools that can analyze heap dump files and help identify issues. Red Hat Supportrecommends using the Eclipse Memory Analyzer tool (MAT) , which can analyze heap dumps formattedin either HPROF or PHD formats.For information on using Eclipse MAT, see the Eclipse MAT documentation .Heap Dump Analysis TipsSometimes the cause of the heap performance issues are obvious, but other times you may need anunderstanding of your application’s code and the specific circumstances that cause issues like anOutOfMemoryError. This can help to identify whether an issue is a memory leak, or if the heap is just notlarge enough.Some suggestions for identifying memory usage issues include:If a single object is not found to be consuming too much memory, try grouping by class to see ifmany small objects are consuming a lot of memory.Check if the biggest usage of memory is a thread. A good indicator of this is if theOutOfMemoryError-triggered heap dump is much smaller than the specified Xmx maximumheap size.A technique to make memory leaks more detectable is to temporarily double the normal14
CHAPTER 3. DIAGNOSING PERFORMANCE ISSUESA technique to make memory leaks more detectable is to temporarily double the normalmaximum heap size. When an OutOfMemoryError occurs, the size of the objects related to thememory leak will be about half the size of the heap.When the source of a memory issue is identified, you can view the paths from garbage collection roots tosee what is keeping the objects alive.3.3. IDENTIFYING HIGH CPU UTILIZATION BY JAVA THREADSNOTEFor customers using JBoss EAP on Red Hat Enterprise Linux or Solaris, the JVMPeg labtool on the Red Hat Customer Portal helps collect and analyze Java thread information toidentify high CPU utilization. Follow the instructions for using the JVMPeg lab toolinstead of using the following procedure.For OpenJDK and Oracle JDK environments, Java thread diagnostic information is available using thejstack utility.1. Identify the process ID of the Java process that is utilizing a high percentage of the CPU.It can also be useful to obtain per-thread CPU data on high-usage processes. This can be doneusing the top -H command on Red Hat Enterprise Linux systems.2. Using the jstack utility, create a stack dump of the Java process. For example, on Linux andSolaris:jstack -l JAVA PROCESS ID high-cpu-tdump.outYou might need to create multiple dumps at intervals to see any changes or trends over aperiod of time.3. Analyze the stack dumps. You can use a tool such as the Thread Dump Analyzer (TDA) .15
Red Hat JBoss Enterprise Application Platform 7.2 Performance Tuning GuideCHAPTER 4. JVM TUNINGConfiguring optimal JVM options for your applications and JBoss EAP environment is one of the mostfundamental ways to tune performance. This chapter covers configuring some general JVM options.NOTEMany of the JVM options listed in this chapter can be easily generated using the JVMOptions Configuration Tool on the Red Hat Customer Portal.See the JBoss EAP Configuration Guide for instructions on how to apply JVM options to a standaloneserver or servers in a managed domain .4.1. SETTING A FIXED HEAP SIZEYou must set an appropriate heap size to prevent out of memory errors.The -Xms option sets the initial heap size, and -Xmx sets the maximum heap size. It is recommended forproduction environments that you set the initial and maximum heap size options to the same size, sothat the heap size is fixed and pre-allocated.For example, the following options set a 2048 MB heap size:-Xms2048M -Xmx2048MIt is recommended that you test your applications under load in a development environment todetermine the maximum memory usage. Your production heap size should be at least 25% higher thanthe tested maximum to allow room for overhead.4.2. CONFIGURING THE GARBAGE COLLECTORAlthough the parallel garbage collector, also known as the throughput garbage collector, is the defaultgarbage collector in Java 8 for server-class machines, Red Hat recommends using the G1 garbagecollector, which is expected to be the default from Java 9 onward. The G1 garbage collector generallyperforms better than the CMS and parallel garbage collectors in most scenarios.To enable the G1 collector, use the following JVM option:-XX: UseG1GCGarbage Collection Logging OptionsGarbage collection logging is enabled by default for standalone JBoss EAP servers. To enable garbagecollection logging for a JBoss EAP managed domain, see Section 3.1, “Enabling Garbage CollectionLogging”.4.3. ENABLING LARGE PAGESEnabling large pages for JBoss EAP JVMs results in pages that are locked in memory and cannot beswapped to disk like regular memory.Especially for memory-intensive applications, the advantage of using large pages is that the heapcannot be paged or swapped to disk, and is thus always readily available.16
CHAPTER 4. JVM TUNINGOne disadvantage of using large pages is that other processes running on the system might not havequick access to memory, which might result in excessive paging for these processes.As with any other performance configuration change, it is recommended that you test the impact of thechange in a testing environment.1. You must ensure that your operating system configuration allows for processes to use largepages.For Red Hat Enterprise Linux systems, you must explicitly configure HugeTLB pages toguarantee that JBoss EAP processes will have access to large pages.For information on configuring Red Hat Enterprise Linux memory options, see the Memorychapter in the Red Hat Enterprise Linux Performance Tuning Guide.For Windows Server systems, the user that is running JBoss EAP must have the large pagesprivilege assigned:1. Select Control Panel Administrative Tools Local Security Policy.2. Select Local Policies User Rights Assignment.3. Double-click Lock pages in memory.4. Add the Windows Server users and user groups that you want to use large pages.5. Restart the machine.2. Enable or disable large page support:To explicitly enable large page support for JBoss EAP JVMs, use the following JVM option:-XX: UseLargePagesTo explicitly disable large page support for JBoss EAP JVMs, use the following JVM option:-XX:-UseLargePages3. When starting JBoss EAP, ensure that there are no warnings related to reserving memory.On Red Hat Enterprise Linux, an error might look like:OpenJDK 64-Bit Server VM warning: Failed to reserve shared memory. (error 1)On Windows Server, an error might look like:Java HotSpot(TM) 64-Bit Server VM warning: JVM cannot use large page memorybecause it does not have enough privilege to lock pages in memory.If you do see warnings, verify that your operating system configuration and JVM options areconfigured correctly.For more information, see the Oracle documentation on Java support for large pages .4.4. ENABLING AGGRESSIVE OPTIMIZATIONSUsing the aggressive optimizations (AggressiveOpts) JVM option can provide performance17
Red Hat JBoss Enterprise Application Platform 7.2 Performance Tuning GuideUsing the aggressive optimizations (AggressiveOpts) JVM option can provide performanceimprovements for your environment. This option enables Java performance optimization features thatare expected to become default in future Java releases.To enable AggressiveOpts, use the following JVM option:-XX: AggressiveOpts4.5. SETTING ULIMITSFor Red Hat Enterprise Linux and Solaris platforms, you must configure appropriate ulimit values forJBoss EAP JVM processes. The "soft" ulimit can be temporarily exceeded, while the "hard" ulimit is thestrict ceiling for the usage of a resource. Appropriate ulimit values vary depending on your environmentand applications.IMPORTANTIf you are using IBM JDK, it is important to note that IBM JDK uses the soft limit for themaximum number of open files used by a JVM process. On Red Hat Enterprise Linux, thedefault soft limit (1024) is considered too low for JBoss EAP processes using IBM JDK.If the limits applied to JBoss EAP processes are too low,
CHAPTER 2. MONITORING PERFORMANCE You can monitor JBoss EAP performance using any tool that can examine JVMs running on your machine. Red Hat recommends that you use either JConsole, for which JBoss EAP includes a preconfigured wrapper script, or Java VisualVM. Both these tools provide basic monitoring of JVM