Transcription
Design Patterns CourseEssentials of JavaPerformance TuningDr Heinz Kabutz Kirk PepperdineJava Champions1
Design Patterns CourseOur Typical Story Customer JoGoSlo Ltd calls us in desperation– Millions of Rands invested– Users complain about poor performance Customers consider abandoning the project Developers in a panic– 6 man months already invested with no results– Can almost reproduce the problem– Still had some ideas what to do– However management has lost confidence We have 5 days to diagnose problem2H
Design Patterns CourseSolve All Your Performance Problems3H
Design Patterns CourseAuthors of Talk Kirk Pepperdine– Engaged around the world to solve Java performanceproblems– http://www.javaperformancetuning.com4H
Design Patterns CourseAuthors of Talk Heinz Kabutz– The Java Specialists’ Newsletter– Based in Cape Town, South Africa– Moving to Crete, Greece towards end of 2006– http://www.javaspecialists.co.za5K
Design Patterns CourseProject in Crisis What do people do under stress?– Decision making skills are much impaired– Not in learning mode– Almost impossible to introduce new tools Tend to rely on the familiar Performance tuning requires own skillsets– Takes time to learn– When is a good time to learn CPR?6K
Design Patterns CoursePanic Attack Lots of finger pointing between groups Without real evidence developers start to guess– Start changing code (that’s what developers do) Convert Vector to ArrayList Convert String to StringBuffer Add more threads Add more memory Focus on database interactions– with unpredictable results How do we avoid this?7K
Design Patterns CourseMeasure,don’t guess!8K
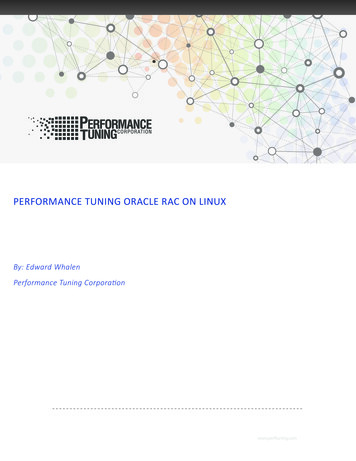
Design Patterns CourseHeap Usage after GC9K
Design Patterns CourseTypical Production Environment10K
Design Patterns CourseHardware Resources11K
Design Patterns CourseJava Virtual Machine Resources12H
Design Patterns CourseApplication13H
Design Patterns CoursePeople System usage patterns– What they are doing? Rate of doing work?14H
Design Patterns CourseForward Propagation of Actions People telling application what to do Application tells the JVM what it needs done– Direct consequence of what the people are asking– And how application was coded JVM tells the hardware what it needs done– Direct consequence of what the application is asking– And how JVM was coded and configured15H
Design Patterns CourseBackward Propagation of Trouble If hardware does not have enough capacity, people willsee bad response times If JVM is incorrectly configured, people will see badresponse times If application is suffering from contention, people willsee bad response times Therefore, the only information you start with is thatpeople are experiencing poor response times What to do next?16H
Design Patterns CourseW5 of Investigative Journalism Five questions asked by investigators:– Who ? Which resource is exhibiting the problem?– What ? Observation: what do the users see?– Where ? Which layer is exhibiting the problem?– When ? Are there any peculiarities about when the problems occur?– Why ? An explanation of the observation from system perspective17H
Design Patterns CourseTypical Production EnvironmentWhatWhereWho18H
Design Patterns CoursePlan of Action Review or set the performance targets Layer by layer performance investigation Start with hardware– Work outward until we find overextended resource Need a repeatable test– Need to know what the people are doing– Need a test harness– Need a realistic test environment19K
Design Patterns CourseJoGoSlo Test Environment Database did not have adequate amount of data– Solution: Cloned the production database Did not have a test harness– Solution: Introduced Apache JMeter20K
Design Patterns CourseTest Harness Software that simulates realistic user activity– Includes normal activity, coffee breaks, user mistakes– People will use system in unexpected ways Good test harness:– Easily scripted to create our usage patterns Randomize test data input Ability to randomize think times Validate responses from server– Monitor response times and other system parameters21K
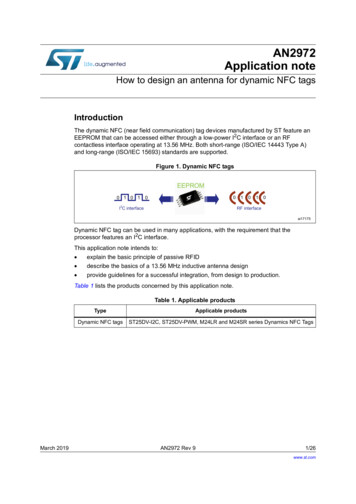
Design Patterns CourseTest Harness: Apache JMeter Project by Apache Software Foundation– Open source Used extensively for testing web applications– Can also be applied in other environments http://jakarta.apache.org/jmeter/index.html22K
Design Patterns Course23K
Design Patterns CourseUsage PatternRandomizedTimerTraffic Recorder24K
Design Patterns CourseParameterisedinput25K
Design Patterns CourseRealistic Test Environment Production environment?– Not desirable and usually not an option QA environment should– Perfectly resemble your production environment Data sizes, memory sizes, cache sizes, disk speeds,network speeds, should be the same– May need to consider the “when” Sometimes have to add external elements to test Don’t extrapolate!– You do not know when you will hit the wall26H
Design Patterns CoursePerformance WallWhen will you hit the wall?27H
Design Patterns CourseWho and Where Turn on monitoring of hardware Use the “what” to turn on additional low-impact monitoring,such as:– Verbose GC logging -Xloggc: filename – JDBC logging e.g. p6spy– JNI logging– RMI logging– Socket logging Beware of Heisenberg Uncertainty! “You can’t observe a system without affecting the system”28H
Design Patterns CourseRun the Benchmark Isolate your system Start system from known consistent point Run JMeter or other test harness against system Observe if the “what” matches the users’ experiences Failures in the system should invalidate the run Record everything– Start time, end time, observations, response time, configurations,date of birth, starsign, basically anything that you might or mightnot need– Use a physical notepad – mouse in left hand29H
Design Patterns CourseHow Long is Each Run? System must be in a steady state– Issues about test harness that need to be considered Beyond the scope of this talk System should exhibit the problems experienced byusers Can be 30 seconds or 30 days– Typically an hour Burn in the problem30H
Design Patterns CourseAnalysis Hardware– Carefully examine the output from monitoring and eliminateunderutilised components from the list– Fully utilised components are bottlenecks CPU– Look at execution profile, such as –Xrunhprof Memory– Look at GC, caching, large DB queries, memory leaks IO Wait– Will prevent CPU from being fully utilised If no hardware bottlenecks, look at the JVM layer31K
Design Patterns CourseJava Virtual Machine Assuming hardware does not show problem Heap memory– Not enough memory in virtual machine Lock Contention– Excessive stop-the-world garbage collection If no JVM bottlenecks, look at application layer32K
Design Patterns CourseJava Application Layer Thread lock contention– Only thing that you would not have diagnosed by now– Get thread dump See what they are waiting on Eliminate the expected If you have not found the problem by now, examineyour testing process– It might help confirming that you have correctly simulated theusers Go visit the floor Examine run logs33K
Design Patterns CourseBluedragon ThreadDumpFull thread dump Java HotSpot(TM) Server VM (1.4.2 08-b03 mixed mode):"RMI ConnectionExpiration-[192.168.0.15:34113]" daemon prio 1 tid 0x0892f658 nid 0x2d7awaiting on condition [5b86f000.5b86f494]at java.lang.Thread.sleep(Native Method)at sun.rmi.transport.tcp.TCPChannel Reaper.run(TCPChannel.java:447)at java.lang.Thread.run(Thread.java:534)"RMI TCP Connection(902)-192.168.0.15" daemon prio 1 tid 0x41e112b8 nid 0x2d7a runnable[5ccff000.5ccff414]at java.net.SocketInputStream.socketRead0(Native Method)at java:129)at am.java:183)at am.java:201)- locked 0x49978800 (a java.io.BufferedInputStream)at ava:66)at TCPTransport.java)at sun.rmi.transport.tcp.TCPTransport ConnectionHandler.run(TCPTransport)at java.lang.Thread.run(Thread.java:534)34K
Design Patterns CourseBluedragon ThreadDump"PingThread-8692809" daemon prio 1 tid 0x081a3058 nid 0x2d7a waiting on condition[5bda9000.5bda9294]at java.lang.Thread.sleep(Native Method)at org.exolab.jms.client.rmi.RmiJmsConnectionStub tManagerThread" daemon prio 1 tid 0x083101f8 nid 0x2d7a in Object.wait()[5caa9000.5caa9514]at java.lang.Object.wait(Native Method)- waiting on 0x47aa2800 (a java.lang.Object)at java.lang.Object.wait(Object.java:429)at ventManager.java)- locked 0x47aa2800 (a java.lang.Object)at 8183604" daemon prio 1 tid 0x08136dc8 nid 0x2d7a waiting on condition[5cc7f000.5cc7f494]at java.lang.Thread.sleep(Native Method)at org.exolab.jms.client.rmi.RmiJmsConnectionStub PingThread.run(RmiJmsConnectionStub.java:249)35K
Design Patterns CourseBluedragon ThreadDump"RMI RenewClean-[192.168.0.15:34113]" daemon prio 1 tid 0x081a2c68 nid 0x2d7a inObject.wait() [5ba10000.5ba10594]at java.lang.Object.wait(Native Method)- waiting on 0x4858a940 (a java.lang.ref.ReferenceQueue Lock)at .java:111)- locked 0x4858a940 (a java.lang.ref.ReferenceQueue Lock)at sun.rmi.transport.DGCClient EndpointEntry RenewCleanThread.run(DGCClient.java:500)at dPool0-33" prio 1 tid 0x41ec8710 nid 0x2d7a in Object.wait()[5ca29000.5ca29594]at java.lang.Object.wait(Native Method)- waiting on 0x47a5 (a org.mortbay.thread.BoundedThreadPool PoolThread)at org.mortbay.thread.BoundedThreadPool PoolThread.run(BoundedThreadPool)- locked 0x47a520b8 (a org.mortbay.thread.BoundedThreadPool PoolThread)36K
Design Patterns CourseBluedragon ThreadDump"BoundedThreadPool0-32" prio 1 tid 0x5a159ed0 nid 0x2d7a runnable [5c9a9000.5c9a9614]at java.net.SocketInputStream.socketRead0(Native Method)at java:129)at int.java:99)at org.mortbay.jetty.bio.SocketConnector Connection.fill(SocketConnector)at java:257)at rser.java:192)at tion.java:293)at org.mortbay.jetty.bio.SocketConnector Connection.run(SocketConnector)at org.mortbay.thread.BoundedThreadPool PoolThread.run(BoundedThreadPool)- locked 0x47a521f8 (a org.mortbay.thread.BoundedThreadPool PoolThread)37K
Design Patterns CourseBluedragon ThreadDump"BoundedThreadPool0-31" prio 1 tid 0x5ad60d78 nid 0x2d7a runnable [5c929000.5c929694]at pGenerator.java:878)at enerator.java:681)at ator.java:671)at nection.java:388)at org.mortbay.jetty.HttpConnection.access 1500(HttpConnection.java:38)at org.mortbay.jetty.HttpConnection 598)at java:487)at rser.java:196)at tion.java:293)at org.mortbay.jetty.bio.SocketConnector Connection.run(SocketConnector)at org.mortbay.thread.BoundedThreadPool PoolThread.run(BoundedThreadPool)- locked 0x47a52158 (a org.mortbay.thread.BoundedThreadPool PoolThread)38K
Design Patterns CourseBluedragon ThreadDump"BoundedThreadPool0-30" prio 1 tid 0x41e2f878 nid 0x2d7a in Object.wait()[5c8a9000.5c8a9714]at java.lang.Object.wait(Native Method)- waiting on 0x47a5 (a org.mortbay.thread.BoundedThreadPool PoolThread)at org.mortbay.thread.BoundedThreadPool PoolThread.run(BoundedThreadPool)- locked 0x47a52298 (a org.mortbay.thread.BoundedThreadPool PoolThread)"BoundedThreadPool0-29" prio 1 tid 0x5a4c5650 nid 0x2d7a in Object.wait()[5c828000.5c828794]at java.lang.Object.wait(Native Method)- waiting on 0x47a5 (a org.mortbay.thread.BoundedThreadPool PoolThread)at org.mortbay.thread.BoundedThreadPool PoolThread.run(BoundedThreadPool)- locked 0x47a52108 (a org.mortbay.thread.BoundedThreadPool PoolThread)"BoundedThreadPool0-28" prio 1 tid 0x5a4c53f8 nid 0x2d7a runnable [5c7a8000.5c7a8814]at java.net.SocketInputStream.socketRead0(Native Method)at java:129)at int.java:99)at org.mortbay.jetty.bio.SocketConnector Connection.fill(SocketConnector)at java:257)at rser.java:192)at tion.java:293)at org.mortbay.jetty.bio.SocketConnector Connection.run(SocketConnector)39K
Design Patterns CourseBluedragon ThreadDump"BoundedThreadPool0-27" prio 1 tid 0x41e6a640 nid 0x2d7a in Object.wait()[5c728000.5c728894]at java.lang.Object.wait(Native Method)- waiting on 0x47a5 (a org.mortbay.thread.BoundedThreadPool PoolThread)at org.mortbay.thread.BoundedThreadPool PoolThread.run(BoundedThreadPool)- locked 0x47a52338 (a org.mortbay.thread.BoundedThreadPool PoolThread)"BoundedThreadPool0-26" prio 1 tid 0x41e693f8 nid 0x2d7a in Object.wait()[5c6a8000.5c6a8914]at java.lang.Object.wait(Native Method)- waiting on 0x47a5 (a org.mortbay.thread.BoundedThreadPool PoolThread)at org.mortbay.thread.BoundedThreadPool PoolThread.run(BoundedThreadPool)- locked 0x47a52248 (a org.mortbay.thread.BoundedThreadPool PoolThread)"BoundedThreadPool0-25" prio 1 tid 0x086b1c50 nid 0x2d7a in Object.wait()[5c628000.5c628994]at java.lang.Object.wait(Native Method)- waiting on 0x47a4 (a org.mortbay.thread.BoundedThreadPool PoolThread)at org.mortbay.thread.BoundedThreadPool PoolThread.run(BoundedThreadPool)- locked 0x47a4e180 (a org.mortbay.thread.BoundedThreadPool PoolThread)40K
Design Patterns CourseBluedragon ThreadDump According to client, system was idle– Did not accept any more connection requests Let’s go back a few slides – Why was HttpGenerator.prepareBuffers() being called?41K
Design Patterns CourseBluedragon ThreadDump"BoundedThreadPool0-31" prio 1 tid 0x5ad60d78 nid 0x2d7a runnable [5c929000.5c929694]at pGenerator.java:878)at enerator.java:681)at ator.java:671)at nection.java:388)at org.mortbay.jetty.HttpConnection.access 1500(HttpConnection.java:38)at org.mortbay.jetty.HttpConnection 598)at java:487)at rser.java:196)at tion.java:293)at org.mortbay.jetty.bio.SocketConnector Connection.run(SocketConnector)at org.mortbay.thread.BoundedThreadPool PoolThread.run(BoundedThreadPool)- locked 0x47a52158 (a org.mortbay.thread.BoundedThreadPool PoolThread)42K
Design Patterns CourseAddressing the Problem Add more hardware– Often the cheapest solution– 100% CPU – is it possible to add faster CPU? May not always solve the problem43H
Design Patterns CourseJava Virtual Machine Tuning Configuration– e.g. heap sizing, hotspot compilers, etc.44H
Design Patterns CourseApplication Code Otherwise, all roads lead back to application– Implies coding changes– Expensive, time consuming, error prone– Need good regression testing Well designed code makes changes easier– DRY (don’t repeat yourself)– SRP (single responsibility principle)– Correct design patterns http://www.javaspecialists.co.za45H
Design Patterns CourseApplication Profiling Java has built-in profiling tools Run the JVM with –Xrunprof Other alternatives available from– http://www.javaperformancetuning.com46H
Design Patterns CourseThis is the Why! Profiling is the measurement that tells us “why”– From there we can implement the fix Run benchmark to ensure problem solved Regression test Have you reached your performance target?– If not, start from the beginning and find next bottleneck– When problem #1 is solved, problem #2 might be gone Avoid fixing more than one problem at a time47K
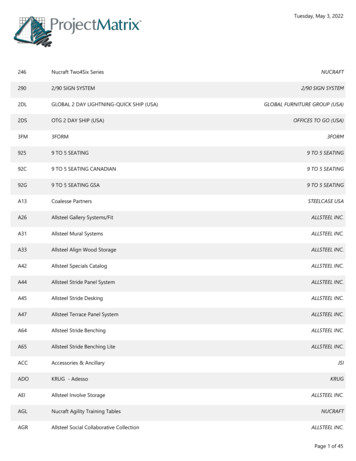
Design Patterns CourseHeap Usage after GC48K
Design Patterns CourseJoGoSlo Why? Discussions with client suggested database caching– Suspected cached “SELECT * FROM very large table” Investigation confirmed memory leak Troublesome point– Users claimed application sometimes recovered Question: is this from the database interaction or amemory leak in a long-term temporary object? Hypothesis: Memory leak could be from HTTPSession49K
Design Patterns CourseJoGoSlo Why? HTTPSession timeout correlated strongly withdecrease in memory– Confirmed with memory profiler Output from memory profilers is often very confusing forlarge systems This additional information helped us filter the memoryprofiler– Bingo! The HTTPSession was found to be retaining sessionobject, due to the improper scoping of Struts Sessions50K
Design Patterns CourseConclusion Don’t measure, guess – Then call us!51H
Design Patterns CourseJHUG AthensMay 20th 2006Essentials of JavaPerformance TuningDr Heinz Kabutz heinz@javaspecialists.co.zaKirk Pepperdine kirk@kodewerk.com52
Design Patterns Course 16 Backward Propagation of Trouble If hardware does not have enough capacity, people will see bad response times If JVM is incorrectly configured, people will see bad response times If application is suffering from contention, people will see bad response times Therefore, the only information you start with is that .