Transcription
MyLab Math educator study profiles instructor andstudent engagement in Elementary Algebra at DelawareTechnical Community CollegeSchool nameDelaware Technical Community CollegeTimeframeSpring 2017Course nameElementary AlgebraCourse formatHybrid: Lecture and labEducatorsKim Gregor, Instructor and DepartmentalChair, Wilmington campusKathy Vezmar, Instructor andDepartmental Chair, Owens campusCourse materialsMyLab Math in MyLabsPlus for Beginningand Intermediate Algebra by Martin-GayResults reported byJulianne Labbiento, Pearson CustomerOutcomes Analytics ManagerKey Findings On average, 77 percent of students who attempted chapter tests passed them. Chapter quizzes and corresponding chapter tests show strong and moderatelystrong correlations. Faculty using the MyLab dashboard are alerted to at-risk student behavior,motivating them to engage students just in time and help lead them to success.SettingDelaware Technical Community College (DTCC) is a statewide, multi-campus community college inDelaware that is committed to providing affordable, open admission, post-secondary education thatis relevant and responsive to labor market and community needs. The college offers comprehensiveeducational opportunities that contribute to the economic vitality of the state, including career,general, developmental, and transfer education; workforce development; and lifelong learning.DTCC is committed to fostering student success in higher education as a means to economic andpersonal advancement. According to a Fall 2015 report , DTCC had a total enrollment of over 13,000students, with 62 percent of students reporting as female, 56 percent as Caucasian, and 25 percentas African American. Approximately 65 percent of students attended part time.1
About the CourseThis study documents the implementations of MyLab Math in Elementary Algebra at two DTCCcampuses — the Wilmington campus and the Owens campus in Georgetown. T he ElementaryAlgebra course at DTCC is a four-credit, hybrid course offering a review of solving and graphinglinear equations and inequalities, as well as systems of linear equations and inequalities,polynomials, factoring, rational expressions, radical expressions, and quadratic equations as appliedto a variety of applications, including geometry. Core Course Performance Objectives (CCPOs)include:1.2.3.4.5.6.Solve linear equations and inequalities algebraically and graphically;Solve systems of linear equations and inequalities algebraically and graphically;Perform arithmetic operations on polynomial expressions;Apply factoring techniques to simplify rational expressions;Solve quadratic equations; andEvaluate functions graphically and algebraically.Students must demonstrate proficiency on all CCPOs at a minimal 75 percent level to successfullycomplete the course. In addition to the Martin-Gay text and MyLab Math access code, a basiccalculator is required.Challenges and GoalsKim Gregor and Kathy Vezmar are instructors and department chairs at the Wilmington and Owenscampuses of DTCC, respectively. Long time users of MyLab Math, they note that their developmentalcourses have undergone several major redesigns. Years ago, DTCC’s developmental math courseswere offered in a hybrid format. Results were fairly good, but the decision was made at theadministrative level to switch to an emporium format to further improve success rates. The newemporium model included no deadlines, unlimited attempts on assignments, and little instructorcontact in the classroom. While it did initially achieve its goal of increasing success, as continuedtweaks were made to the course to accommodate the wishes of all of the instructors on all of DTCC’scampuses, the courses became lengthy and cumbersome, with too many assignments andassessments for the timeframe in which it was to be delivered. The model also provided moreflexibility and freedom for the student, with students able to carry their unfinished work over to thefollowing semester and pick up where they left off. But often, students took advantage of that offer,not realizing that in doing so, they earned failing grades for the beginning semester. Faculty grewunhappy with the success rates and felt that it was time for a change.A return to redesignIt was at that point that faculty decided to return to a hybrid model for their Elementary Algebracourse, similar to what they had used in the past, but updated with some of the newer featuresavailable in MyLab. Kathy Vezmar says, “We had been using MyLab for over ten years, as both MyLabMath and in MyLabsPlus, but we were using the courses ‘the old way.’ MyLab had come along withcustomizable assignments and diagnostics, and we weren’t taking advantage of the power that theprogram now had.” With their new implementation, they hoped to keep students on track with duedates, increase instructor and student engagement, and ultimately increase pass rates onassessments within the course.2
“We had been using MyLab for over ten years, as both MyLab Math and inMyLabsPlus, but we were using the courses ‘the old way.’ MyLab had comealong with customizable assignments and diagnostics, and we weren’t takingadvantage of the power that the program now had.”—Kathy Vezmar, Delaware Technical Community CollegeImplementationThe faculty decided to start from ground zero. First, they assessed and reorganized all of thedevelopmental course objectives into a more natural and cohesive order, eliminating repetition andoverlap that may have slowed students down. Next, they chose a new textbook, with a voice moreclosely matched to the way they taught and the way their students learned. They built an associatedMyLab course that delivered what they wanted, in the order they wanted. F inally, they incorporateda system for identifying at-risk students using the MyLab dashboard.Students now attend classes that are half lecture and half lab. Some classes are held in computerclassrooms; other classes start in a traditional lecture room, then move to a computer lab. Gregorprefers the latter, saying that while the movement takes up a few minutes of time, she likes thatstudents are not distracted by the computers for the lecture. She says that her class days usuallybegin with a review of the previous homework, a 40-minute lecture, and perhaps a bit of review oran activity, such as a worksheet, time permitting. Once students are in front of their computers, theywork on MyLab homework, quizzes, or tests. While faculty have freedom to present the coursematerial as they wish, a coordinator course ensures consistency in MyLab.Students begin each new chapter with a proctored, password-protected chapter diagnostic inMyLab. This diagnostic, which is only taken once per chapter, does not count towards their grade,but does personalize their homework assignments for the chapter. Homework is assigned by sectionand students must earn at least 60 percent in order to advance to the next homework. They haveunlimited attempts with all learning aids turned on, and their final attempt is counted into theoverall score. Students, sharing their comments in a voluntary student survey, appreciated theunlimited attempts, with one student saying, “If I am struggling with a section, I can requestunlimited questions within that section to help prepare me.”Quizzes are proctored and password protected and cannot be taken until a student has earned atleast 75 percent on all section homework. Students have only one attempt on quizzes. Quizzes weredesigned to prepare students for the chapter tests. One student agreed, “The quizzes wereawesome! They were so challenging and prepared me very well for each test.”Proctored chapter tests are first given as pencil-and-paper tests. Students failing to earn at least 75percent on the test are directed to complete the C ompanion Study Plan (CSP) in MyLab. The CSP ispersonalized for the student based on quiz results from the chapter. Students needing to completethe CSP have unlimited attempts, with all learning aids turned on. It does not count towards theirgrade, but successful completion at 80 percent or higher allows the students to retake the chaptertest. The second attempt of the test is delivered in MyLab, rather than as paper and pencil. Somecampuses also give a paper-and-pencil final exam, which counts as a test.3
In addition to the lecture component, there have been several other changes from their emporiumimplementation. In DTCC’s current hybrid implementation, due dates have been added on allassignments. Gregor and Vezmar share that initially, there was resistance to due dates among bothfaculty and students, coming from a previous emporium implementation that had none, but thefaculty have grown to love them and feel they are critical and effective in moving students throughthe curriculum at the developmental level. Another change involves the final exam for the campusesthat require it. According to Gregor, past implementations have always dictated that studentscomplete the final exam, but now, students passing all assessments in no more than two attemptscan have their final exam waived.Finally, the biggest change is the use of two MyLab dashboards. The R eporting Dashboard , availablein all MyLab Math courses, provides a way to compile student data from multiple courses andsections and generate reports about overall student performance, performance on assignmentsincluding time spent, and even information about the objectives that have been mastered. DTCCsupplements this dashboard with an E arly Alerts & Interventions Dashboard with PredictiveAnalytics, an additional paid service that is programmed to the specifications of the institution. Thisdashboard identifies students who may be at risk of not passing the course, using predictiveanalytics based on historical data for the course, and alerts the faculty member so that they candetermine the best approach to get those students back on track . Vezmar says, “Sometimesdevelopmental students just disappear. We needed a way that would help us hang on to thesestudents. I think the dashboard helps us do that.” She notes, “The more we use the dashboard, themore we interact with our students, the better our students are doing.”Dashboard alerts are generated automatically to MyLab when a student registers an Incomplete onany assignment or when they fall below a score of 75 percent on a section homework, quiz,paper-and-pencil test, or MyLab test. Using the dashboard, instructors can see how many of theirstudents are predicted to pass and can then adjust the level, direction, type, and frequency ofinterventions with them accordingly. One student noted, “[The intervention] helped me a little tounderstand my situation,” while another said, “[The interventions] motivated us to keep getting ourwork done on time so we didn’t fall behind or have to retake the class again.” Gregor shares, “I lovethe dashboard! It records everything right in MyLab, it’s easy for instructors to use, and it gives usdata to go to our administrators at the college and show that we’re doing everything we can to helpour students. We wish we could have the dashboard in all of our classes!” Vezmar agrees, adding,“It’s changing the way we view the instructor interactions and students interactions. It give us adifferent visual that we haven’t had before.” She also notes that the interventions promote healthycompetition between faculty and campuses, as instructors become more motivated to engageat-risk students and lead them to success.“[The interventions] motivated us to keep getting our work done on time sowe didn’t fall behind or have to retake the class again.”—Student, Delaware Technical Community College4
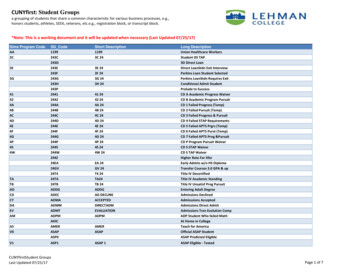
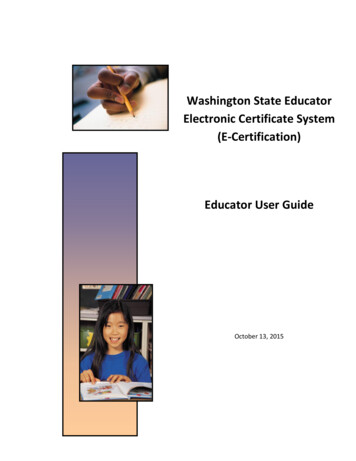
AssessmentsWhile each campus assigns homework, chapter quizzes, and chapter tests, not all campuses give afinal exam. The weights assigned to the assessments are as follows: 80%MyLab Math tests (including the final exam, if applicable)*10%MyLab Math homework5%MyLab Math quizzes5%Classroom activities*NOTE: First attempts on tests are given as paper and pencil; second attempts are deliveredin MyLab. Final exams are paper and pencil.In addition, all campuses are consistent in the requirement that students must demonstrateproficiency on all CCPOs at a minimum of 75 percent to successfully complete the course. Gradesare determined using the DTCC grading system: A 100 –92 B 91 –83 C 82 –75 F 74–0Results and DataCorrelations were used to examine the relationship between chapter quiz performance andcorresponding chapter test performance, beginning with Chapter 2. A correlation measuresthe strength of a relationship between two variables, where r is the correlation coefficient.The closer a positive r -value is to 1.0, the stronger the correlation. The correspondingp -value measures the statistical significance or strength of the correlation, where a p -value 0.001 shows the existence of a positive correlation between these two variables. Note thatcorrelation does not imply causation; it is simply a measure of the strength of therelationship. Positive correlations are considered moderately strong if they fall between 0.50and 0.59 and strong if they fall between 0.60 and 0.79.Figure 1 displays the strong correlations found for nearly all chapter quizzes and chaptertests, with only two exceptions — Chapter 6 and Chapter 9 — which had moderately strongcorrelations. Note that objectives from Chapters 10 and 11 were assessed together as asingle quiz and that only one chapter test was given covering material and objectives fromChapters 8–11.5
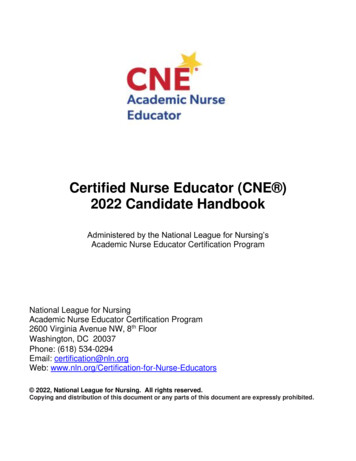
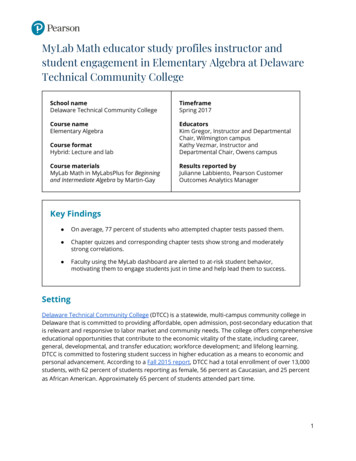
Correlation between chapter quiz and chapter test performance*Figure 1. Correlation between Chapter Quiz and Chapter Test Performance, by Chapter, for Spring 2017, p 0.001. (Chapter 2:n 294; Chapter 3: n 285; Chapter 4: n 239; Chapter 5: n 234; Chapter 6: n 218; Chapter 7: n 213; Chapter 8: n 158; Chapter9: n 156; Chapter 10: n 151)) *Content from Chapters 8–11 was assessed on a single test. Each correlation illustratedrepresents the correlation between performance on that test and performance on the individual chapter quiz.Student performance on chapter tests was also analyzed. The data show that, on average,approximately 9 percent of students did not take tests. For those students who did attempt chaptertests, 82 percent passed them. Figure 2 shows the percentage of students who passed or failed testsbased on the number of students attempting tests.Chapter test performanceFigure 2. Chapter Test Performance for Students Attempting Chapter Tests in Spring 2017 (Chapter 2: n 227; Chapter 3:n 223; Chapter 4: n 227; Chapter 5: n 222; Chapter 6: n 208; Chapter 7: n 202; Chapter 8–11: n 160)6
The Student ExperienceStudents in DTCC’s Elementary Algebra course were asked to complete a voluntary, end-of-semestersurvey (7 percent response rate) to share their perspectives on MyLab Math and instructorintervention and motivation strategies.When asked, “How has MyLab Math impacted your learning in this course?” student commentsincluded: “It gave me the tools I need outside of the classroom.”“[MyLab Math] allowed me to access my homework and study anywhere, anytime.”“I truly enjoyed the fact that I had plenty of opportunities for practice.”Student responses to the question, “How has MyLab Math benefited your learning in this course?”included: “I was able to focus on areas where I made mistakes.”“[MyLab Math] helped to fill in on areas I wasn’t sure of with the ‘View an Example’ and ‘Help MeSolve This’ features.”“It allowed me to see where I make mistakes so I can work harder on those areas.”Finally, when asked, “How did your instructor’s correspondence with you affect your motivation inthis course?” students responded: “She motivated me to do better.”“I wanted to give up in the beginning of the semester, and she encouraged me to continue. Afterthis class, I have overcome my fear and have a new outlook on math.”ConclusionThe department chairs and faculty at DTCC realized that, while the emporium format works at someinstitutions, it wasn’t working at their school. They set out to create a new course structure that useda textbook more closely aligned with their teaching style, added deadlines to keep their students ontrack to completion, took advantage of newer features in MyLab, and started actively using twoMyLab dashboards. The dashboard and the optional predictive analysis now allow faculty to engagewith their students more closely and lead them to greater success. Quiz-to-test correlations andchapter test success rates show that students are responding well to these changes. Kim Gregorsays, “We know that instructor engagement matters. When you can see the instructors who areengaging with students through the dashboard and the connection that makes to the studentresults, you can move from anecdotal evidence to black-and-white proof. We can see who is andwho isn’t putting in the effort.” Adds Vezmar, “Evidence that we can give to our administration,showing everything we did to save a student, helps tell our story.”7
MyLabsPlus, but we were using the courses 'the old way.' MyLab had come along with customizable assignments and diagnostics, and we weren't taking advantage of the power that the program now had." —Kathy Vezmar, Delaware Technical Community College Im p l e m e n tati o n The faculty decided to start from ground zero.