Transcription
EDI PRACTICES INBUSINESS SCHOOLSEDUCATING OUR FUTURE LEADERS2020
Executive SummaryGlobal Business Schools(MBA Program)EDI LeadershipEDI CommitteeMBA DemographicsEDI CoursesBLM StatementU15 Business Schools(MBA & BCom Programs)EDI LeadershipStudent DemographicsEDI CoursesRecommendationsAdditional Resources
EXECUTIVE SUMMARYThe renewed energy of the BLM movement and increasing awareness of anti-Asian sentimentlinked to COVID-19 over the course of 2020 focused a spotlight on Equity, Diversity, and Inclusion(EDI) in society broadly, but also specifically in workplaces. These broad societal movementsplaced unprecedented pressure and scrutiny on organizational leaders. For example, within weeksof the murder of George Floyd, over 15 high-profile corporate leaders stepped down over evidenceof racist behavior and their roles in fostering toxic corporate cultures. The failure of organizationsto appropriately respond to and lead on these critical societal events simultaneously increasedscrutiny on business schools as a key educator of current and future organizational leaders. At thesame time, students at world-class business schools in the US and Canada began leveraging socialmedia to detail on-campus discrimination and to advocate for systemic change.Unfortunately, we have little systematic knowledge of what business schools are already doing orhow they are assuming responsibility for broader societal EDI issues. Thus, the purpose of thisreport is to start a dialogue that addresses two questions:1. What are Business Schools doing to educate and develop students on EDI Topics2. What does representation look like in Business Schools?We accumulated a list of Global Business Schools by drawing on the most recent Top 50 MBAprogram rankings according to The Economist, the Financial Times, and QS as of June 2020. Thisresulted in a total of 76 Business Schools, 39 (51.3%) of which are based in the US. Data for theGlobal MBA Business Schools report was collected from the official website of each BusinessSchool between June 2020 and December 2020.In addition to Global MBA Business Schools data, we also collected MBA and Bachelor ofCommerce (BCom) data for the U15 – a group of Canadian Research Universities. Data for theseschools was collected between February and April of 2021.In addition to the primary questions being addressed in this report, we have includedrecommendations for what business schools can do to improve EDI education going forward aswell as a list of resources that have previously provided insight and guidance on EDI education. Wehope others find the information in this report useful and commit to advancing equity, diversity, andinclusion within their organizations.Best,Bonnie Cheng, SHRM-CP, BCom (2020), UBC Sauder,Alessandro Davidoni, BCom (2021), UBC SauderJiawei Li, PhD Student of OBHR, UBC SauderRebecca Paluch, PhD, Assistant Professor of OBHR, UBC SauderThe Economist: Full-time MBA Ranking 2019: ba/2019; FT: Global MBA Ranking 2019: al-mbaranking-2019; QS: Global MBA Rankings 2020: s/mba-rankings/global/2020
GLOBAL BUSINESS SCHOOLS(MBA Program)EDI LeadershipWe examined whether business schools committed significant resources to advancing EDI initiativesbased on whether they formed an EDI Committee and/or designated an EDI Leader. Dean and EDI Leader1EDI Leaders are senior business school leaders responsible for overseeing EDI strategy andexecution at the business school. Some leaders work exclusively on EDI efforts, while othershold additional professorships or administrative duties.100%EDI NOT in Leadership Role30.30%80%60%40%51%20%EDI in Leadership Role69.70%0%8%InternationalUSEDI ChampionFigure 1. Percentages of Schools with an EDI ChampionFigure 2. Percentages of Schools with an EDI Champion, byLocation30.3% of schools had an EDI Leader in the Dean’s office or equivalent2.8.1% (3/37) of Non-US schools had a recognized EDI leader, compared to over half (51.3%) ofUS schools3.Leaders who are socially representative of the groups they lead benefit from higher levels of trust,perceived competence, and effectiveness. They also influence schemas of leadership, therebybenefiting those who share similar social attributes within the leaders who are sociallyrepresentative of the groups they lead benefit from higher levels of trust, perceived competence,1 Methodology:Business School EDI Leader and Dean’s data was collected from each School’s website by searching for a page outlining the Dean’s Office, Senior Leadership, or Organizational Chartin the main navigation and footer. Each page was searched for “Diversity,” “Equity,” and “Inclusion.” The Dean’s observed gender and race were evaluated based on information provided on this pageor the individual’s profile page. If a biography included gender pronouns, we used the cited pronouns for the gender categorization. We acknowledge there are some limitations to our data collectionefforts, but we felt the benefits of collecting observed leader identity data would be informative for discerning trends for deans and EDI leaders. While gender should be conceptualized beyond thebinary, perceived targets were either male or female-passing; thus, we used these two categorizations to account for the privilege associated with identifying with either gender. To standardize the datacollection process, we considered race as White/Non-White. This method does not account for plurality. Four Schools did not have pages introducing Senior Leadership; in such cases, a search for astaff directory was conducted via the website’s search bar. None of these schools had an EDI Leader. Data was collected between June 2020 and December 2020. To mitigate the subjectivity ofperceived race and gender of targets, two undergraduate coders from different racial, cultural, and gender backgrounds made independent judgments and reviewed each others’ assignments.2 Only Leaders who appeared on Senior Leadership or Dean’s Office’s pages were recorded.3 All Non-US schools which had an EDI Leader were European.
and effectiveness. They also influence schemas of leadership, thereby benefiting those who sharesimilar social attributes within the the organization. As race and gender are dimensions of socialidentity which influence prototypicality, we examined the racial and gender diversity in theDean’s role as a starting point. We limited these analyses to Westernized locations where theleader prototype is historically a White Male4.Since prototypicality is determined by the perceiver, not by the target, we made a judgment on theperceived race and gender of a leader. In real-world contexts, unless a person readily disclosestheir gender and racial identity, the judgements, stereotypes, and privilege made and given byperceivers depends on the perceiver’s mental schemas and experiences.North %100%40%82.60%40%57.50%20%33.30%20%0%0%DeanEDI LeaderWhiteNon-WhiteDeanEDI LeaderWhiteNon-WhiteFigure 3. Percentages of of Prototypical White Male Deans vs EDI LeadersOverall, 2/3rds of Deans across North America and Europe were White Males. Within Europeanschools 82.6% (19/23) were White Male Deans compared to 57.5% (23/40) in North Americanschools.Notably, we found that of the 23 schools in Europe and North America which had an EDI leader,only one was a White male. There were no White male EDI leaders in North America.To build upon this starting point, future reports might also collect data on representation acrosssenior leadership and faculty/staff, to paint a more holistic picture of leader prototypicality andadvancement of underrepresented minorities.4 Forexamples of this research see (1) Rosette, Leonardelli & Phillips, 2008 and (2) Schein, 1973. While leader prototypes based on race are unavailable for Asian contexts, research suggests males arepreferred in these contexts as well (Schein, Mueller, Lituchy & Liu, 1996). In line with these findings, we find 90.9% (10/11) of the Deans in Asian locations were male.
EDI Committee5Business school EDI committees improve organizational effectiveness by centralizing efforts foradvancing equity, diversity, and inclusion. They are typically charged with managing resources,developing strategy, overseeing implementation, and serving as a unit of expertise6.38.2% of schools had an EDI committee at thebusiness school level. 8.1% (3/37) of Non-USschools had an EDI committee, compared to66.6% (26/39) of US Schools. This follows thetrend we saw for EDI course offerings, whereEDI seems to be more of a priority for Americanbusiness schools.Business School EDI Committee38.20%No EDI Committee61.80%Figure 4. Percentages of Schools with an EDI Committee29 of the 47 universities without a businessschool-level EDI committee had a university-wide EDI committee or task force. As these committees are not funded and organized at theuniversity-level, the business schools’ commitment can not easily be Business School EDI CommitteeFigure 5. Percentages of Schools with an EDI Committee, by LocationMBA Demographics7Representation in organizations has been a topic of growing importance, and business schools areoften viewed as a pipeline for the business world. We examined whether business schools dedicatedresources to tracking and publicizing student demographic data based on race and gender.5 Methodology:Business School EDI Committee data was collected from each School’s website by searching for a page outlining Equity, Diversity, and Inclusion (EDI) efforts in the main navigationand footer. If unsuccessful, individual queries for “Diversity,” “Equity,” and “Inclusion” were submitted via the website’s search bar. If no Committee could be found via the Business School’s website,we conducted a Google search for “Diversity” OR “Equity” OR “Inclusion” AND “Committee” AND “University Name” to record whether a university-wide EDI committee exists. Titles include:“Assistant Dean, Equity, Diversity and Inclusion” and “Chief Diversity, Equity, and Inclusion Officer.” Data was collected between June 2020 and December 2020. Two undergraduate coderscompleted this task. A random sample of 15 schools coded was cross-checked by each Coder to ensure accuracy.6 We reached out to all MBA program offices to confirm our findings; 40.8% of Schools responded.7 Methodology: MBA Class demographic data was collected from each School’s website by searching the MBA program page for “Class Profile.” We conducted the same queries on program brochures,if they were directly advertised on the program outline page. If queries were unsuccessful, we conducted a Google search for “Business School” AND “MBA” AND “Class Profile” OR“Demographics.” We noted Female Representation, US Students of Colour/Underrepresented Minorities, International Students, Nationalities, Average Class Size, and Class Year. Data was collectedbetween June 2020 and December 2020. Year of Cohort Data (Number of Schools): 2018 (1), 2018-2019 (1), 2019 (9), 2020 (15), 2021 (31), 2022 (1), Undated (14), No Demographics (4). Twoundergraduate coders completed this task.
Overall, only 5.3% of schools did not publish any form of gender, racial, or international studentstatus data. Gender diversity was the most commonly reported variable, with 93.4% of schoolsdisclosing this data.However, every school conceptualized gender as binary. It is unclear whether this is a limitation ofthe representation within MBA classes, disclosure options, and/or willingness of members to selfidentify and disclose.Non-US schools were less likely to report racial diversity, conceptualized as Students of Colour orUS Underrepresented Minorities8.Instead, these schools tended to report international student status and 0%Non-USFigure 6. Percentages of Schools Publicize Demographic Data (Female, SOC/URM,Internationals), by US vs Non-US SchoolsEvery US school reported gender and international student demographics; however, there wasvariance in the reporting of racial data. Five schools did not report any racial data, while eightschools reported US Underrepresented Minorities specifically, instead of general racial data. Schoolsalso varied in their definitions of “US Underrepresented Minorities,” illustrating the complexity andsubjectivity of racial categorizations.While we focused on race and gender due to their inherent relationships with power and status, someschools reported Class Profile data beyond our scope. For example, schools disclosed data onacademic and professional background, marital and parental status, sexual orientation, and veteranstatus. MBA Student Diversity9We explored diversity by examining representation of Female, Student of Colour (SOC), andInternational student in the publicized MBA student data. While diversity metrics should not bethe only aim of EDI initiatives, the efforts schools have made to increase representation among8 Theremay also be policy concerns. Interestingly, a representative from the Frankfurt School stated that they were not permitted to track racial data.MBA student diversity data was collected from each School’s website by searching the MBA program page for “Class Profile.” We conducted the same queries on program brochures, ifthey were directly advertised on the program outline page. If queries were unsuccessful, we conducted a Google search for “Business School” AND “MBA” AND “Class Profile” OR “Demographics.”We noted Female Representation, US Students of Colour/Underrepresented Minorities, International Students, Nationalities, Average Class Size, and Class Year. Data was collected between June 2020and December 2020. Two undergraduate coders completed this task.9 Methodology:
student classes may serve to enhance belongingness for underrepresented groups, and improvelabour market equity.SOC (US Only)100%80%60%40%20%0%Average37%25%8%USFigure 7. Student Representation, by RegionFor 2020/2021 cohort data, we found that Schools averaged 37.6% female representation. Again,Schools only reported on the gender binary. Surprisingly, representation among US andInternational schools was comparable, contrary to US school’s leading performance in Dean andEDI Leader representation10.Regarding Students of Colour, of the 19 US schools which tracked this metric for 2020/2021, theaverage was 24.0%.International student representation was the highest and most variable amongst Internationalschools, compared to the US. Non-US schools reported an average of 71.7% International studentrepresentation, with a maximum of 98.0% (University of Hong Kong), and a minimum of 0.9%(IIM Bangalore).EDI Courses11To examine how business schools are advancing Equity, Diversity, and Inclusion, we examinedwhether formal learning opportunities are provided through course offerings.Cross-Cultural Course9.20%EDI Course23.70%No EDI Course67.10%Figure 8. Percentages of Schools Offering an EDI Course1018 International and 27 US Schools (Total: 45/76) reported Female representation for 2020/2021.EDI Course data was collected from each School’s program outline page by conducting individual queries for “Diversity,” “Equity,” and “Inclusion.” We conducted the same querieson course catalogues and program brochures, if they were directly advertised on the program outline page. Examples of course titles include: Equitable and Inclusive Leadership, and Women in theWorkplace. If queries were returned as unsuccessful, we further searched for the terms “cross-” and “cross-cultural” to collect data on the Cross-Cultural Course variable. Examples of course titlesinclude: Cross-Cultural Management and Intercultural Team Building.11 Methodology:
To examine how business schools are advancing Equity, Diversity, and Inclusion, we examinedwhether formal learning opportunities are provided through course offerings.Only about ¼ (23.7%) of all global business schools offer an EDI course, which either broadlycovers equity, diversity, and inclusion in the workplace or specifically explores diversity in theworkplace through the lens of an underrepresented group.9.2% of schools did not offer an EDI course, but provided a course on cross-cultural management,which either explores how cultures differ along several dimensions, or specifically exploresmanaging the integration between a native and non-native culture(s) in the context of nationalUSOffer EDI CoursesFigure 9. Percentages of Schools Offering an EDI Course, by LocationBLM Statement12Following the murder of George Floyd in May 2020, some higher education institutions releasedstatements acknowledging the current social climate and their role in perpetuating 0.07%Washington DC:86.8%10.11%0.31%-5.58%0.24%-3.36%* Icons indicate the location of schools that published a BLM statement.Figure 10. BLM Statement and Democratic States12 Methodology:BLM statement data was collected from each School’s website by searching the home page for the terms “Black,” “BLM,” “rac,” (to account for possible variations and suffixes on theterm “race”) and “commit.” Banners, full statements, and statements which were linked on the home page were all recorded. Data was collected between June 2020 and December 2020. Twoundergraduate coders completed this task.
We examined whether business schools in the US dedicated resources to address these concerns.Only 48.7% of US schools released a statement on their website acknowledging the BLM movementand ongoing tensions.71% of Schools with both an EDI leader and EDI committee published a BLM statement, whereasonly 36% of schools without both an EDI leader and committee did the same.Overall, Schools which issued BLM statements were from more pro-Biden states (10.65% medianlead over Trump), compared to schools without BLM statements (0.47% median lead over Trump)1313Methodology: 2020 US Presidential Election results were obtained from: tentId doi:10.7910/DVN/42MVDX.Diverse voter preferences (beyond a two-party comparison) were obtained by computing % votes for each party (Democratic, Republican, Libertarian, Other) per state. % Pro-Biden Margin wascomputed by taking (% Biden Votes - % Trump Votes) for each state which had a ranked business school.
U15 Business Schools(MBA & BCom Programs)The U15 is a consortium of Canada’s fifteen most research-intensive universities. Collectively, theseuniversities aim to develop high-quality and sustainable higher education and research policy.Of the U15 universities, fourteen offer independent schools or faculties dedicated to business ormanagement and thus are focused on work and organizations. While the University of Waterloooffers a business program, it is subsumed within the Faculty of Engineering and does not haveindependent data or governance. As such, we chose not to include this school in our review.EDI LeadershipWe assessed a school’s commitment to EDI based on whether resources were dedicated to an EDIcommittee or an EDI leader.Table 1. Business Schools with EDI LeadershipEDI CommitteeEDI Leadership RoleAlberta School of Business - University of AlbertaAlberta School of Business - University of AlbertaAsper School of Business - University of ManitobaAsper School of Business - University of ManitobaDesautels Faculty of Management - McGill UniversityDesautels Faculty of Management - McGill UniversityEdwards School of Business - University of SaskatchewanEdwards School of Business - University of SaskatchewanFAS ULaval - Université LavalFAS ULaval - Université LavalHaskayne School of Business - University of CalgaryHaskayne School of Business - University of CalgaryHEC Montreal - Université de MontréalHEC Montreal - Université de MontréalRotman School of Management - University of TorontoRotman School of Management - University of TorontoRowe School of Business - Dalhousie UniversityRowe School of Business - Dalhousie UniversitySauder School of Business - University of British ColumbiaSauder School of Business - University of British ColumbiaSmith School of Business – Queen’s UniversitySmith School of Business – Queen’s UniversityTelfer School of Management - University of OttawaTelfer School of Management - University of OttawaIvey Business School - University of Western OntarioIvey Business School - University of Western Ontario* Bolded business schools have EDI Committee or EDI Leadership role.Our investigation revealed 5 schools had EDI committees. It is worth noting that 3 of these 5committees appear to have been assembled over the course of 2020 which may suggest they were areactionary response to local and societal events.
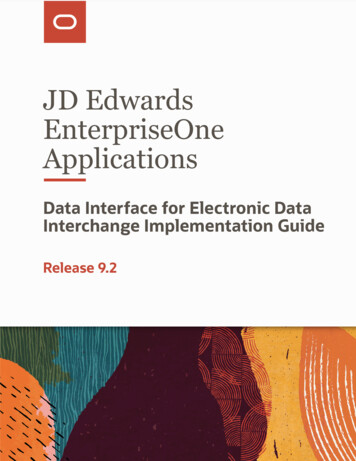
In addition, we found 3 schools have leadership roles solely dedicated to fostering diversity, equity,and inclusion. One school (Université de Montréal) listed EDI as one of various people managementresponsibilities assigned to that leadership role. Notably, all of these roles are assumed by women. Dean and EDI LeaderSimilar to the limitations noted in the GlobalBusiness School section, we had to makeassumptions about gender identity and race forbusiness school leaders. We acknowledge theselimitations and note our analyses are based onbystander observations.White Male Dean*10 out of 14 (71%) of Business School Deans match theprototypical leader of a White MaleFigure 11. Prototypical Dean (White Male) vsNon-Prototypical Dean in Business SchoolOf the 14 business school deans, 11/14 (79%) of theDeans were classified as male, and our observationssuggest that 13 of the 14 (93%) appear to be White.In comparison, the 4 leaders with EDI responsibilitieswere all women and 75% appeared to be White.Student DemographicsTable 2. Student Demographics for BCom and MBA ProgramsStudent DemographicsBComMBA% of Female (Median)No School Reported39%% of Students of ColorNo School ReportedNo School Reported% of International Students (Median)No School Reported32% BComBased on our review, no Bachelor of Commerce (BCom) programs publicly presentdemographics about their student body. We could find only 1 school that publicly posted dataabout international students. MBAFor MBA programs, 64% of the programs advertised the percentage of females or internationalstudents in their programs. NO programs posted information about racialized/underrepresentedstudents.
100%80%60%40%64%57%20%0%FemaleInternationalMBA DemographicsFigure 12. Percentage of U15 schools which Reported Female or International Demographic DataEDI CoursesFor BCom programs, our investigation revealed 7 out of the 14 schools offer at least one course onan EDI-related topic. Furthermore, 5 schools offered at least one course fully dedicated toIndigenous topics in the business context. MBA programs appeared to be less likely to offer courseson EDI topics. Only 3 MBA programs publicly listed courses that focused on EDI topics.Table 3. Business Schools with EDI CoursesBComMBAAlberta School of Business - University of AlbertaAlberta School of Business - University of AlbertaAsper School of Business - University of ManitobaAsper School of Business - University of ManitobaDesautels Faculty of Management - McGill UniversityDesautels Faculty of Management - McGill UniversityEdwards School of Business - University of SaskatchewanEdwards School of Business - University of SaskatchewanFAS ULaval - Université LavalFAS ULaval - Université LavalHaskayne School of Business - University of CalgaryHaskayne School of Business - University of CalgaryHEC Montreal - Université de MontréalHEC Montreal - Université de MontréalRotman School of Management - University of TorontoRotman School of Management - University of TorontoRowe School of Business - Dalhousie UniversityRowe School of Business - Dalhousie UniversitySauder School of Business - University of British ColumbiaSauder School of Business - University of British ColumbiaSmith School of Business – Queen’s UniversitySmith School of Business – Queen’s UniversityTelfer School of Management - University of OttawaTelfer School of Management - University of OttawaIvey Business School - University of Western OntarioIvey Business School - University of Western Ontario* This data was collected based on what was publicly posted about the program’s available courses.* Bolded business schools provide EDI courses in BCom and/or MBA programs.
RECOMMENDATIONSOur review provides new insight into what business schools are doing to educate and developcurrent and future leaders on managing equity, diversity, and inclusion in organizations. Yet, there isstill more work to be done. Below we provide recommendations for what business schools can do toadvance EDI education and development for organizational leaders going forward.1.Align: Define guiding principles, such as transparency, empathy, and change management bestpractices.2.Commit: Secure commitment from leadership to meaningfully invest financial andorganizational resources into EDI efforts.3.Define: Define “Equity, Diversity, and Inclusion” and an EDI mission for the organization,considering its market position, key stakeholders, and social context.Example: The Asper School of Business (University of Manitoba), operates in the city with thelargest Indigenous population in Canada. Its Indigenous Business Education Partners programsupports Indigenous Undergraduate and MBA students through providing resources and servicessuch as tutoring, scholarships and bursaries, arranged networking opportunities, and studentcommunity events.4.Assign: Centralize decision-making power through appointing an EDI Leader with legitimateand expert power. Appoint a Committee with a clearly defined mandate and diverserepresentation across all levels of the organization.Example: HEC has a streamlined organizational chart outlining EDI involvement, roles, andresponsibilities for organizational units ranging from the Board to a Task Force. Additionally,execution is governed by a Steering Committee, EDI Committee, and EDI Working Group, allwhich have their own mandates.5.Audit: Audit the entire organization using a stakeholder approach. Employ journey roadmapsand focus on the most marginalized within each stakeholder group to identify how EDI can bewoven throughout the entire experience, ensuring a holistic approach. Formal courses, programs,and policies should be evaluated, as well as the organizational climate and norms.6.Measure: Determine and track Key Performance Indicators (KPIs), paying particular attentionto equity and inclusion to ensure efforts are not centred on tokenization. While the Associationto Advance Collegiate Schools of Business (AACSB) recommends schools to collect diversitystatistics, it should facilitate industry-wide benchmarking by recommending specific metrics.For example, for diversity, schools may consider collecting socioeconomic statistics onapplicants, and evaluating the percentage of students enrolled from target schools. For inclusion,schools could annually survey students, faculty, and staff on their experience, cutting statisticsby relevant demographics. For equity, schools could assess the percentage of courses whichadhere to standardized assessment marking schemes.
7.Reward: Incentivize idea generation and reward behaviours which promote EDI. Ensure labourto advance EDI is recognized meaningfully, through both formal and informal organizationalrewards.8.Communicate: Be transparent with progress, and demonstrate how claims are backed up bywork.Example: Berkeley Haas leads with presenting a 5-year Strategic Plan and tracker, which isupdated regularly to reflect progress on defined initiatives and tactics.Example: MIT Sloan provides a comprehensive and publicly-available resource page, which isfrequently updated with relevant initiatives and publications.9.Iterate: Get started and be comfortable updating initiatives as more data and experience isobtained. Include discussions of where EDI activities did not go according to plan.10. Share: Connect with other institutions to share both best practices and key takeaways fromexperiences which did not go according to plan, to develop shared knowledge.
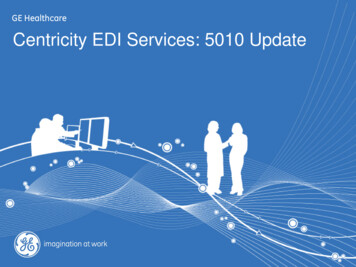
ADDITIONAL RESOURCESAcademic ResourcesAvery, D. R., & Thomas, K. M. (2004). Blending content and contact: The roles of diversitycurriculum and campus heterogeneity in fostering diversity management competency. Academy ofManagement Learning & Education, 3(4), 380-396.Bell, M. P., Connerley, M. L., & Cocchiara, F. K. (2009). The case for mandatory diversityeducation. Academy of Management Learning & Education, 8(4), 597-609.Kulik, C. T., & Roberson, L. (2008). Common goals and golden opportunities: Evaluations ofdiversity education in academic and organizational settings. Academy of Management Learning &Education, 7(3), 309-331.Ragins, B. R., & Ehrhardt, K. (2020). Gaining perspective: The impact of close cross-racefriendships on diversity training and education. Journal of Applied Psychology.Rosette, A. S., Leonardelli, G. J., & Phillips, K. W. (2008). The White standard: Racial bias in leadercategorization. Journal of Applied Psychology, 93(4), 758–777.Schein, Virginia. (1973). The Relationship Between Sex Role Stereotypes and RequisiteManagement Characteristics. The Journal of applied psychology. 57. 95-100.Zhang, M. M., Xia, J., Fan, D., & Zhu, J. C. (2016). Managing student diversity in businesseducation: Incorporating campus diversity into the curriculum to foster inclusion and academicsuccess of international students. Academy of Management Learning & Education, 15(2), 366-380.Practitioner ArticlesHow Business Schools Can Help Corporate America Fight Racism - https://hbr.o
No EDI Committee 61.80% Business School EDI Committee 38.20% 38.2% of schools had an EDI committee at the business school level. 8.1% (3/37) of Non-US schools had an EDI committee, compared to 66.6% (26/39) of US Schools. This follows the trend we saw for EDI course offerings, where EDI seems to be more of a priority for American business schools.