Transcription
METHODOLOGY REPORTOF THE 2021 NATIONALYOUTH TOBACCOSURVEYRecommended CitationOffice on Smoking and Health. 2021 National Youth Tobacco Survey: Methodology Report.Atlanta, GA: U.S. Department of Health and Human Services, Centers for Disease Control andPrevention, National Center for Chronic Disease Prevention and Health Promotion, Office onSmoking and Health, 2021.August 2021
For questions about this report, please email Sean Hu at fik4@cdc.govPrepared for Centers for Disease Control and PreventionPrepared by ICF, Rockville, MarylandCenters for Disease Control and PreventionOffice on Smoking and HealthAtlanta, GAAugust 2021
TABLE OF CONTENTSCHAPTER 1—NYTS SAMPLING DESIGN . 11.1 OVERVIEW OF THE NATIONAL YOUTH TOBACCO SURVEY (NYTS) . 11.2 OVERVIEW OF THE 2021 NYTS METHODOLOGY . 1CHAPTER 2—NYTS SAMPLING METHODS . 32.1 SAMPLE DESIGN . 32.2 SAMPLING FRAME . 42.3 SAMPLING UNITS AND MEASURE OF SIZE . 52.4 PROJECTED SAMPLE SIZES . 62.5 FORMING SAMPLING UNITS . 72.6 STRATIFICATION . 82.7 SAMPLE ALLOCATION AND SELECTION . 92.8 SAMPLE SIZES ATTAINED IN THE SURVEY . 102.9 SAMPLE VALIDATION . 12CHAPTER 3—NYTS DATA COLLECTION AND PROCESSING . 143.1 SURVEY INSTRUMENT . 143.2 EXTERNAL REVIEW AND APPROVALS . 153.3 TECHNICAL ASSISTANCE PROVIDER (TAPS) STAFFING . 153.4 RECRUITMENT PROCEDURES . 153.5 SURVEY ADMINISTRATION . 163.6 WEB-BASED DATA COLLECTION MANAGEMENT APPLICATION (DCMA) . 173.7 DATA RECORDING . 173.8 PARTICIPATION RATES . 173.9 DATA MANAGEMENT . 18CHAPTER 4—WEIGHTING OF NYTS RESPONSE DATA . 204.1 SAMPLING WEIGHTS . 204.2 NONRESPONSE ADJUSTMENTS . 234.3 POST-STRATIFICATION AND TRIMMING . 254.4 ESTIMATORS AND VARIANCE ESTIMATION . 29APPENDICESA. QUESTIONNAIREB. COMMON CORE OF DATA RACE AND ETHNICITY DEFINITIONSC. STUDENT WEIGHT DETAIL
CHAPTER 1—NYTS SAMPLING DESIGN1.1OVERVIEW OF THE NATIONAL YOUTH TOBACCO SURVEY (NYTS)The National Youth Tobacco Survey (NYTS) was developed to provide the data necessary tosupport the design, implementation, and evaluation of state and national tobacco prevention andcontrol programs (TCPs). 1,2 Tobacco product-related indicators included in the NYTS are: tobaccoproduct use (e.g., electronic cigarettes, cigarettes, cigars [including cigars, little cigars, andcigarillos], smokeless tobacco [chewing tobacco, snuff, or dip; snus, dissolvable tobaccoproducts], hookahs, pipe tobacco, bidis, roll-your-own cigarettes, heated tobacco products, andnicotine pouches); exposure to secondhand smoke and e-cigarette aerosol; smoking cessation;minors’ access to tobacco products; knowledge and attitudes about tobacco; and familiarity withpro-tobacco advertisements and anti-tobacco media messages. National estimates based on NYTSdata also serve as essential benchmarks against which TCPs can compare the extent of youthtobacco product use in their own states and communities. The NYTS provides multiple measuresand data for seven of the 18 tobacco-related Healthy People 2030 objectives (USDHHS, 2020):TU-4, TU-5, TU-6, TU-7, TU-8, TU-9, and TU-22.First conducted during the fall of 1999 and again during the springs of 2000, 2002, 2004, 2006,and 2009, then annually starting in 2011, the NYTS provides data that are representative of allmiddle school and high school students in the 50 states and the District of Columbia. Beginning in2011, the Centers for Disease Control and Prevention (CDC) and the Food and DrugAdministration (FDA) have collaborated to administer the NYTS.1.2OVERVIEW OF THE 2021 NYTS METHODOLOGYThe 2021 NYTS employed a stratified, three-stage cluster sample design to produce a nationallyrepresentative sample of middle school and high school students in the United States. Samplingprocedures were probabilistic and conducted without replacement at all stages and entailedselection of: 1) Primary Sampling Units (PSUs) (defined as a county, or a group of small counties,or part of a very large county) within each stratum; 2) Secondary Sampling Units (SSUs) (definedas schools or linked schools) within each selected PSU; and 3) students within each selectedschool.After being conducted via paper and pencil questionnaires since its inception in 1999, the NYTSbegan using electronic data collection methods starting in 2019. The 2019 and 2020 cycles wereconducted using a tablet-based administration with offline data collection in schools, supported bytrained survey administrators. Using this methodology during the 2020/2021 school year was notfeasible given state and local emergency COVID-19 protocols (e.g., distance and hybrid learningmodels, restricted visitor access). Instead, the 2021 NYTS was administered as a 100% onlinesurvey, supported virtually by trained technical assistance providers (TAPs). Students participatedin the survey while at school or at home during a designated class period as part of a classroom1Centers for Disease Control and Prevention. (CDC) (2014). Best Practices for comprehensive tobacco control programs-2014. Atlanta, GA: USDepartment of Health and Human Services, Public Health Service, CDC.2Centers for Disease Control and Prevention. Surveillance and Evaluation Data Resources for Comprehensive Tobacco Control Programs.Atlanta, GA: Centers for Disease Control and Prevention, National Center for Chronic Disease Prevention and Health Promotion, Office onSmoking and Health; 2014.1
activity. Using a school-issued or personal internet-connected device, students logged into a securewebsite and watched a brief 2-minute instructional video before completing the survey. Studentsor whole classes unable to participate during the designated class period were asked to take thesurvey at the next possible opportunity. Due to the changes in the methodology for the 2021administration, results of the 2021 NYTS cannot be compared with previous NYTS survey resultsthat were primarily conducted on school campuses.Participation in the NYTS was voluntary at both the school and student levels. At the student level,participation was anonymous. CDC’s Institutional Review Board (IRB) requires that parents begiven the opportunity to opt their student out of participating in the survey. Schools used eitherpassive or active permission forms at their discretion.Survey administration initiated on January 18, 2021 and concluded on May 21, 2021. The finalsample consisted of 508 schools, of which 279 participated, yielding a school participation rate of54.9%. A total of 20,413 student questionnaires were completed out of a sample of 25,149 students,yielding a student participation rate of 81.2%. The overall participation rate, defined as the productof the school-level and student-level participation rates, was 44.6%.A weighting factor was applied to each student record to adjust for nonresponse and for varyingprobabilities of selection. Weights were adjusted to ensure that the weighted proportions ofstudents in each grade matched national population proportions.The remainder of this report provides detailed information on the methodology used in the 2021NYTS sample selection (Chapter 2), data collection (Chapter 3), and weighting of student responsedata (Chapter 4).2
CHAPTER 2—NYTS SAMPLING METHODS2.1SAMPLE DESIGNThe objective of the NYTS sampling design was to support estimation of tobacco product-relatedknowledge, attitudes, and behaviors in a national population of public and private school studentsenrolled in grades 6 through 12 in the United States. More specifically, the study was designed toproduce national estimates at a 95% confidence level by school level (middle school and highschool), by grade (6, 7, 8, 9, 10, 11, and 12), by sex (male and female), and by race and ethnicity(non-Hispanic White, non-Hispanic Black, and Hispanic; Appendix B). Additional estimates alsowere supported for subgroups defined by grade, by sex, and by race and ethnicity, each withinschool level domain; however, precision levels varied according to differences in subpopulationsizes.The universe for the study consisted of all public and private school students enrolled in regularmiddle schools and high schools in grades 6 through 12 in the 50 U.S. states and the District ofColumbia. Alternative schools, special education schools, Department of Defense-operatedschools, Bureau of Indian Affairs schools, vocational schools that serve only pull-outpopulations, and students enrolled in regular schools unable to complete the questionnairewithout special assistance were excluded. The NYTS employed a repeat cross-sectional design.The sample was a stratified, three-stage cluster sample. Primary Sampling Units (PSUs) werestratified by racial/ethnic status and urban versus rural. PSUs were classified as "urban" if theywere in one of the 54 largest Metropolitan Statistical Areas (MSAs) in the United States; otherwise,they were classified as "non-urban." Within each stratum, PSUs, defined as a county, a portion ofa county, or a group of counties, were chosen without replacement. Table 2.1 presents keysampling design features.Table 2.1Key Sampling Design FeaturesSamplingStageSampling UnitsStratification1PSUs: Counties, portionsof a county, or groups ofcountiesUrban vs. Non-urban(2 strata);Minority concentration(8 strata)2Schools3Classes/studentsMeasure of Size(MOS)Designed Sample SizeAggregate schoolsize in targetgrades100 Counties, portions ofa county, or groups ofcountiesSmall, medium and large;Aggregate eligibleHigh school vs. middleenrollmentschool450 SSUs (school)selections: 320 largeschools, 80 mediumschools and 50 smallschools2 Classes per grade inhalf of large schools; 1class per grade otherwiseAcronyms: PSU Primary Sampling Unit; SSU Secondary Sampling UnitAs described in Section 1.2, the first stage of sampling selected PSUs within each stratum for atotal of 100 sample PSUs. At the second sampling stage, a total of 450 Secondary Sampling Units3
(SSUs), or schools, were selected from the sample PSUs, as follows: two large schools were selectedper sample PSU, one per level (middle or high); an additional large school for each level wasselected in a subsample of 60 PSUs, for a total of 320 large SSUs. An additional 80 medium SSUsand 50 small SSUs were selected from subsample PSUs, for a total of 450 sample SSUs (450 320 80 50). The PSU subsamples were selected with simple random sampling, and the schoolswere drawn with probability proportional to the total number of eligible students enrolled in aschool.Depending on the average design effects, target subgroup sample sizes are between 1,200 and1,700. The NYTS design has experienced lower design effects with less oversampling over thelast few cycles (due to proportional allocation and enrollment size measures). Compared toprevious cycles, the NYTS sampling design has had both lower effects on unequal weighting andsmaller clustering effects. These factors lead to lower design effects, particularly for subgroups.Smaller design effects have, in turn, led to smaller variances and improved precision.An appropriate sample size can enable generation of estimates with the required precision bygrade, as well as by sex and school level. Therefore, the precision requirements generally focusedon racial/ethnic subgroups within school level. The targets of n 700 students per racial and ethnicminority group by school level (1,400 total per group) correspond to prevalence estimates within /- 5% for confidence intervals at 95% confidence for all key racial and ethnic subgroups whenbroken down by school level.The prevalence estimates presented in Chapter 4 show that for all key racial and ethnic subgroups,prevalence estimates are within /- 5% for confidence intervals at 95% confidence (i.e., standarderrors are less than 2.5%). Standard errors are less than 2.5% for all estimates for Black andHispanic students at the middle school and high school level.2.2SAMPLING FRAMEAs in previous cycles, the 2021 NYTS sample was based on a comprehensive sampling framefrom multiple data sources to increase the coverage of schools nationally. The frame combineddata files obtained from MDR Inc. (Market Data Retrieval Inc.) and from the National Center forEducation Statistics (NCES). The MDR frame contained school information that includedenrollments, grades, race and ethnicity distributions within the school, district and countyinformation, and other contact information for public and non-public schools across the nation.The NCES frame sources included the Common Core of Data for public schools and the PrivateSchool Survey for non-public schools. This dual-source frame build method was piloted first in2014 to build the frame for the NYTS. 3 Including schools sourced from the two NCES filesresulted in substantial coverage increase among all public and non-public high schools. 4 Most ofthe added schools were smaller schools. Efforts were made to ensure that each school wasrepresented only once in the final sampling frame, even if the school showed up in both sourcefiles.3 Redesigning National School Surveys: Coverage and Stratification Improvement using Multiple Datasets. William Robb, KateFlint, Alice Roberts, Ronaldo Iachan, ICF International, FEDCASIC, March 20144 The coverage increase has ranged from 6.6% to 12.7% in recent sampling frames.4
Certain schools were removed from the frame prior to drawing the sample following a stepwiseprocess. The first step excluded non-eligible schools by category to remove schools such asDepartment of Defense schools, vocational schools, and adult education schools. This resulted inthe exclusion of 3.9% of schools (2.8% of public schools and 8.0% of private schools) and 1.1%of students. Lastly, schools were removed that had fewer than 40 students enrolled across eligiblegrades, resulting in the exclusion of 20.4% of schools (12.8% public and 42.6% private) whichhad been eligible after the other exclusions. This exclusion of schools with fewer than 40 studentsled to the exclusion of only 1.03% of students of those in eligible schools. 52.3SAMPLING UNITS AND MEASURE OF SIZEA three-stage cluster sample design was used to produce a nationally representative sample ofstudents in grades 6–12 who attend public and private schools. The first-stage sampling frameconsisted of PSUs made up of counties, groups of smaller, adjacent counties, or parts of largercounties. For the second stage of sampling, SSUs were defined as a physical school that can supplya full complement of students in grades 6 through 8 (middle school) or 9 through 12 (high school)or a school created by linking component physical schools together to provide all grades for thelevel.Schools were stratified into small, medium, and large schools based on their ability to support lessthan one, one or two class selections per grade. Small SSUs contained fewer than 28 students atany grade level, and large SSUs contained at least 56 students at each grade level. The remainingschools were classified as medium sized.The sampling stages may be summarized as follows: Selection of PSUs—One hundred PSUs (from approximately 1,257 PSUs) were selectedfrom 16 strata with probability proportional to the total number of eligible studentsenrolled in all eligible schools located within a PSU. Selection of schools—At the second sampling stage, a total of 320 large schools, or SSUs,were selected from the sample PSUs. Additionally, as described in Section 2.1, weselected 80 medium schools and 50 small schools, resulting in a total of 450 sample SSUs(450 320 80 50). Selection of students—Students were selected via whole classes whereby all studentsenrolled in any one selected class were chosen for participation. Classes were selectedfrom course schedules provided by each school so that all eligible students had only asingle chance of selection.The sampling approach utilized probability proportional to size (PPS) sampling methods with themeasure of size (MOS) defined as the count of final-stage sampling units, students in intactclassrooms. Coupled with the selection of a fixed number of units, the design resulted in an equalprobability of selection for all members of the universe (i.e., a self-weighting sample). These5Note that the two exclusions are additive so that 2.2% of students are excluded from the frame.5
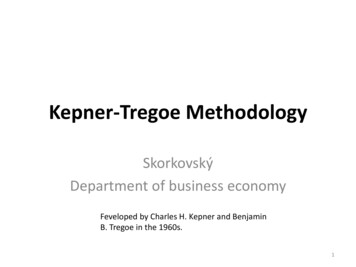
conditions were approximated for the NYTS resulting in the attainment of a roughly self-weightingsample.The MOS also was used to compute stratum sizes and PSU sizes. By assigning an aggregatemeasure of size to the PSU, the sample allocated to the PSU was in proportion to the studentpopulation.The third, and final, sampling stage selected classes within each grade of a sample SSU. Weselected two classes per grade in large schools and one class per grade in the remaining schools.The threshold for double class sampling was based on a simulation study to ensure that the requirednumbers of students in specified racial and ethnic minority groups were achieved per school level.All students in a selected class were then selected for the survey.PROJECTED SAMPLE SIZES2.4This section describes the planned sample sizes developed by the design, while Section 2.8discusses the sample sizes attained in the fielded survey. The NYTS sample size calculations werebased on the following assumptions: The main structure of the sampling design is consistent with the design used to draw thesample for prior cycles of the NYTS.The design included the selection of two large SSUs within each sample PSU, and anadditional 120 large, 80 medium and 50 small schools from subsample PSUs.Across 16 previous cycles of the NYTS that had concluded prior to the 2021 NYTS design, schoolparticipation had averaged 80.8% with a low of 49.9%. 6 Student participation had averaged 89.5%with a low of 85.9%. The combined response rate (student x school) averaged 72.4% with a low of43.6%. Historical participation rates at both school and student levels guided the sampling designand sample sizes. In calculating the sample sizes for the 2021 NYTS, we made our approach morerobust by assuming a conservative combined rate (student x school) of 42.5%, substantially lowerthan the historical overall response rate. The main reason is to account for higher levels of anticipatedschool refusals due to COVID-19 precautions in the 2020/2021 school environment. A secondaryreason is that the student participation rate needs to be adjusted to account for a growing number ofineligible students. The number of ineligible students needs to be subtracted from the net number ofstudents available for selection in participating schools. Table 2.2 presents a detailed derivation ofthe sample sizes planned for the 2021 NYTS based on these assumptions.6 Data collection during the 2020 NYTS was truncated due to school closures in response to COVID-19, resulting in lower schooland student response rates than historical averages.6
Table 2.2Planned Sample Sizes for the 2021 NYTSPSUSize# ofSSUs100(with 60PSUssubsampledto provideadditionallargeschools)Large HS16040(subsample)25(subsample)Large MSLarge TotalMedium HSMedium MSMediumTotalSmall HSSmall MSSmall TotalOverall Total160320404080252550450# ofClassesperSchool# Number ofSchoolsSampledDoubleclasses: 80Singleclasses: 80Doubleclasses: 80Singleclasses:80# of SampledStudentsprior toAttrition# ofParticipatingStudentsBased on42.5%Response 37553,3751,0637971,85922,684One-hundred PSUs were selected, with two large SSUs (“full” schools) selected from each PSUand one additional large SSU per level selected from 60 subsampled PSUs for a total of 320 largeSSUs. The estimated sample yield from these large schools was 42,000 students before school andstudent non-response, leading to an expected total 17,850 participating students in large schoolsafter accounting for non-response.To provide adequate coverage of students in small schools (those with an enrollment of less than28 students in any grade) 80 medium SSUs from a subsample of 40 PSUs, and 50 small SSUs froma subsample of 25 PSUs were selected. The expected yield was 7,000 from medium schools and4,375 students from small schools. In total, the expected number of participating students was22,684.Within each school, one class was selected from each grade to participate in the survey except inlarge schools with high racial and ethnic minority populations, where two classes per grade wereselected. Note that the set of schools with high racial and ethnic minority populations defined fordouble class sampling is necessarily a subset of the large schools that can support such doubleclass sampling. For the 2021 NYTS, we implemented double class selection for half of largeschools (randomly selected) to ensure sufficient student yields.2.5FORMING SAMPLING UNITS2.5.1Forming primary sampling units (PSUs)In defining PSUs, several issues were considered:7
Each PSU should be large enough to contain the requisite numbers of schools and studentsby grade, and small enough so as not to be selected with near certainty.Each PSU should be compact geographically to control the number of school districtscontacted and recruited.Recent data should be available to characterize each PSU.PSUs are defined to contain at least four middle and five high schools.Generally, counties were equivalent to PSUs, with two exceptions: Low population counties were combined to provide sufficient numbers of schools andstudents. High population counties were divided into multiple PSUs so that the resulting PSUs wouldnot be selected with certainty.The PSU frame was screened for PSUs that no longer met the above criteria. The frame wasadjusted by re-combining small counties/PSUs as necessary to ensure sufficient size whilemaintaining compactness. Near-certainty PSUs were split using an automated procedure built intothe sampling program.2.5.2Forming secondary sampling units (SSUs)Single schools represented their own SSU if they had students in each of grades 6 through 8 or ingrades 9 through 12. Schools that did not have all eligible grades for the level were groupedtogether to form an SSU. Linked schools were treated as single schools during sampling.2.6STRATIFICATIONThe PSUs were organized into 16 strata, based on urban/non-urban location and proportion racialand ethnic minority enrollment. If the percentage of Hispanic students in the PSU exceeded the percentage of non-HispanicBlack students, then the PSU was classified as Hispanic. Otherwise, it was classified asBlack.If the PSU was within one of the 54 largest MSAs in the United States, it was classified as“urban,” otherwise it was classified as non-urban (or “rural,” for simplicity).Hispanic urban and Hispanic rural PSUs were classified into four density groupingsdepending upon the percentages of Hispanic students in the PSU.Non-Hispanic Black urban and non-Hispanic Black rural PSUs were also classified intofour groupings depending upon the percentages of Black students in the PSU.The density grouping bounds were computed using an optimization algorithm 7 that is refreshedeach cycle to reflect changes in the racial/ethnic distribution of the student population. Theboundaries or cutoffs changed as the frequency distribution (“f”) for the racial and ethnic groupingschanged from one survey cycle to the next. Table 2.3 presents the stratum boundaries used in the2021 NYTS.7The cumulative square root of “f” method developed by Dalenius and Hodges.8
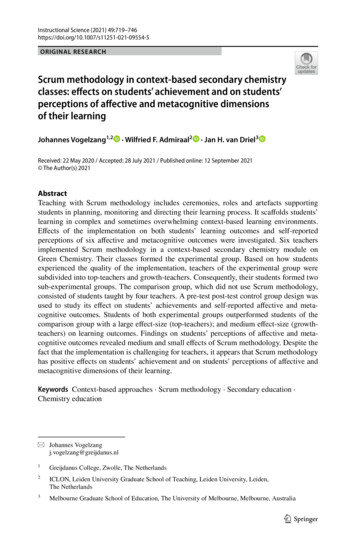
Table 2.3 Stratum Boundaries: Minority Percentage oup12341234BoundsUrban0%-26% 26%-40% 40%-54% 54%-100%0%-26% 26%-42% 42%-58% 58%-100%Rural0%-20% 20%-34% 34%-54% 54%-100%0%-24% 24%-48% 48%-68% 68%-100%As described earlier, SSUs were stratified into three sizes for small, medium, and large schools.2.7SAMPLE ALLOCATION AND SELECTIONThe 2021 NYTS was designed to select a sample of 100 PSUs. The PSUs were initially allocatedto strata proportional to student enrollment. For this cycle, a nearly proportional PSU allocationwas achieved, resulting in gains in sampling efficiency. Table 2.4 shows the actual allocation ofthe PSU sample to the 16 strata defined by racial and ethnic minority density and urban status,alongside a proportional allocation. The initial proportional allocation was slightly modified toensure that all strata contained at least two PSUs to facilitate accurate variance estimation.9
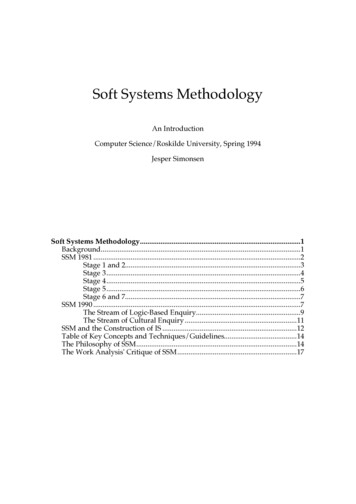
Table 2.4 First-Stage Strata and Frame PSU 5,0995,501,3711,903,271972,022815,139Number ofSamplePSUs(Revised)68357466865618543The sample was selected with PPS methods at the first and second stages. With PPS sampling, theselection probability for each PSU is proportional to the PSU’s measure of size. Systematicsampling procedures were applied to the stratified frame to select a PPS sample of PSUs:2.8 Selected 100 PSUs with a systematic random sampling within each stratum. The methodapplied within each stratum was a sampling interval computed as the sum of the measuresof size for the PSUs in the stratum, divided by the number of PSUs to be selected in thestratum. Subsampled PSUs for additional large schools (60 PSUs), medium schools (40 PSUs) andsmall schools (25 PSUs); sampling of two schools per level in each subsample PSU.SAMPLE SIZES ATTAINED IN THE SURVEYThe 2021 NYTS attained the target sample sizes in the key analytic subgroups of interest. Tables2.5a–d 8,show the number of participating students in subgroups defined by gender, grade, and raceand ethnicity. Table 2.5d about race and ethnicity distribution, is presented in two different ways:1) using the original variable allowing for multiple races and including missing data, and 2) using8Percents may not add to exactly 100% due to rounding.10
the variable whereby all respondents are categorized into a single race/ethnic group. The sampleled to 5,056 Hispanic students and 3,446 Black students using the single-race variable.Table 2.5aSubgroup Sample Sizes: Number of Participating StudentsWhat is your sex?Q2Not AnsweredNot 3Subgroup Sample Sizes: Number of Participating StudentsWhat grade are you in?CumulativeQ3FrequencyPercentFrequencyNot Answered710.3571Not 11th259512.711808412th228111.1720365Ungraded or other 00Table 375.8888.5999.76100.00
Table 2.5c Subgroup Sample Sizes: Number of Participating StudentsRECODE: Race/Eth - multiple groupRACE M Missing ltiple RacesTable oup Sample Sizes: Number of Participating StudentsRECODE: Race/Eth - no multiple Percent Missing 344616.881418169.47Hi
chapter 1 nyts sampling design 1 . 1.1 overview of the national youth tobacco survey \(nyts\) 1 . 1.2 overview of the 2021 nyts methodology 1 . chapter 2 nyts sampling methods 3 . 2.1 sample design 3 . 2.2 sampling frame 4 . 2.3 sampling units and measure of size 5 . 2.4 projected sample sizes 6 . 2.5 forming sampling units 7