Transcription
Vehicle-Related BenefitsProgramsA Report by WorldatWork,Underwritten by Runzheimer InternationalAugust 2015
About WorldatWork – The Total Rewards AssociationWorldatWork (www.worldatwork.org) is a nonprofit human resources association forprofessionals and organizations focused on compensation, benefits, work-life effectiveness and total rewards – strategies to attract, motivate and retain an engaged andproductive workforce. WorldatWork and its affiliates provide comprehensive education,certification, research, advocacy and community, enhancing careers of professionalsand, ultimately, achieving better results for the organizations they serve. WorldatWorkhas more than 65,000 members and subscribers worldwide; 80 percent of Fortune 500companies employ a WorldatWork member. Founded in 1955, WorldatWork is affiliatedwith more than 70 local human resources associations and has offices in Scottsdale,Ariz., and Washington, D.C.Contact:WorldatWork Customer Relations14040 N. Northsight Blvd.Scottsdale, Arizona USA85260-3601Toll free: 877-951-9191Fax atWork Society of Certified Professionals is the certifying body for six prestigious designations: the Certified Compensation Professional (CCP ), Certified BenefitsProfessional (CBP), Global Remuneration Professional (GRP ), Work-Life CertifiedProfessional (WLCP ), Certified Sales Compensation Professional (CSCP) andCertified Executive Compensation Professional (CECP) .The WorldatWork group of registered marks also includes: Alliance for Work-LifeProgress or AWLP, workspan and WorldatWork Journal.About Runzheimer InternationalFounded in 1933, Runzheimer International provides expertise, technology and worldclass service that empowers companies to better manage cost, business risk andemployee satisfaction in the mobile workplace. As a global leader in workforce mobilityprograms, the company is recognized for providing innovative solutions for businessvehicles, business travel expense management and employee relocation. Runzheimeris highly renowned and recognized for its industry leading, Customer Care/ServiceDelivery focus, an integral element of the company’s corporate culture.The company is privately owned. To learn more about Runzheimer International, visithttp://runzheimer.com. 2014 WorldatWork Any laws, regulations or other legal requirements noted in this publication are, to the best of the publisher’s knowledge, accurate and currentas of this report’s publishing date. WorldatWork is providing this information with the understanding that WorldatWork is not engaged, directly or by implication, inrendering legal, accounting or other related professional services. You are urged to consult with an attorney, accountant or other qualified professional concerningyour own specific situation and any questions that you may have related to that.No portion of this publication may be reproduced in any form without express written permission from WorldatWork.
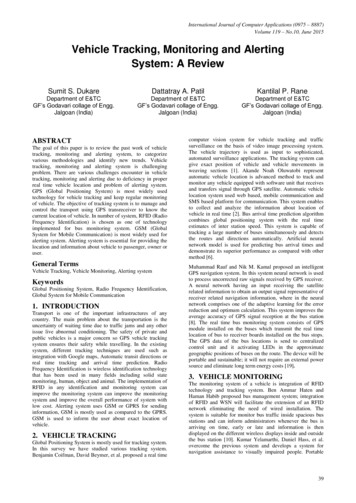
Introduction & MethodologyThis report summarizes the results of a June 2015 survey of WorldatWork members to gather information aboutcurrent trends in vehicle-related benefits programs. This survey is designed to better understand the prevalenceand perceptions of vehicle-related benefits programs within organizations.On June 17, 2015, survey invitations were sent electronically to 5,089 WorldatWork members. Respondentsselected for participation were members who specified total rewards as their specific function area along withrandomly selected members who had designated a responsibility level of executive, top or senior levelresponsibility area. The survey closed on July 10, 2015, with 420 responses, an 8% response rate. The dataset wascleaned, resulting in a final dataset of 416 responses.In order to provide the most accurate data possible, data was cleaned and analyzed using statistical software. Anyduplicate records were removed. Data comparisons with any relevant, statistically significant differences arenoted within this report.The demographics of the survey sample and the respondents are similar to the WorldatWork membership as awhole. The typical WorldatWork member works at the managerial level or higher in the headquarters of a largecompany in North America.The frequencies or response distributions listed in the report show the number of times or percentage of times avalue appears in a data set. Due to rounding, frequencies of data responses provided in this survey may not totalexactly 100%.WorldatWork conducted similar employee recognition program surveys in 2011 and 2008. These reports can beviewed on the WorldatWork website. Where possible, historical comparisons from data gathered in the previoussurvey are shown.Trends in Workplace FlexibilityWorldatWork1
Table of FiguresDemographicsFigure 1: Sector .3Figure 2: Organization size .3Figure 3: Industry .4Figure 4: Voluntary turnover.4Vehicle-Related Benefits ProgramsFigure 5: Prevalence of vehicle-related benefits programs .7Figure 5a: Region and vehicle-related benefits programs .7Figure 6: Elimination of vehicle-related benefits programs .8Types of Programs OfferedFigure 7: Types of vehicle-related benefits programs offered .8Figure 8: Number of vehicle-related benefits programs offered .9Figure 9: Vehicle-related benefits options .9Program Eligibility and Allowance AmountFigure 10: Groups eligible for vehicle-related benefits. 10Figure 11: Vehicle-related benefit difference compensation . 11Figure 12: Vehicle-related benefit monthly allowance amount . 11Program Administration and CommunicationFigure 13: Impact of fuel costs and vehicle-related benefits. 12Figure 14: Perceived effects of vehicle-related benefits programs on the workforce . 12Figure 15: Vehicle-related benefits programs and the use in attraction . 13Additional Analysis – Top Three ProgramsFigure 16: Top three programs, by organization type . 14Figure 17: Top three programs, by organization size . 14Figure 18: Top three programs, by voluntary turnover . 14Figure 19: Top three programs, by industry . 14Trends in Workplace FlexibilityWorldatWork2
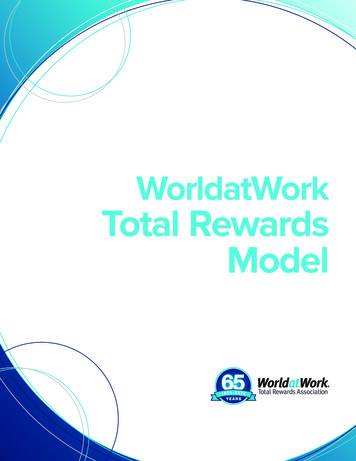
DemographicsFigure 1:“Your organization is:” (n 391)Nonprofit/notfor-profit orpublic sector12%Private sector,publicly traded(stock ticker)53%Private sector,privately held35%Figure 2:“Please choose the total number of full-time employees (FTEs) your organization employsworldwide:” (n 389)OptionPercentageFewer than 100 employees5%100 to 49910%500 to 99911%1,000 to 2,49915%2,500 to 4,99914%5,000 to 9,99913%10,000 to 19,99911%20,000 to 39,9998%40,000 to 99,9998%100,000 or more employees6%Trends in Workplace FlexibilityWorldatWork3
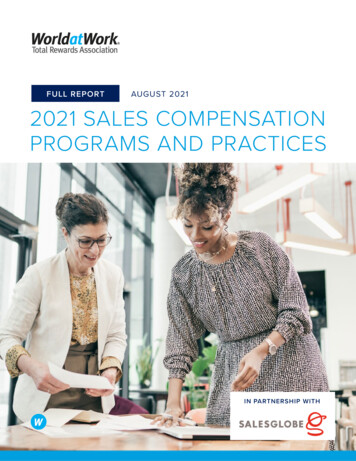
Figure 3:“Please choose one category that best describes the industry in which your organizationoperates:” (n 385)Industries with less than 2% are not listed in this table.OptionPercentageAll Other Manufacturing19%Finance and Insurance10%Consulting, Professional, Scientific and Technical Services8%Utilities, Oil and Gas7%Health Care and Social Assistance5%Pharmaceuticals5%Information (includes Publishing, IT, etc.)4%Retail Trade4%Accommodations & Food Services3%Construction3%Transportation3%Computer and Electronic Manufacturing2%Educational Services2%Wholesale Trade2%Other16%Figure 4:“What is the approximate annual voluntary turnover for employees?” (n 376)39%24%21%6%0%-5%Trends in Workplace %41% or moreWorldatWork4
Executive SummaryThe majority of organizations (89%) continue to offer at least one vehicle-related benefit to employees. This hasremained unchanged since 2011. Of these organizations, 61% offer a minimum of three vehicle benefit programsto their workforce. Fuel or mileage reimbursement, automobile allowance and provided company-owned cars(including leases) are the most common programs offered.While vehicle allowance has increased to 69% since 2011, the overall allowance has decreased significantly from76% in 2008. With the economic recovery, automobile allowance may be back on the upswing following theprevious decline. The impact of fuel costs on organization’s vehicle benefit programming continues to beconsiderably less in 2015 compared to 2011 and 2008. In 2015, 81% of organizations reported they are notconsidering changes to their programs in response to fuel cost and only 4% have reported implementing changesthat are less generous to employees.Vehicle-Related Benefits Programs Nearly 9 out of 10 (89%) organizations offer a car allowance, company car, fuel reimbursement or othervehicle benefit to at least some of their workforce. (See Figure 5.) This has stayed the same as findingsfrom 2011.Combination of Vehicle-Related BenefitsVehicle-related benefits programs were mostProgramsprevalent in the United States (74%), followed byCar allowance and fuel or mileage10%reimbursementCanada (24%), Western Europe (21%) and UnitedCompany car, car allowance and fuel or10%Kingdom (20%). (See Figure 5a.) While domesticmileage reimbursementprograms remain stable, international vehicleCar allowance only8%benefits programs have slightly increased sinceAll other combinations combined73%2011.For those organizations without a current vehicle benefit program, 23% stated they had eliminated theirprogram in the past three years. This trend continues to grow, up 5 percentage points from 2011. (SeeFigure 6.)Types of Programs Offered The most common vehicle-related benefits were fuel or mileage reimbursement (70%) and vehicleallowance (69%). Vehicle allowance has increased by 4 percentage points since 2011, while fuel ormileage reimbursement has dropped 2 percentage points. Gaining popularity is the benefit of a companyowned automobile, including lease vehicles; an increase of 7 percentage points. (See Figure 7.) More than two-thirds of organizations (69%) do not allow eligible employees to choose among vehiclebenefit options, such as vehicle allowance and/or a company car. 11% of organizations offer options to alleligible employees, while another 11% only allow executives to have choices. (See Figure 9.)Trends in Workplace FlexibilityWorldatWork5
Program Eligibility and Allowance Amount Similar to findings in 2008 and 2011, in 2015, the eligibility for a car allowance (75%) and a providedcompany car (66%) is concentrated among executives. Fuel or mileage reimbursement is widely eligibleamong sales employees (49%) and employees with a bona-fide business need (69%). (See Figure 10.) 84% of organizations do not allow eligible employees to receive the difference as cash compensation forchoosing a vehicle that is below the allowance limit. (See Figure 11.) In2015, similar to findings in 2011, the most prevalent car allowances provided for all employee levelswas from 500 to 999. (See Figure 12.)Program Administration and Communication Fuel costs have not impacted any changes to vehicle-related benefit programs among 81% oforganizations. However, 11% of organizations are considering changes to make the program lessgenerous to employees, an increase of 4 percentage points since 2011. (See Figure 13.) In 2015, with the exception of employee satisfaction, vehicle-related benefits programs appear to have aneutral effect on the workforce in terms of engagement and motivation, 53% and 58%, respectively.However, vehicle benefit programs are believed to have a greater positive effect on employee satisfaction(64%). (See Figure 14.) Two-thirds of organizations (66%) are always or sometimes marketing their vehicle benefit programs as akey employee benefit to attract new employees. This has positively shifted 6 percentage points since2011. (See Figure 15.)Additional Analysis – Top Three Programs Over 70% of nonprofit/not-for-profit or public sector organizations offer fuel or mileage reimbursementand/or a vehicle allowance program. (See Figure 16.) Greater than half of small organizations, with 101 to 999 employees, offer a company owned vehicle.More than 80% of mid-sized organizations (1,000 to 4,999) offer a vehicle allowance program toemployees. (See Figure 17.) 71% of organizations providing a company owned automobile, including lease vehicles, reported lowvoluntary turnover (0% to 5%). (See Figure 18.) Nearly three quarters of organizations within the utilities, oil and gas industry offer employees a vehicleallowance program. 79% of organizations in all other manufacturing offer employees an automobileprovided by the company, which is statistically significantly greater than employers in the finance andinsurance industry. (See Figure 19.)Trends in Workplace FlexibilityWorldatWork6
Results and AnalysisVehicle-Related Benefits ProgramsFigure 5:“Does your organization currently offer at least one vehicle-related benefit (e.g., carallowance, company car, fuel reimbursement, etc.) to any employee or group of employees?” 12015 (n 416)Yes, 89%No, 11%2011 (n 466)Yes, 89%No, 11%2008 (n 551)Figure 5a:Yes, 75%No, 25%“When considering the vehicle-related benefits program that applies to the greatest numberof employees at your organization, please specify to which regions and countries thisprogram applies. (Check all that apply.)” (n 364)United States74%Canada24%Western Europe21%United Kingdom20%Asia-Pacific15%Eastern Europe10%China10%Caribbean/Latin America10%Australia/New Zealand10%India7%Middle East6%Africa6%1 In 2008, the question was limited in scope and did not request information on other vehicle-related benefits programs (e.g., use of fleetvehicles, fuel reimbursement, insurance and maintenance subsidies).Trends in Workplace FlexibilityWorldatWork7
Figure 6:“Have you eliminated the entire vehicle-related benefit program within the past threeyears?”Only participants answering “No” in Figure 5 received this question.2015 (n 44)2011 (n 49)Yes, 23%Yes, 18%2008 (n 118) Yes, 11%No, 77%No, 82%No, 89%Types of Programs OfferedFigure 7:“Please indicate the type of vehicle-related benefit program(s) that your organizationcurrently offers. (Please check all that apply.)”Only participants answering “Yes” in Figure 5 received this question.20082011201541639436074%72%70%76%65% 269%n/a 453%60%n/a20%27%40%29%24% 5Parking allowance/reimbursementn/an/a24%Eligible employees are reimbursed for a vehicle purchase (employee owns)5%6%9%Fuel or mileage subsidy or discounted fuel5%5%8%Other program11%3%4%n Fuel or mileage reimbursementVehicle allowanceAutomobile provided, including lease vehicles (companyowned) 3Reimburses, pays or provides cash for insurance, maintenance and/or fuelEligible employees may use a vehicle from the company’s fleet2A statistically significantly smaller percentage of organizations reported offering vehicle allowance in 2011 (65%) than 2008 (76%).In 2015, the survey response- “Automobile provided, including lease vehicles (company owns),” included lease vehicles.4 In 2008, the survey question did not distinguish between company car (owned) and car allowance so no information was available forcomparison to company-owned vehicles.5 A statistically significantly smaller percentage of organizations are reporting eligible employees may use a vehicle from the company’sfleet in 2015 (24%) than 2008 (40%).3Trends in Workplace FlexibilityWorldatWork8
Figure 8:Numbers of Vehicle-Related Benefits Programs Offered (n 360)30%24%17%15%10%3%1 Figure 9:231%0%0%789456Number of ProgramsMean: 2.9Median: 3.0Mode: 3.0“Does your organization allow eligible employees to choose between vehicle allowanceand/or a company car and/or other options?”Only participants answering “Yes” in Figure 5 received this , all eligible employees have choices16%9%11%Some employees have choices, other do not10%6%5%Other2%8%5%Sales and other eligible have choicesn/a3%2%n No, employees eligible for this type of benefit have only one optionExecutives have choicesOther responses as noted by participants: At director level and higher Choices are country specificTrends in Workplace FlexibilityWorldatWork9
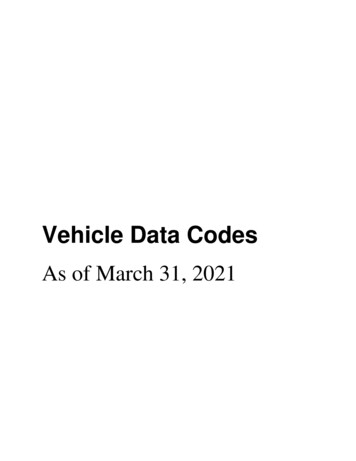
Program Eligibility and Allowance AmountFigure 10:“Please specify which groups are eligible for each vehicle-related benefit: (Select all thatapply.)” 6Only participants answering “Yes” in Figure 5 received this question.Automobile provided,including leasevehicles (companyowns) (n 207)Eligible employee arereimbursed for avehicle purchase(employee owns)(n 25)Vehicle allowance(n 239)Fuel or mileagereimbursement(n 239)Fuel or mileagesubsidy or discountedfuel (n 18)Eligible employeesmay use a vehiclefrom the company’sfleet (n 80)Reimburses, pays orprovides cash forinsurance,maintenance and/orfuel (n 91)Parking allowance/reimbursement (n 80)Other program (n 10)6ExecutivesOutsidesalesemployeesAnyemployeewith abona-fidebusinessneedExpatriatesdependingon thecountry 70%50%20%30%30%40%30%Count for some groups are less than 30; data corresponding to larger sample sizes will have stronger statistical power and validity.Trends in Workplace FlexibilityWorldatWork10
Figure 11:“If an employee chooses a vehicle that is below the allowance limit, is the employee eligibleto receive the difference as cash compensation?”Only participants answering “Automobile provided” in Figure 5 received this question. Notapplicable responses were excluded from analysis.2015 (n 150)Yes, 16%No, 84%2011 (n 118) Yes, 12%Figure 12:No, 88%“Please specify the monthly allowance by position for your vehicle allowance program.”Only participants answering “Yes” in Figure 5 received this question. 1- 499 500- 999 1,000 1,499 1,500 1,999 2,000 rs (n 71)30%58%6%6%1%Directors (n 98)Outside sales employees(n 101)Any employee with a bonafide business need (n 60)Expatriates depending on thecountry of operations (n 36)Field technicians/employees(n 35)Other (n 3%29%63%9%0%0%29%63%9%0%0%Executives: Level I (highestlevel) (n 176)Executives: Level II (midlevel) (n 155)Executives: Level III (n 123)Trends in Workplace FlexibilityWorldatWork11
Program Administration and CommunicationFigure 13:“Have fuel costs caused your organization to either consider or actually make changes toyour vehicle-related benefit program?”Only participants answering “Yes” in Figure 5 received this question.200820112015412387347We are not considering any changes at this time3%79% 781% 8We are considering changes to make the program less generous to employees10%7%11%We are considering changes to make the program more generous to employees8%4%3%We have implemented changes that make the program less generous to employees68%6% 94% 10We have implemented changes that make the program more generous to employees10%4%2%n Figure 14:“What would your workforce say is the effect of your organization’s vehicle-related benefitprogram on:”Only participants answering “Yes” in Figure 5 received this question.Employee engagement (n positive/positiveeffect45%No effect/neutralEmployee motivation (n 341)2%58%40%Employee satisfaction (n 344)4%33%64%7 In 2011, a statistically significantly greater percentage of organizations were not considering any changes to their vehicle benefit program(79%) compared to 2008 (3%).8 In 2015, a statistically significantly greater percentage of organizations were not considering any changes to their vehicle benefit program(81%) compared to 2008 (3%).9 A statistically significantly smaller percentage of organizations are reporting implemented changes to their vehicle benefit program thatare less generous to employees (6%) compared to 2008 (68%).10 A statistically significantly smaller percentage of organizations are reporting implemented changes to their vehicle benefit program thatare less generous to employees (4%) compared to 2008 (68%).Trends in Workplace FlexibilityWorldatWork12
Figure 15:“Does your organization feature or market the vehicle-related benefit program as a keyemployee benefit when attempting to attract new employees?”Only participants answering “Yes” in Figure 5 received this question.2015 (n 346)2011 (n 380)Trends in Workplace FlexibilityYes, 25%Yes, 20%Sometimes,but not always,41%Sometimes,but not always,34%No, 35%No, 46%WorldatWork13
Additional Analysis – Top Three ProgramsFigure 16:Top three programs, by organization typen Private sector,publicly traded(stock ticker)188115Nonprofit/notfor-profit orpublic sector34Private sector,privately heldFuel or mileage reimbursement70%77%71%Vehicle allowanceAutomobile provided, including leasevehicles (company owns)71%69%71%67%59%38%Figure 17:Top three programs, by organization size (number of employees)n Small OrganizationsFewer101 tothan 1009991270Mid-sized1,000 to 4,99999Large Organizations5,000 to20,00019,9998371Fuel or mileage reimbursement75%73%74%72%70%Vehicle allowanceAutomobile provided, includinglease vehicles (company owns)25%63%82%71%68%42%60%48%75%70%Figure 18:Top three programs, by voluntary turnover0% to 5%(Low)626% to 10%(Medium)12711% to 15%(High)134Fuel or mileage reimbursement71%72%74%Vehicle allowanceAutomobile provided, including leasevehicles (company owns)58%74%71%71%63%58%All OtherManufacturing67Finance andInsurance35Utilities, Oiland Gas26Fuel or mileage reimbursement78%69%81%Vehicle allowanceAutomobile provided, including leasevehicles (company owns)64%60%73%79% 1151%62%n Figure 19:Top three programs, by industryn 11 Organizations in the all other manufacturing industry are statistically significantly more likely to offer employees an automobileprovided by the company (79%) than organizations in the financial and insurance industry (51%).Trends in Workplace FlexibilityWorldatWork14
Participating OrganizationsAAMABMAccent Care Inc.ACCO BrandsAdvocate Health CareAECOMAGCO CorporationAgnico Eagle Mines LimitedAir CanadaAlbea GroupAlghanim IndustriesAllied Building Stores Inc.Allied Motion TechnologiesAMC Networks InternationalAmerican Association of Community CollegesAmplifon AmericasAmyris Inc.ANSYS Inc.Apogee Enterprises Inc.ARAMARKArkansas Electric Cooperative Corp.Armstrong World IndustriesAscend Performance MaterialsAstron SolutionsAurora Health CareAutomatic Data ProcessingAvera HealthAvivaBalfour Beatty Construction USBaxter Corp.BAYERBaystate HealthBBA AviationBeazer HomesBell CanadaBig LotsBlack Knight Financial ServicesBLC Partners LLCBlue Cross Blue Shield of ArizonaBlue Cross Blue Shield of MassachusettsBlue Diamond GrowersBoart LongyearBRP Inc.CAA SCOCalifornia Casualty Management CompanyCapital One UKCardinal HealthCarillion Canada Inc.Carters' Inc.Catholic Health InitiativesCelina Insurance GroupCenterra Gold Inc.Trends in Workplace FlexibilityCGIChico's FAS Inc.Chiesi USA Inc.Chipotle Mexican GrillChryslerCiena Corp.CIRCOR InternationalCity of Columbia, MissouriCity of Raleigh (NC) Municipal GovernmentCoast Electric Power AssociationColorado PERACommScopeCommunity Coffee Company LLCCompass Group CanadaConstellation Brands Inc.Cox Media GroupCSA GroupCSG InternationalDaiichi SankyoDaymon WorldwideDCIDDR Corp.Dean FoodsDelta Air LinesDriscoll’sDSMDSM Nutritional ProductsDuPontEagle Ottawa LLCEclipse ResourcesEmpire LifeEmployers Resource AssociationENMAXErie Insurance GroupeSOURCESEstee LauderEVRAZ NAExperianFANUC America Corp.Federal Housing Finance AgencyFederal-Mogul Motorparts SEU BUFellowes BrandsFerring Pharmaceuticals Inc.Finning International Inc.First Capital Realty Inc.Fiskars Brands Inc.Fletcher BuildingFonterraFrank's InternationalFreudenberg North AmericaFujirebio Diagnostics Inc.GannettWorldatWork15
General MotorsGilead Sciences Inc.Glazer'sGrady Management Inc.Grange Mutual Casualty Co.Hancock Holding Co.HARMANHegele LogisticHemophilia of GeorgiaHill HollidayHiltonHMSHost CorporationHollardHomesite InsuranceHonda of South CarolinaHorizon Pharma PLCHumInt LLCICLIllinois Credit Union SystemINOAC USA Inc.Intact Financial Corp.J.D. Irving LimitedJack in the Box Inc.JE Dunn Construction Co.Johnson ControlsKey Energy ServicesKinross Gold Corp.Kloeckner MetalsKnorr-Bremse Asia Pacific (Holding) Ltd.Lake Associates Inc.LEO PharmaLi & Fung Trading Co. Ltd.Link-Belt CranesLinkedInLogix Federal Credit UnionLVMH Inc.Malakoff Corporation BerhadMaster International Corp.Mattamy HomesMattelMatthews, Young & Associates Inc.McDonald's KoreaMedidata Solutions Inc.MedxcelMidas Safety Inc.Mine Safety Appliances Company LLCMondelez InternationalMoog Inc.Mutual of OmahaMutual Trust Financial GroupMWHNAMSANN Inc.NOVA ChemicalsTrends in Workplace FlexibilityNovartisOando PLC NigeriaOasis PetroleumOmaha Public Power DistrictOrbitz WorldwideOrscheln IndustriesP.F. Chang's China Bistro Inc.Pacific Northern GasPiramal Enterprises LimitedPopeyes Louisiana Kitchen Inc.Post Consumer BrandsPöyryPrincess AutoPrintronixPurchPurdue Pharma L.P.PVH Corp.Raiffeisen-Hypo GroupRitchie Bros. AuctioneersRobertshawRockwell CollinsRosetta StoneRoyal Dutch ShellRuby TuesdaySamuel, Son & Co. LtdSanDiskSandy Spring BankSanofi-Aventis South AfricaSchneiderSensient TechnologiesShireSimpson Manufacturing Co. Inc.Smead Manufacturing Co.Smiths MedicalSodexo Canada Ltd.Sony EuropeSpecialists on CallSpirax Sarco Inc.StaplesSteve Grossman & AssociatesSuominenSuperior Energy ServicesSwarovskiSWIFTSymantecTechnip USATeck Resources LimitedTELUSTeva PharmaceuticalsThe ADT Corp.The Boston Beer Co.The Croner Co.The Fresh Market Inc.The Warranty GroupWorldatWork16
The Westervelt Co.The YMCA of Greater RochesterTherma-TruTieto Corp.TJXTransAlta Corp.Truven Health AnalyticsTyson Foods Inc.United BankUnited Data TechnologiesUnivarUniversity of DaytonUniversity of MichiganUSfalcon Inc.VerizonTrends in Workplace FlexibilityVisteon Corp.Volvo GroupWard Leonard CT LLCWebsenseWelch Foods Inc.Wellesley CollegeWestern UnionWhitney Smith Co.Wolseley CanadaWorld Acceptance Corp.Yellow PagesYokohama TireYRC Worldwide Inc.ZCL Composites Inc.WorldatWork17
Program Eligibility and Allowance Amount Similar to findings in 2008 and 2011, in 2015, the eligibility for a car allowance (75%) and a provided company car (66%) is concentrated among executives. Fuel or mileage reimbursement is widely eligible among sales employees (49%) and employees with a bona-fide business need (69%). (See Figure 10.)