Transcription
bs bs bannerEnvironmental Microbiology (2014)doi:10.1111/1462-2920.12526Saccharide breakdown and fermentation by the honeybee gut microbiomeFredrick J. Lee,1 Douglas B. Rusch,2Frank J. Stewart,3 Heather R. Mattila4 andIrene L. G. Newton1*1Department of Biology and 2Center for Genomics andBioinformatics, Indiana University, Bloomington, IN47405, USA.3School of Biology, Georgia Institute of Technology,Atlanta, GA 30332, USA.4Department of Biological Sciences, Wellesley College,Wellesley, MA 02481, USA.SummaryThe honey bee, the world’s most important agricultural pollinator, relies exclusively on plant-derivedfoods for nutrition. Nectar and pollen collected byhoney bees are processed and matured within thenest through the activities of honey bee-derivedmicrobes and enzymes. In order to better understandthe contribution of the microbial community to foodprocessing in the honey bee, we generated a metatranscriptome of the honey bee gut microbiome. Thefunction of the microbial community in the honeybee, as revealed by metatranscriptome sequencing,resembles that of other animal guts and foodprocessing environments. We identified three majorbacterial classes that are active in the gut (γProteobacteria, Bacilli and Actinobacteria), all ofwhich are predicted to participate in the breakdown ofcomplex macromolecules (e.g. polysaccharides andpolypeptides), the fermentation of component partsof these macromolecules, and the generation ofvarious fermentation products, such as short-chainfatty acids and alcohol. The ability of the microbialcommunity to metabolize these carbon-rich foodsources was confirmed through the use ofcommunity-level physiological profiling. Collectively,these findings suggest that the gut microflora of thehoney bee harbours bacterial members with uniqueroles, which ultimately can contribute to the processing of plant-derived food for colonies.Received 10 March, 2014; revised 23 May, 2014; accepted 23 May,2014. *For correspondence. E-mail irnewton@indiana.edu; Tel.812 855 3883; Fax 812 855 6705. 2014 Society for Applied Microbiology and John Wiley & Sons LtdIntroductionMany insects with specialist diets (e.g. nitrogen-limited,sap-based diets) live in symbiosis with microorganismsthat supplement vital nutrients that are absent in thehosts’ primary food (Douglas, 1998; Currie et al., 2003;Ohkuma, 2003; Thomas et al., 2009). Some of theseinsect-associated microbes (symbionts) provide theirhosts with essential amino acids, while others providethem with vitamins, or aid in making nutrients more readilyavailable for the host (Douglas, 2009). Many insects donot produce enzymes that digest complex and recalcitrantplant cellular materials. For these insects, such as termites, partnership with microbial symbionts that expresscellulases or hemicellulases is crucial for obtaining energyand materials from a plant-based diet (Ohkuma, 2003;Newton et al., 2013).The honey bee is an herbivorous insect that forages forfood in the form of plant-produced nectar and pollen.Within their nest, worker bees process nectar and polleninto honey and bee bread respectively. Honey is the mainsource of carbohydrates for bees in a colony, whilebee bread is their main source of essential amino acids,lipids, vitamins and minerals (Haydak, 1970; Herbert andShimanuki, 1978; Brodschneider and Cralisheim, 2010).The mechanisms that underlie honey and bee bread production are not completely understood and probablydepend in part on metabolic transformations by beeassociated microbial communities, both within workerhost guts, as well as during maturation of honey and beebread in wax comb and outside of the host (Andersonet al., 2011). Because the production of these food products involves inoculation of plant-derived resources withgut microflora from bees, gut community function andcomposition likely affects food production, and ultimatelycolony health. Although both maturation processes occurprimarily outside of the honey bee body per se, each onerequires worker-derived substances to create the finalfood product.To make honey, nectar is collected from plants by foragers, which begin to reduce its water content throughevaporation as they fly home (Nicolson and Human,2008). The process of producing honey continues withinthe nest when enzymes (e.g. invertase) and microbes(from the honey bee crop, or foregut) are added to nectar
2F. J. Lee et al.as it is handled by multiple workers to further reduce itswater content through regurgitation and evaporation(Haydak, 1970; Olofsson and Vasquez, 2008). Honey, inits final form, is comprised primarily of a concentrated mixof sugars that can be stored in the nest for a long periodof time (Doner, 1977).The process by which bee bread matures is relativelypoorly understood. When honey bees collect raw pollenfrom various plant sources and subsequently pack it intocomb, workers add glandular secretions to the pollenbefore the cell is sealed with a drop of honey, creatingwhat is thought to be an anaerobic environment (Herbertand Shimanuki, 1978; Gilliam, 1979a,b; Vasquez andOlofsson, 2009; DeGrandi-Hoffman et al., 2013). Thismixture, called bee bread, matures for several weeksbefore it is consumed, resulting in a food that is usuallymore nutritious for honey bees than raw pollen alone(Beutler and Opfinger, 1949; Haydak and Vivino, 1950;Human and Nicholson, 2006; Ellis and Hayes, 2009).Pollen that is transformed into bee bread has reducedcomplex polysaccharides, a shift in amino acid profile andan increase in simple carbohydrates (Beutler andOpfinger, 1949; Herbert and Shimanuki, 1978). The finalcomposition of bee bread is carbohydrate-rich (35–61%dry weight), lower in pH than raw pollen and containsessential amino acids in appropriate quantities requiredfor honey bee development (Human and Nicholson, 2006;Brodschneider and Cralisheim, 2010). The exact mechanisms of bee bread maturation are unclear, but it ishypothesized that fermentation by anaerobic microbes isa major contributor to this process (Gilliam, 1979a;Vasquez and Olofsson, 2009). Indeed, lactic acid bacteriaassociated with the honey bee foregut are also found inbee bread, suggesting a link between these two microbialhabitats (Vasquez and Olofsson, 2009). Thus, in additionto potentially aiding the enzymatic digestion of honey andbee bread in the midgut, it is likely that a worker’s foregutmicrobial community is critical for the maturation of honeyand bee bread outside of the host.A recently published honey bee gut metagenomerevealed the diversity of bacterial strains that exist withinthe honey bee gut and described potential functions forthese strains (Engel et al., 2012). Polysaccharidedegrading enzymes as well as sugar-transport mechanisms were identified for bee-associated bacteria (Engelet al., 2012). In that study, bacterial isolates from theGilliamella genus were found to have the potential todigest pectin, a polysaccharide found in pollen tubes.Interestingly, the ability to digest pectin was found to correlate with the evolutionary history of different Gilliamellaisolates, suggesting niche adaptation through functionaldiversification (Engel et al., 2012).Here, we aim to corroborate functions predicted bythe honey bee gut metagenome (total DNA from the com-munity) through characterization of the gut metatranscriptome (total RNA from the community). We utilizedIllumina sequencing of cDNA generated from multiplehoney bee guts to identify active microbial members andto infer community metabolic functions. Our analysesfocused primarily on processes relating to carbohydratemetabolism, the dominant metabolic category identifiedfrom the transcriptome. Notably, we identified key microbial groups and fermentative pathways that are predictedto be active in the microbiome, including pathways thatproduce short-chain fatty acids (SCFAs), an importantenergetic product of fermentation. Additionally, we utilizedcommunity-level physiological profiling (CLPP) to identifymicrobial utilization of common carbon-based substrates(e.g. carbohydrates, amino acids) that are found in thehoney bee diet, the consumption of which are predicted tooccur based on our metatranscriptomic data. Finally, westatistically explored the use of a microbial RNA enrichment protocol, showing that subtractive removal ofeukaryotic mRNA based on polyadenylation did notgreatly alter our estimation of rank abundance in oursamples and only increased our ability to deeply samplethe host-associated microbial communities in them.ResultsSequencing and assemblyTotal RNA was extracted from three individual honey beeguts, from workers collected in Wellesley, MA. A total of24 930 128 reads (1.25 Gb) from six libraries (range:3 346 710–6 180 859 sequences per library) were generated from the honey bee gut metatranscriptome. Thesedatasets, which represent composites of transcripts fromthe host and the microbial community, were pooled togenerate a single, overall assembly, consisting of 25 170contigs. A total of 19 875 contigs (or 79% of the total25 170 contigs) were classified as belonging to the hosthoney bee, based on significant sequence homology tothe Apis mellifera genome. Our analysis of metabolicpathways focuses solely on the remaining non-host fraction (n 5295 contigs), with an N50 length of 5.5 Mb, anN50 value of 450 (i.e. half of the assembly was in 450contigs) and an L50 of 6173 bp (i.e. the length of theshortest contig among those that sum to 50% of theassembly).The honey bee gut metatranscriptome is dominated byγ-Proteobacteria, Bacilli and ActinobacteriaWe assessed the taxonomic composition of themetatranscriptome-derived bee gut microbiome based on16S rRNA reads. Because a significant fraction of readsdid not map to the overall assembly ( 9–25%, depending 2014 Society for Applied Microbiology and John Wiley & Sons Ltd, Environmental Microbiology
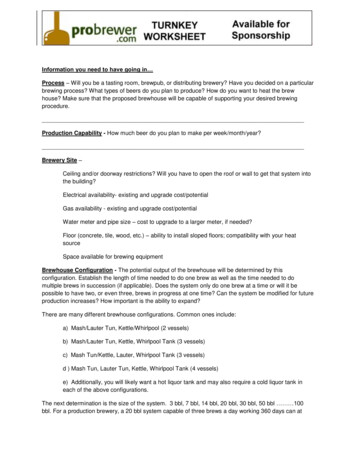
Fermentation by honey bee gut microbesTable 1. Total amount of sequencing and fraction of reads mappingto the entire metatranscriptome assembly before and after bacterialmRNA mple112233––––––total RNAenriched RNAtotal RNAenriched RNAtotal RNAenriched RNATotal ds4 430 4593 426 5003 758 8293 346 7106 180 8593 786 7721 765 3111 682 4871 582 8421 710 9252 607 5091 626 5448.8123.399.8420.8514.4925.51The percentage of unmapped reads increases as the eukaryoticfraction is removed.on the library, Table 1), we mined the reads for homologyto a database of 16S rRNA sequences belonging toknown members of the honey bee bacterial community,in addition to the ARB-SILVA database (Newton andRoeselers, 2012). We utilized 10 975 618 high-quality(q30/80) de-replicated reads for this analysis, 412 839 ofwhich had significant homology to curated, 16S rRNAgene databases ( 4% of our reads). Based on transcriptfragment mapping (bit score 50) from enriched libraries,we identified a total of 19 bacterial phyla in the beegut, dominated by Proteobacteria, Firmicutes andActinobacteria (Fig. 1A), recapitulating our previous workand those of others based on 16S rRNA gene sequences(Cox-Foster et al., 2007; Martinson et al., 2011; Mattilaet al., 2012; Moran et al., 2012). The relative contributionof these bacterial groups to the metatranscriptomic libraries differed between the three enriched libraries; sampletwo contained many more reads homologous to the 16SrRNA from Lactobacilli (Firmicutes, Fig. 1A). The locationto which short reads (100 bp) align along the length of the16S rRNA can affect the accuracy of taxonomic designations (as in Dinsdale et al., 2008). To explore how thisvariability impacted our taxonomic analyses, we compared identifications based on short read alignments todistinct 16S rRNA hypervariable regions for Sample 1(microbe-enriched). A total of 25 770, 29 675, 10 477 and7539 reads mapped to the V1V2, V3V4, V5V6 or V7V9regions of the 16S rRNA gene respectively (Table 2). Atboth the phylum and class levels, we saw a general concordance across the V1–V6 regions with regard to relativeproportions of different bacterial groups (Table 2).However, reads mapping to the V7V9 regions was relatively enriched in sequences matching Firmicutes andrelatively depleted in those matching Proteobacteria. Thevariability among regions increased further at lower taxonomic levels (order and family; data not shown). Based onthese results, we report only phylum- or class-level taxonomic classifications for our other five libraries when3mapping short reads to all regions of the 16S rRNA gene(Fig. 1).Taxonomic composition was also inferred from theannotations of protein-coding genes identified on assembled contigs (referred to as transcripts throughout). Annotations provided by the Metagenomics Analysis Server(MG-RAST), based on homology to protein-coding genes,were used to taxonomically classify each contig (Meyeret al., 2008). The taxonomic composition (relative abundances of dominant bacterial members) derived frommining 16S rRNA reads broadly resembled that basedon transcript annotation using MG-RAST. Importantly,the three most abundant bacterial classes based on16S rRNA short reads (γ-Proteobacteria, Bacilli andActinobacteria) contribute 91% of the protein-coding transcripts in the dataset (Fig. 1B, data pooled across all sixlibraries). The total number of reads mapping to the transcripts from the γ-Proteobacteria (402 795) was substantially higher than those mapping to Bacilli (282 949) andActinobacteria (76 100).In contrast to bacteria, archaea and microbialeukaryotes were not identified as prominent members ofthe honey bee gut microbiome. Only three contigs withhomology to archaea were identified (average aminoacid per cent identity: 64%). These transcripts, whichincluded a trehalose-6-phosphate synthase, a glucose-1phosphate cytidylyltransferase (EC 2.7.7.33) and an integral membrane protein, were not found in all libraries andranged from 0–47 transcripts per million (TPM) (Supporting Information Table S1). In addition, archaea were rareamong the short reads matching 16S rRNA genes. At 98%identity thresholds and using a bit score of 50, no readsmatching archaeal 16S rRNA were identified, perhapsreflecting the relative paucity of sequences in the archaeal16S rRNA gene databases. At 95% identity thresholds,13 428 reads matched archaeal 16S rRNAs while 399 411matched the bacterial 16S rRNAs. Similarly, when focusing on the unenriched total RNA libraries, microbialeukaryotes represented 1% of the actively transcribednon-rRNA transcripts, and based on 18S rRNA short readhomology were found at much lower abundances thanthat of the dominant bacterial community in themetatranscriptome (42 762 reads with significant homology to microbial eukaryote 18S rRNA gene sequences).Although microbial eukaryotes did not contribute substantially to the gut metatranscriptome, these organisms,notably the ascomycete yeasts, have been reported previously in association with the honey bee and may playimportant roles in the processing of bee bread (Gilliam,1979b).Finally, taxonomic classifications were also performedby mapping our transcriptomic reads to the six taxonomicbins that were identified in the previously publishedmetagenomic project: alpha-1, alpha-2, beta, bifido, 2014 Society for Applied Microbiology and John Wiley & Sons Ltd, Environmental Microbiology
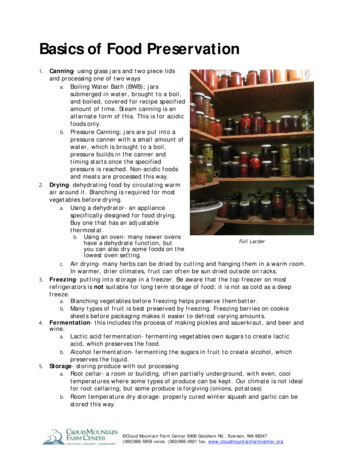
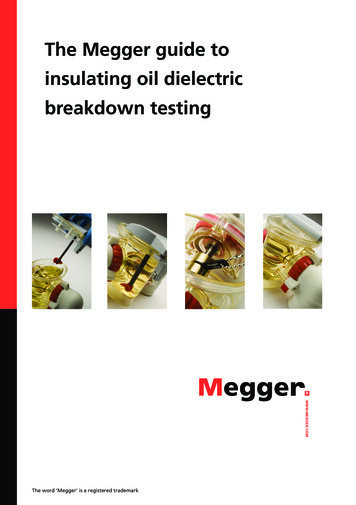
4F. J. Lee et al.Fig. 1. The most active bacterial taxa based on 16S rRNA transcript abundance also contribute strongly to the functionally annotated mRNAtranscripts.A. The total number of transcripts with homology to bacterial 16S rRNA across three enriched metatranscriptomic libraries, each preparedfrom an individual honey bee digestive tract, indicate that the Proteobacteria, Firmicutes and Actinobacteria dominate the bee gut, althoughtheir relative percentages differ slightly across the three enriched samples (see sample 2). Only the top seven phyla are listed (12 others arepresent below this threshold).B. The most abundant classes found in these three enriched libraries based on 16S rRNA read abundance contribute 91% of the totalannotated, assembled mRNAs.gamma and lacto (Engel et al., 2012). These bins ofgenomic scaffolds differ in their total number of basepairs, and accordingly, the number reads from ourtranscriptome that map to each bin is clearly linked to binsize (Supporting Information Table S2). Additionally, thesebins are substantially larger than most single bacterialgenomes (the largest bin being almost 24 Mb in size), andtherefore likely represent multiple strains within the honey 2014 Society for Applied Microbiology and John Wiley & Sons Ltd, Environmental Microbiology
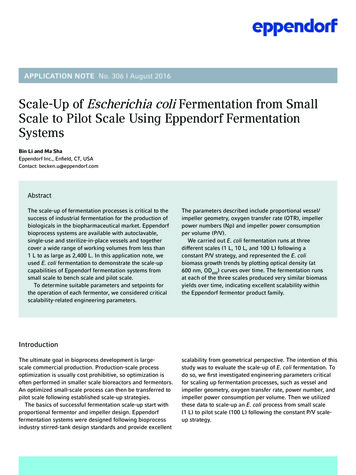
Fermentation by honey bee gut microbes5Table 2. Classification of high-quality reads from the honey bee gut transcriptome at the phylum and class levels using the 16S rRNA gene as amaker for a single honey bee sample (enriched RNA sample 1).Total reads WPSSphingobacteriaTM7V1V2V3V4V5V6V7V925 77029 67510 477753920 919 (81%)3709 (14%)1102 (4%)22911111023 125 (78%)4170 (14%)2373 (8%)60000000V1V2V3V4V5V6V7V918 470 (72%)3700 (14%)1722 (7%)1102 (4%)718 (3%)17977521111111110020 104 (68%)4167 (14%)1942 (7%)2373 (8%)1,078 (4%)630000001000000006878 (66%)2013 (19%)579 (6%)478 (5%)518 (5%)601020000000000024130 (55%)1955 (26%)606 (8%)549 (7%)256 (3%)3620011000000000207976 (76%)2013 (19%)478 (5%)800000024992 (66%)1957 (26%)549 (7%)391000000The total number and the percentage of the reads classified at each level is shown if 1% (in parentheses).bee gut. Roughly three million reads were mapped tothese ‘core’ honey bee taxa, although a great majority didnot map (21 627 379, allowing for 20% divergence).These results can be explained in two ways: (i) these coretaxa do not dominate transcriptionally in vivo, or morelikely (ii) that representatives from the metagenome’s‘core’ taxa are divergent from those found in ourmetatranscriptomic dataset. That is, bees sampled for themetatranscriptome were hosts to these core groups ofbacteria, but their members are genetically different fromthose in the published metagenome. Indeed, our assembled transcripts do match portions of the metagenomiccontigs, although with a range of per cent identities ( 60–100%, Supporting Information Fig. S1).Carbon metabolism in the honey bee gut microbiomeThe metatranscriptome of the bee gut microbiomeis dominated by seven functional categories: proteinmetabolism, carbohydrate metabolism, RNA metabolism,respiration, membrane transport, stress response andvirulence (Fig. 2A). Excluding functional categories associated with the core cellular processes of tRNA and ribosomal protein synthesis, which make up a large fraction(70%) of the protein metabolism category, the largestfunctional signature in the dataset is associated withcarbohydrate metabolism (Fig. 2). As is true of themetatranscriptome overall, this functional category isdominated by transcripts matching genes of Bacilli,γ-Proteobacteria and Actinobacteria (Fig. 2). Outsideof central intermediary metabolism (which includesglycolysis, the Entner–Doudoroff pathway, pentose phosphate and the citric acid cycle), the next most commonmetabolism identified in the dataset is the use of simplesugars (mono 214, and di- and oligosaccharides, 162annotated transcripts), followed by fermentation (336annotated transcripts) and sugar alcohol metabolism(119 annotated transcripts). We, therefore, focused 2014 Society for Applied Microbiology and John Wiley & Sons Ltd, Environmental Microbiology
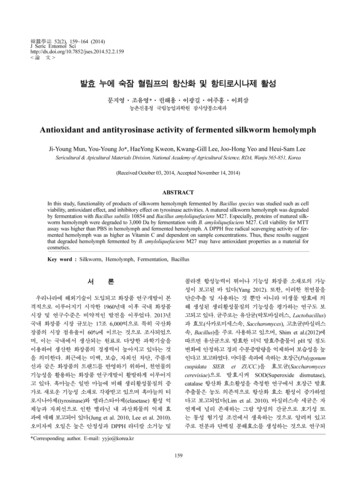
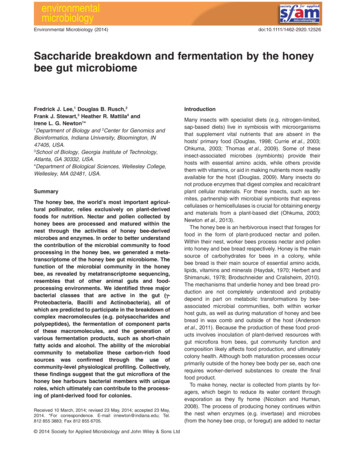
6F. J. Lee et al.Fig. 2. The second most abundant functional class (based on MG-RAST subsystems hierarchical annotation) of transcripts is carbohydratemetabolism.A. Thirteen per cent of the annotated transcripts are associated with the uptake, export and metabolism of carbohydrates.B. The most abundant bacterial classes (γ-Proteobacteria, Bacilli and Actinobacteria) contribute to this category in varying proportions and withemphasis on different functions. For example, the Bacilli are most prominent in metabolizing di- and oligosaccharides, fermentation,monosaccharides, and sugar alcohols while the γ-Proteobacteria are enriched for transcripts involved in anaplerotic reactions and centralintermediary metabolism. Importantly, like many functional annotation categories, overlap exists between categories with regard tomembership of particular transcripts. 2014 Society for Applied Microbiology and John Wiley & Sons Ltd, Environmental Microbiology
Fermentation by honey bee gut microbesour analysis on the potential for the microbiota todigest macromolecules, take up sugars and fermentcarbohydrates.In order to generate a metabolic model for the microbialmembers in the gut, we utilized the published, assembledmetagenome of the honey bee gut (Engel et al., 2012) inconjunction with our metatranscriptomic dataset. Theassembled metagenome contigs were annotated via thesame pipeline used for the metatranscriptome contigs(MG-RAST), and used to identify predominant carbohydrate utilization pathways. Interestingly, although themetagenome was generated from honey bees from adifferent geographical area (Arizona, USA), the functionspredicted by the metagenome were largely in agreementwith the metatranscriptomic data from our samples(Wellesley, MA), identifying a prominent role for fermentative pathways in the three major bacterial classes. Thiscongruence suggests stability of the core honey beemicrobiome, as has been observed previously (Martinsonet al., 2011; Moran et al., 2012). Interestingly, however,we identified several carbon utilization pathways notidentified in the metagenome (Fig. 3). Differences inthe functional composition of the metatranscriptome andmetagenome datasets may reflect variation due to methodology (RNA versus DNA sequencing), age and geneticbackgrounds of the sampled bees, or microbiome composition as well as enrichment strategies used in themetagenomic project (Engel et al., 2012). Below, wedescribe key carbon utilization pathways identified in themetatranscriptome.Saccharide and protein breakdown and uptake by thebacterial community in the honey beeThe metatranscriptome confirms a major role of thehoney bee microbiome in the degradation of plant carbohydrates and polypeptides, indicating active transcription of genes encoding glycoside hydrolases to breakdown complex polysaccharides and peptidases forprotein hydrolysis. Notably, we identified transcriptsmatching diverse peptidase-encoding genes from Bacilli,including genes for proline aminopeptidase (EC 3.4.11.5;TPM average 5.65), dipeptidase (EC 3.4.13.9; TPMaverage 3.55) as well as aminopeptidases C (EC3.4.22.40; TPM average 7.83). In contrast, peptidaseencoding transcripts from the γ-Proteobacteria were represented by only a single oligopeptidase A with arelatively high expression level (EC 3.4.24.70; TPMaverage 32.33). The honey bee genome itself encodesseveral glycoside hydrolases, including some that mayact on plant cell wall components, such as GH13 andGH16 families (Supporting Information Table S3). Interestingly, our transcriptome assembly did not includemany of these genes; only two out of the five predicted7CAZy enzymes were transcribed substantially in ourhoney bee gut samples. In contrast, we found evidencefor the expression of several glycoside hydrolases bybacteria in the honey bee gut, the most highly transcribed of which came from the Bacilli (Table 3) andincluded those of the GH13 carbohydrate-active enzyme(CAZy) family (ECs 3.2.1.70 and 3.2.1.135, amylopullulanase). These glycoside hydrolases degrade alpha1,4-glucosidic linkages between simple sugars but alsohave de-branching activity, hydrolysing the alpha-1- 6linkages in oligosaccharides (Ara et al., 1995). Substrates of the GH13 family include amylopectin andstarch polymers commonly found within plant cells (Balland Morell, 2003). A beta-glucosidase (EC 3.2.1.21),of the GH3 CAZy family, was also well representedin the metatranscriptome, matching genes of theActinobacteria, γ-Proteobacteria and β-Proteobacteria(Table 3). This enzyme is responsible for the breakdownof diverse oligosaccharides found in cellulosic biomass.Enzymes of this class have unusually broad substratespecificities, being capable of binding to oligosaccharides with diverse sizes and residues, and couldtherefore contribute significantly in the breakdown ofpollen. The metatranscriptome also contained sequencesmatching Clostridial and γ-Proteobacterial genes encoding alpha-mannosidase (EC 3.2.1.24, GH38 CAZyfamily), which is predicted to act on mannose containingsubstrates (Suits et al., 2010). Other GH familiesdetected in the dataset (GH4, GH1, GH32) are predictedto act on the soluble disaccharides maltose, cellobioseand sucrose respectively (Table 3).The metatranscriptome also encoded transporters andpermeases for the uptake of key products of complexcarbohydrate and protein degradation, including aminoacids, peptides, di- and oligo-saccharides. Over 180 transcripts from the assembled dataset were classified asmembrane transporters, including phosphotransferasesystems (104 transcripts), ABC transporters (68 transcripts), permeases (19 transcripts) and symporters (9transcripts). Interestingly, more than one third of thesesystems are specific to amino acids, not sugars (13 aminoacid transporters, across all three bacterial classescompared with 21 sugar transporters) (Fig. 3; Table 4).These amino acid transporters include those takingup oligopeptides, dipeptides (e.g. putrescine andspermidine), urea and single amino acids (methionine,proline, alanine, glycine, isoleucine, valine, and leucine,arginine, serine, threonine, glutamate, aspartate and histidine). Based on both our metatranscriptomic data andthe published metagenomic contigs (Engel et al., 2012),honey bee gut Bacilli are predicted to contain relativelyfew pathways for amino acid biosynthesis (the only complete metabolic pathway identified in the meta-omic datafor Bacilli was for alanine anabolism). Bacilli likely take up 2014 Society for Applied Microbiology and John Wiley & Sons Ltd, Environmental Microbiology
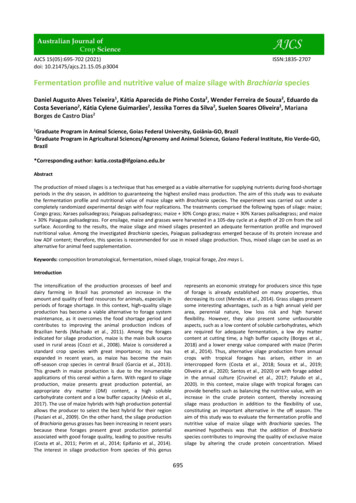
8F. J. Lee et al.Fig. 3. Predicted uptake and metabolism of carbon and nitrogen sources by the three major classes of bacteria in the honey bee gut. Theseprocesses were found to be taxonomically associated with each of these three major classes, although we cannot definitively conclude that allprocesses occur within a single cell. Support for the presence of the metabolism in each bacterial class is shown and coloured based onsource (the metagenome or the metatranscriptome). Every pathway depicted as transcribed is supported by a TPM of five in at least two ofthe six libraries.amino acids from the environment of the honey bee gut(either derived from diet or from biosynthesis by othermembers of the community). In contrast, and again basedon the combined datasets from the metagenomeand metatranscriptome, the γ-Proteobacteria and theActinobacteria are predicted to synthesize all essentialamino acids, as well as other non-essential amino acids(Fig. 3, Table 4). 2014 Society for Applied Microbiology and John Wiley & Sons Ltd, Environmental Microbiology
Fermentation by honey bee gut microbes9Table 3. Genes encoding carbohydrate active enzymes detected as transcribed in the honey bee gut based on their coverage (TPM values) andannotations from the utative functionPotential substratesPhylumclassification(no.)Amylase (EC 3.2.1.70); neopullulanase(EC 3.2.1.135);Maltose-6-phosphate glucosidase(EC e (EC 3.2.1.86)Invertase; endo-inulinaseβ-glucosidase/xylan 1,4-β-xylosidase(EC 3.2.1.21)α-mannosidase (EC 3.2.1.24)Starch, amylopectin, glycogenBacilli (2)34.64 (20.38, 50.91)MaltoseBacilli (1)24.98 (0, 49.96)CellobioseBacilli (11); γ proteo (5);β proteo (1)Bacilli (1); actino. (2)Actino. (1); γ proteo (2);β proteo (1)Clostridia (1); γ proteo (1);24.69 (0.45, 151.71)SucroseCellulose, xylan oligosaccharidesMannose- and xylose-containingglycansAverage TPM(min, max)17.12 (1.41, 45.81)12.7 (3.97, 18.86)10.43 (10.87, 52.01)All of these CAZy families were also identified in the published metagenomic analysis (Engel et al., 2013). Data were sorted based on TPM value.Diverse bacterial sugar transporters were detected inthe honey bee gut. We detected transcripts matchingBacilli genes encoding transporters for 16 distinct saccharides, as well as transcripts matching the CUT1 family ofoligosaccharide transporters, which are known for theirbroad substrate affinity. The γ-Proteobacteria-related transcript pool encoded at least nine distinct saccharide transporters, as well as two broad affinity transporters (Fig. 3).For the Actinobacteria, which were not as deeply sampledin this dataset, we detected transcripts encoding threesugar transporters, the CUT1 and CUT2 (disaccharidetransporter) families and a maltose ABC transporter(Table 4).Sugar fermentation and the production of SCFAs by thehoney bee microbiotaThe metatranscriptome data suggest that many of thesugars transported into the cytoplasm by bacteria in thebee gut are shunted through glycolysis or the pentosephosphate pathway, both of which were found as complete pathways in the metatranscriptome and metagenome (data not shown). These pathways generate theimportant metabolic intermediates phosphoenolpyruvateand pyruvate, as well as reducing equivalents (NADH, H )that require recycling in the honey bee gut, which is predicted to be an anaerobic habitat. These products li
and materials from a plant-based diet (Ohkuma, 2003; Newton et al., 2013). The honey bee is an herbivorous insect that forages for food in the form of plant-produced nectar and pollen. Within their nest, worker bees process nectar and pollen into honey and bee bread respectively. Honey is the main source of carbohydrates for bees in a colony, while