Transcription
BD BiosciencesTechnical BulletinAugust 2011Threshold and Analysis of Small Particles on the BD Accuri C6 Flow CytometerThreshold and Analysis of Small Particleson the BD Accuri C6 Flow CytometerTechnical BulletinContents2Thresholds2Setting the Threshold2The Noise Floor4Identifying Particles of Interest4Identification of Fluorescent Particles5Identification of NonfluorescentParticles5Using Multiple Thresholds5Alternative Trigger Channels(Side Scatter and Fluorescence)6Data Acquisition Rate7Conclusion8Summary of RecommendationsWhen analyzing small particles, defined as particles smaller than 3.0 µm, on theBD Accuri C6 flow cytometer, certain items must be considered to ensureproper data acquisition. This note discusses some of the basic concepts neededto perform small particle acquisition and analysis properly.
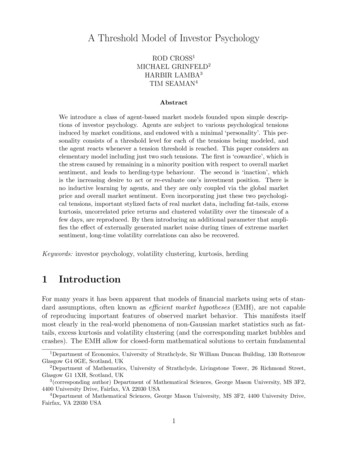
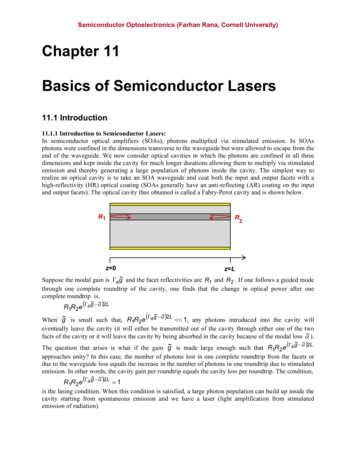
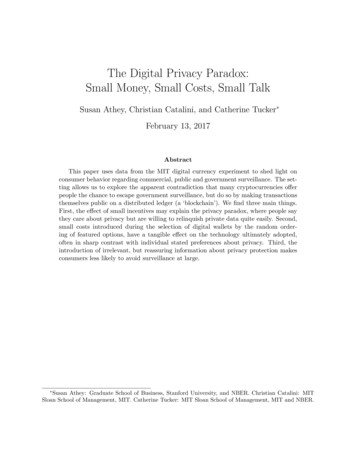
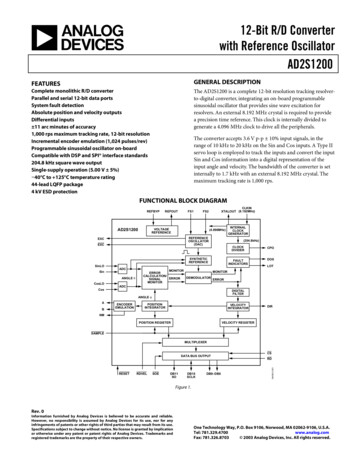
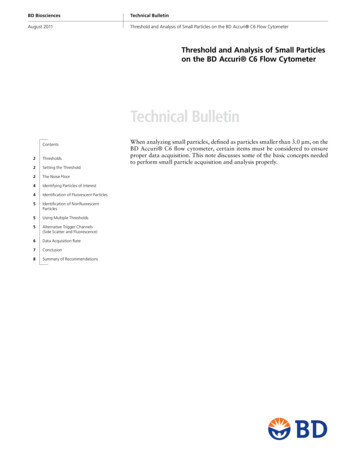
BD BiosciencesTechnical BulletinAugust 2011Threshold and Analysis of Small Particles on the BD Accuri C6 Flow CytometerThresholdsSignal IntensityWidthA threshold is the lowest signal intensity value an event can have for it to berecorded by the cytometer. The trigger channel is the critical parameter used todetermine if an event should be recorded. When using the BD Accuri C6, settingthe primary threshold also defines the trigger channel. The signal pulse mustexceed the level set on the trigger channel to be recorded as an event on any otherchannel.ThresholdTrigger Channel - HFigure 1. Schematic of a typical signal pulse.To be recorded, the pulse (black line) musthave an intensity greater than the thresholdvalue (red line). On the BD Accuri C6, thesignal width is defined as the distance betweenthe point at which the signal rises above thethreshold and the point at which the signal fallsbelow the threshold (time of flight).On the BD Accuri C6, the default setting of a primary threshold on FSC-H of80,000 indicates that the system will record an event only if it has an FSC valueof 80,000, regardless of any other parameter values. In this example, FSC-H is,therefore, also the trigger channel. Using this setting, the 8-Peak (Cat. No.653144) and 6-Peak (Cat. No. 653145) Validation Beads can easily be visualizedon an FSC vs SSC plot. Typically, thresholds are used to exclude unwanted signalssuch as those from cellular debris. All thresholds on the BD Accuri C6 are appliedusing the Height signal measurements. There is no impact on the data if the Areaparameter is viewed during data acquisition or analysis. However, this may leadto a discrepancy in which the threshold falls when viewing Area data, as seen inFigure 2. The difference between where the data is thresholded in Area vs Heightwill vary depending on the particles being analyzed.250,000The reason for this difference is that the area data is displayed after area scalingfactors have been applied. The BD Accuri C6 uses fixed area scaling factors thatdo not normalize the area data values exactly to the height data values for allsample types.100,0000SSC-HSetting the Threshold0500,0001,000,000FSC-H250,000150,000When choosing the appropriate threshold value, debris and undesired eventsshould be eliminated without inadvertently eliminating relevant events. Ifstandard or familiar samples are being acquired, the threshold can be set basedon experience. However, if this is the first time a particular experiment isperformed, it might not be clear which events are the correct ones, so they mustbe identified. Once the particles have been identified, the threshold should be setlow enough to ensure the entire population is captured. One way to do this wouldbe to set the threshold to its lowest value (10). However, setting the thresholdvery low on any parameter will result in the electronic noise for that channelbecoming visible and interfering with acquisition and analysis.100,0000SSC-AThe Noise Floor0500,000150,0001,000,000FSC-AFigure 2. A sample of lysed and fixed humanperipheral blood was acquired using an FSCtrigger and threshold of 150,000. In the FSC-Hvs SSC-H plot, the data begins at 150,000.However, when viewing the Area parametersfor the same sample (FSC-A vs SSC-A), thethreshold appears to be lower than 150,000.On all flow cytometers, every channel has an inherent noise floor. Noise iscomposed of low-level signals that occur within the electronics and of stray lightcollected by the optics. This noise appears as events that are collected even whenthere are no, or very few, “true” events in the sample. For example, as seen inFigure 3, a sample from a tube of 0.2-µm filtered deionized water was acquiredat the standard settings, and only a small number of events was detected. Theseare most likely “true” particulate matter. As the threshold is lowered, more andmore events are detected until those events dominate the plot. With the thresholdset to 80,000, acquiring sample for 1 minute resulted in only 80 events. However,the same sample re-acquired with a threshold of 1,000 resulted in 200,000events.The ideal placement of the threshold is somewhere between the particles ofinterest and the noise floor. Since the range of samples that can be analyzed ona BD Accuri C6 varies greatly, it is difficult to assign a threshold value that wouldbe appropriate for all samples. Therefore, trial and error are necessary to identify
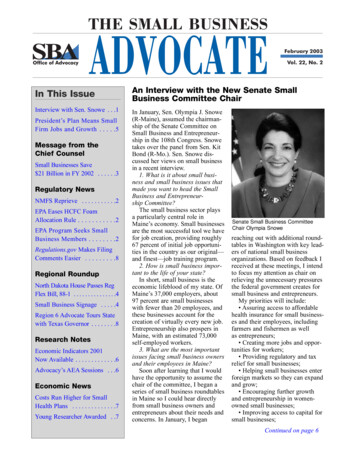
Technical BulletinAugust 2011Threshold and Analysis of Small Particles on the BD Accuri C6 Flow CytometerAthe proper threshold value for any given experiment. This is illustrated in Figure4. Using the default threshold of 80,000, the BD Accuri C6 should be able tovisualize a 1-µm bead using an FSC-H vs SSC-H plot. However, since the beadfalls very close to the threshold value, this threshold might not be appropriate.Nominally 1-µm beads, or beads of any size, are not created equal and can fallin slightly different locations based on their actual size. Some might be closer to0.9 µm, while others are 1.1 µm. Some bead samples labeled 1 µm might actuallycontain a range of particle sizes, for example 0.95 µm to 1.05 µm. Based on theproximity to the bead, a threshold of 80,000 might not be appropriate, sincesome of the data could be lost.10 610 7.2AFSC-H10 5SSC-HR10.0%10 210 410 110 5R30.0%10 110 210 310 410 3FSC-H10 1CA04 1 um - 10kGate: [No Gating]R10.0%R384.8%10 510 610 7.2A05 1 um - 40kGate: [No Gating]R10.0%R398.8%10 110 210 310 4FSC-H10 510 610 7.210 110 210 310 410 510 610 7.2FSC-HFigure 4. The effect of different FSC thresholds when analyzing a 1-µm bead. A) FSC-H thresholdof 80,000; B) FSC-H threshold of 10,000; C) FSC-H threshold of 40,000. Region R3 encompassesthe 1-µm bead. Region R1 indicates the position of the Spherotech 8-Peak Validation Beads. Theblack box indicates the position of the noise floor.10 2SSC-HR10.0%R399.1%10 6A08 H2O - 1kGate: [No Gating]10 610 7.2CBA03 1 um - 80kGate: [No Gating]10 7.210 510 610 410 510 310 410 2SSC-H10 110 310 410 310 110 2SSC-H10 5R30.3%10 2R10.0%10 1A07 H2O - 10kGate: [No Gating]10 610 7.2B10 7.2FSC-HIf the threshold is lowered to 10,000, it is a sufficient distance from the beads toprevent accidental loss of any particles of interest. This can be verified bychecking the number of beads in region R3. With the threshold set to 10,000,there are 30,700 events in region R3. At the threshold of 80,000, there are 31,300 in the region, indicating no loss of bead data at the higher threshold.However, at the lower threshold value, a second population begins to appearnear the threshold. Based on the noise floor criteria, this new population is thenoise floor. In the example with the lower threshold, 84% of the data is the1-µm beads, compared to 99% at the higher threshold. To minimize the effectsof the noise floor, a threshold somewhere between 10,000 and 80,000 should bechosen in this case. For example, if a threshold of 40,000 is selected, most of thenoise is eliminated, and the majority of the events acquired are 1-µm beads, asindicated by the percentage of total events increasing back up to almost 99%( 31,000 events in region R3).10 610 7.210 510 610 410 5SSC-H10 410 210 310 410 210 310 110 310 410 310 110 2SSC-H10 5R31.2%Page 310 1R10.0%10 7.2A06 H2O 80kGate: [No Gating]10 610 7.2BD Biosciences10 110 210 310 410 510 610 7.2FSC-HFigure 3. The appearance of the FSC noisefloor as the FSC threshold is lowered from: A)80,000; B) to 10,000; C) to 1,000. Region R1and region R3 indicate where the Spherotech8-Peak Validation Beads and a 1-µm beadwould fall, respectively. The population in theblack region is the noise floor.As a general guide, if there is a large difference between the particles of interestand the noise floor, set the threshold no more than 1 log decade lower than theparticles of interest. However, if this is not possible, minor overlaps of the noisefloor will not impact results as long as the number of “true” events outweighsthe number of noise events.When determining the appropriate threshold, the threshold setting can bechanged while acquiring data. This is useful when determining the proper setup.However, the sample acquisition should always be restarted if the threshold valuewas changed during a previous acquisition. This ensures proper application ofthe desired threshold value.
Technical BulletinAugust 2011Threshold and Analysis of Small Particles on the BD Accuri C6 Flow Cytometer10 4Before the threshold can be set properly, it might be necessary to determine whichevents are really the particles of interest in the samples. With larger particles orcells, this is relatively straightforward using the guidelines previously described.However, with smaller particles, especially those under 1.0 µm, this can beproblematic. For example, Figure 5 shows a 0.5-µm particle acquired on a BDAccuri C6 using an FSC trigger and threshold of 1,000. There are clearly twopopulations, and yet only one type of particle was run.There are two ways to make the identification:10 6R10.0%10 5R30.0%1. U se another characteristic of the particle, such as fluorescence, topositively identify the particles in the FSC vs SSC plot, or10 110 2SSC-HIdentifying Particles of InterestA09 0.5 um 1kGate: [No Gating]10 310 7.2BD Biosciences10 110 210 310 410 510 6Of these two options, the first is preferred. This allows for distinguishing a singleparticle type from other particle types in addition to distinguishing from thenoise.Identification of Fluorescent ParticlesIn the 0.5-µm beads example, a fluorescence signature from the bead can be used,since this particular 0.5-µm bead is labeled with a fluorochrome that can bedetected using the 533/30 filter in the FL1 channel. The FL1 data acquiredpreviously using an FSC trigger and threshold of 1,000 indicates a bright peakjust above 100,000, identified with marker M1, and some other dim ornonfluorescent events (Figure 6).A09 0.5 um 1kGate: [No Gating]2,0003,200Figure 5. Acquisition of a 0.5-µm particleusing an FSC trigger and FSC-H primarythreshold of 1,000. Two populations, the0.5-µm bead and noise, are evident.If the M1 region is used as a gate and the FSC vs SSC plot is viewed with the M1gate applied (backgating), a single population is evident (Figure 7). A region hasbeen drawn around this population so that when the M1 gate is removed fromthe FSC vs SSC plot, the fluorescent 0.5-µm beads population is clear.M18.5%1,000Count2. Compare against the instrument noise floor.10 7.2FSC-H0Using this technique, various particle types or populations could be distinguishedfrom each other as long as each one has a unique fluorescent marker.10 7.2B10 1A09 0.5 um 1kGate: [No Gating]10 5R499.8%10 2SSC-H10 510 610 7.2Figure 6. Identification of the fluorescentsignal of the 0.5-µm particle using the FL1parameter. Region M1 is the fluorescent bead.A09 0.5 um 1kGate: M110 6AR412.5%10 410 7.2SSC-H10 610 310 510 210 4FL1-H10 110 210 310 4FSC-H10 510 610 7.210 110 310 410 210 310 110 110 210 310 410 510 610 7.2FSC-HFigure 7. Identification of the 0.5-µm bead from the noise by backgating on the fluorescence ofthe 0.5-µm bead seen in FL1. A) Identification of the fluorescent beads after using a fluorescentbackgate. B) Removal of the gate on the FSC vs SSC plot to distinguish the bead population fromthe other population (noise).
BD BiosciencesTechnical BulletinAugust 2011Threshold and Analysis of Small Particles on the BD Accuri C6 Flow CytometerPage 5Identification of Nonfluorescent ParticlesUsing Multiple ThresholdsB04 0.5 um 4500SSC 1000FSCGate: [No Gating]To ensure proper analysis and to prevent exceeding the maximum data acquisitionrate of 10,000 events per second, the majority of the noise should be thresholdedout during sample acquisition. In the 0.5-µm bead example, a single FSCthreshold would be insufficient. Other options need to be considered for runningthis sample. To determine the options, review the data for obvious differences inthe populations that can be exploited. In Figure 5, the most obvious differencein this example is that the noise has significantly lower SSC than the 0.5-µmbead. The addition of a secondary threshold on SSC could be applied. Adding asecondary threshold imposes an additional minimum value in the data before itis recorded. It does not directly impact the trigger channel and primary threshold.Secondary thresholds can be applied with any primary threshold/trigger channel.10 310 4R498.8%10 110 2SSC-H10 510 610 7.2If a nonfluorescent 0.5-µm particle was used, then a similar process could beperformed using the noise floor as the reference point. A sample of water couldbe run at the same threshold settings as the beads sample. In this case, noisewould be the only population present. A region could be drawn around the noiseto identify and use it as a comparison to the bead sample.10 110 210 310 410 510 610 7.2FSC-HThe sample can therefore be effectively acquired using the FSC trigger, FSCthreshold of 1,000, and secondary SSC threshold of 4,000 setup. Similar toprimary thresholds, secondary threshold values can be changed at any time.However, the parameter cannot be changed during data acquisition. Secondarythresholds can also be added after the data acquisition. This would be similar togating out the unwanted data as opposed to never acquiring it in the first place.Increasing the threshold permanently removes events from the data set.Alternative Trigger Channels (Side Scatter and Fluorescence)B03 0.5 um SSC 4kGate: [No Gating]The addition of a secondary threshold is only one way to remove noise or debris.Since the noise and 0.5-µm bead can clearly be distinguished in SSC, an SSCtrigger could be used to acquire the data. In Figure 9, the same sample wasacquired using an SSC primary threshold and trigger of 4,000.R497.4%10 310 4This results in a single population and only a small amount of noise. The noiseis minimal as evidenced by 97% of the results falling in the original M1fluorescent backgate in the FSC vs SSC plot. The noise and scatter patterns willbe different with the use of different trigger channels, but if the thresholds areset properly, the data should look fairly similar. In many cases, when acquiringsmall particles, the SSC trigger is more useful than an FSC trigger, as seen in the0.5-µm bead example.10 110 2SSC-H10 510 610 7.2Figure 8. Addition of a secondary SSCthreshold to the primary FSC threshold toremove noise.10 110 210 310 4By applying a secondary SSC threshold of 4,000 to the data, the majority of thenoise can be removed while retaining the entire bead population.10 510 610 7.2FSC-HFigure 9. FSC vs SSC plot of a 0.5-µm beadusing an SSC trigger and SSC-H primarythreshold of 4,000. Region R4 designatesthe position of the bead using the previousfluorescence backgating (Figures 6 and 7).In the preceding examples, the particles can easily be separated from the noisein either FSC (1.0 µm) or SSC (0.5 µm). Other samples might not be socooperative. The particles of interest might significantly overlap the noise,complicating acquisition and analysis. In cases such as this, the final option fordetecting the particles is to take advantage of fluorescence. As demonstratedearlier, the 0.5-µm particle produces a single bright peak in the FL1 channel. Ifall the desired particles are the same, ie, have a useful fluorescence signature asis the case here, a fluorescence trigger could be used to acquire the data. Afluorescence trigger would only acquire events that have a fluorescence level abovethe threshold set. Similar to an FSC threshold, which only records events above
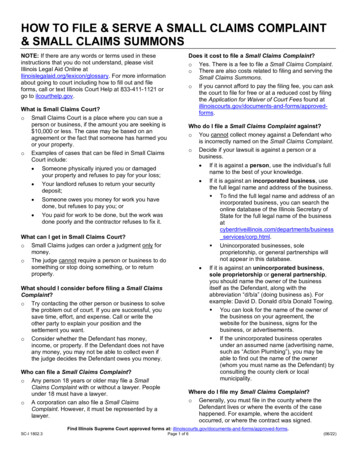
BD BiosciencesTechnical BulletinAugust 2011Threshold and Analysis of Small Particles on the BD Accuri C6 Flow Cytometera certain approximate size, a fluorescence trigger only records events brighterthan the set threshold.B10 210 310 410 510 610 7.210 610 510 4SSC-HR497.8%10 210 1010 1B01 0.5 10k FL1 DilutedGate: [No Gating]10 4%0CountCB01 0.5 10k FL1 DilutedGate: [No Gating]300,0003,200A09 0.5 um 1kGate: [No Gating]10 3A10 110 210 3FL1-H10 410 510 610 7.210 110 210 3FL1-H10 410 510 610 7.2FSC-HFigure 10. Use of a fluorescence (FL1) trigger to acquire the 0.5-µm bead sample. A) Bead sampleacquired using an FSC trigger to identify if and where the fluorescence signature of the bead is inthe FL1 parameter. B) Acquisition of the bead sample using an FL1 trigger and primary thresholdvalue of 25,000. C) FSC/SSC results of the bead acquired using an FL1 trigger setting.If the FSC vs SSC plot is viewed based only on the fluorescent events beingacquired (Figure 10C), the beads fall in exactly the same place as before usingeither the FSC or SSC triggers (the R4 region has not been moved). Using thefluorescence trigger produces data that has much less associated noise.Data Acquisition RateAs stated previously, small amounts of overlapping noise will have minimalimpact on data acquisition and results. However, large amounts of noise caninterfere with proper operation of the cytometer.B10 310 410 510 610 7.210 7.210 610 410 3SSC-HR497.8%10 210 110 2FSC-H10 310 410 510 610 7.210 110 210 210 110 1B01 0.5 10k FL1 DilutedGate: [No Gating]10 510 610 510 4SSC-HR497.4%10 310 510 410 3SSC-HR47.5%10 210 1CB03 0.5 um SSC 4kGate: [No Gating]10 7.2B02 0.5 FSC 1kGate: [No Gating]10 610 7.2A10 110 2FSC-H10 310 410 510 610 7.2FSC-HTable 1.Dot PlotsTriggerThresholdTotal EventsEvents in igure 11 and Table 1. Impact of large amounts of noise on the event rate. The same sampleof 0.5-µm beads was run using similar acquisition parameters (flow rate, time of acquisition) withdifferent threshold settings: A) FSC threshold of 1,000; B) SSC threshold of 4,000; C) FL1 thresholdof 25,000. Table 1 shows the differences in event rates resulting from the different thresholdsettings and resulting impact of noise on the data.
BD BiosciencesTechnical BulletinAugust 2011Threshold and Analysis of Small Particles on the BD Accuri C6 Flow CytometerPage 7Figure 11 demonstrates the impact of noise on the data. An acquisition with largeamounts of noise, similar to when using the low FSC trigger and threshold, canresult in faulty data acquisition rates (events per second). This is due to exceedingthe maximum acquisition rate, 10,000 events per second. When this occurs, datais lost with no warning and no obvious indicators. In fact most flow cytometerswill experience the same issue, without warning or indicators. For example, theFSC threshold run resulted in 4,052 events in region R4 with a total of 54,000events. This acquisition was reported at 3,585 events per second, well under themaximum rate of 10,000 events per second. However, the same sample acquiredwith an FL1 fluorescence trigger resulted in 151,356 events in region R4 out ofa total of 154,695 events. This acquisition was reported at 10,309 events persecond. Therefore, running the same sample for the same duration of time at thesame flow rate yielded different results. When the system is operated above themaximum acquisition rate, events are lost randomly. So, both noise and eventsof interest are lost.A similar result can occur if the sample is highly concentrated and the rateexceeds 10,000 events per second, even when using appropriate thresholds thateliminate the noise.If exact event count or events/µL is needed and/or the sample cannot be cleanlyseparated from the noise floor, a dilution of the sample should be performed. IfBD CFlow software indicates a similar decrease in events as the dilution, theBD Accuri C6 is acquiring normally and the sample concentration and setup areusable. If the event rate does not decrease with the dilution, the data acquisitionrate is more than 10,000 events per second and outside the normal operatingrange of the system. If this is the case, an effort should be made to remove noiseby altering the trigger channel and thresholds and/or diluting the sample. Theflow rate setting could also be decreased. However, volume measurements takenon the BD Accuri C6 while acquiring sample at a Slow flow rate are notguaranteed to have 10% error. If absolute volume measurements are notrequired, decreasing to Slow might be sufficient to lower the event rate to lessthan 10,000 events per second. Otherwise, dilution of the sample is necessaryto obtain an accurate volume measurement.ConclusionThe BD Accuri C6 personal flow cytometer can analyze platelets, microbes, andmany other types of particles smaller than 3.0 µm. Successful acquisition andanalysis of small particles depend on accurately differentiating them from debrisand noise.This Technical Bulletin provides guidelines for setting triggers and thresholds,identifying particles of interest, and managing data acquisition rates whenacquiring small particles on the BD Accuri C6. It includes data examples thatuse beads of known sizes to represent various kinds of small particles.
BD BiosciencesTechnical BulletinAugust 2011Threshold and Analysis of Small Particles on the BD Accuri C6 Flow CytometerSummary of RecommendationsGeneral GuidelineSpecific RecommendationsBy default, the trigger channel is FSC-H and the primary threshold is 80,000.Adjust the primary threshold for FSC-Hto eliminate noise while recording all theparticles of interest.If necessary, adjust the FSC threshold to fall between the particles of interest(ideally no more than one log decade lower) and the noise floor.You may try out different threshold settings while acquiring data. However,always restart data acquisition once the final threshold has been set.If possible, identify and backgate particles of interest using fluorescence.If necessary, identify particles of interest.Otherwise, use a sample of water to identify the noise floor.If FSC cannot discriminate betweenparticles of interest and noise Either add a secondary threshold on SSC or fluorescence, or Use SSC or fluorescence as an alternative trigger channel.Either adjust the trigger channel and thresholds to remove noise, or Make sure the data acquisition rate doesnot exceed 10,000 events per second.For Research Use Only. Not for use in diagnostic or therapeutic procedures.BD flow cytometers are Class 1 Laser Products.BD, BD Logo and all other trademarks are property of Becton, Dickinson and Company. 2011 BD23-13607-00Dilute the sample, or Decrease the flow rate setting (unless absolute volume measurements arerequired).BD Biosciences2350 Qume DriveSan Jose, CA 95131US Orders: 855.236.2772BD Accuri Technical Support: ciences.com
Threshold and Analysis of Small Particles on the BD Accuri C6 Flow Cytometer BD Biosciences August 2011 Thresholds A threshold is the lowest signal intensity value an event can have for it to be recorded by the cytometer. The trigger channel is the critical parameter used to determine if an event should be recorded.