Transcription
A Threshold Model of Investor PsychologyROD CROSS1MICHAEL GRINFELD2HARBIR LAMBA3TIM SEAMAN4AbstractWe introduce a class of agent-based market models founded upon simple descriptions of investor psychology. Agents are subject to various psychological tensionsinduced by market conditions, and endowed with a minimal ‘personality’. This personality consists of a threshold level for each of the tensions being modeled, andthe agent reacts whenever a tension threshold is reached. This paper considers anelementary model including just two such tensions. The first is ‘cowardice’, which isthe stress caused by remaining in a minority position with respect to overall marketsentiment, and leads to herding-type behaviour. The second is ‘inaction’, whichis the increasing desire to act or re-evaluate one’s investment position. There isno inductive learning by agents, and they are only coupled via the global marketprice and overall market sentiment. Even incorporating just these two psychological tensions, important stylized facts of real market data, including fat-tails, excesskurtosis, uncorrelated price returns and clustered volatility over the timescale of afew days, are reproduced. By then introducing an additional parameter that amplifies the effect of externally generated market noise during times of extreme marketsentiment, long-time volatility correlations can also be recovered.Keywords: investor psychology, volatility clustering, kurtosis, herding1IntroductionFor many years it has been apparent that models of financial markets using sets of standard assumptions, often known as efficient market hypotheses (EMH), are not capableof reproducing important features of observed market behavior. This manifests itselfmost clearly in the real-world phenomena of non-Gaussian market statistics such as fattails, excess kurtosis and volatility clustering (and the corresponding market bubbles andcrashes). The EMH allow for closed-form mathematical solutions to certain fundamental1Department of Economics, University of Strathclyde, Sir William Duncan Building, 130 RottenrowGlasgow G4 0GE, Scotland, UK2Department of Mathematics, University of Strathclyde, Livingstone Tower, 26 Richmond Street,Glasgow G1 1XH, Scotland, UK3(corresponding author) Department of Mathematical Sciences, George Mason University, MS 3F2,4400 University Drive, Fairfax, VA 22030 USA4Department of Mathematical Sciences, George Mason University, MS 3F2, 4400 University Drive,Fairfax, VA 22030 USA1
problems, such as the pricing of plain vanilla European options [4]. Increasingly however,attention has shifted towards trying to model more realistic market behavior.There are two basic approaches to this modeling problem. The ‘top-down’ approach isto try and suitably perturb efficient-market models and/or their solutions, based upon observed historical deviations from the predicted market behavior. However the universalityof such non-Gaussian statistics across differing financial products, cultures and tradingrules suggests that basic human psychology is an underlying cause. Thus the ‘bottom-up’approach is to try and mimic the ways in which the EMH are violated by individualmarket participants. There are many such agent-based market models in the literature([26, 42, 3, 24, 28, 29, 30, 31, 16, 8, 38, 20, 5, 25, 18, 19, 27, 41] provides a representativeselection that can be mined for yet further references). The problem has, in particular,captured the attention of statistical physicists because of the strong similarities to spinmodels of magnetization, such as the Ising model. Our models are also agent-based andwe start by briefly justifying our overall approach before providing details of the modelsand numerical simulations in the remainder of the paper.There are various versions of the EMH (see [13, 14] and standard texts on mathematical finance) which are often classified as being either strong, semi-strong or weak. Inthe strong version, market prices reflect all the information relevant to the determination of the asset price, including insider-information. The semi-strong form includes justpublicly-available information in the information set. In the weak form, the informationset incorporates only information on the past behaviour of asset prices. At the individuallevel, the key assumption is that market participants are ‘rational’ in the sense that theymaximize ‘well-behaved’ expected utility functions: when they receive new informationthey update their beliefs correctly according to Bayes’ law. At the aggregate level, thekey assumption is that of Markovian Markets:All new information is acted upon instantaneously so that the current market price reflects all previously known data, implying that future prices are independent of the markethistory.In what follows, we provide a class of mathematical models that violate the EMHpostulates in a self-consistent and psychologically-plausible manner. This is achievedby endowing our hypothetical agents with minimal ‘personalities’ that determine theirreaction to such sources of emotion as investing performance (relative to the marketaverage or investor expectations, say), inaction (the increasing urge to modify or reevaluate one’s position) and ‘cowardice’ (the discomfort caused by being in the minorityat any given time, often referred to in the literature as the ‘herding tendency’ or imitativebehavior [2]). Each agent reacts by re-evaluating their market position whenever one ofthese emotional levels breaches their individual tolerance level. Thus we have replacedperfect rationality by ‘bounded rationality’ (in the sense of Simon [37]). An immediateconsequence of this approach is that the history-dependent nature of agents’ emotionallevel(s) leads to non-Markovian market processes.A major motivation for this work was to develop models that are as simple as possible,but which are still capable of reproducing the non-Gaussian market statistics observed in2
real markets. One major simplification is the absence of any ‘spatial’ relationships betweenagents and interactions between ‘neighboring’ individual agents. Instead agents are onlycoupled via the overall market sentiment and the global market price, which itself is partlydetermined by the market sentiment via an invocation of the law of supply and demand.This simplifies the models considerably since no spatial structure (and all the associatedassumptions, parameters etc) needs to be introduced. A further simplification is theabsence of any inductive learning by the agents. Inductive learning is a common featureof such heterogeneous agent models, especially in the modeling of minority games (see forexample [1, 6, 7] and the econophysics forum at http://www.unifr.ch/econophysics/ ).A key observation of the work presented here is that, even without modeling these effects,excess kurtosis, fat-tails and volatility clustering are observed to a significant degree, inbroad agreement with real market data.It should be emphasized that it is not our intention here to simulate actual historicaldata or to make specific predictions. Nor do we contend that all participants in any givenmarket at all times can be modeled in the manner we propose. In real markets somegroups of agents may indeed be better modeled by including local spatial coupling and/orinductive learning strategies. However, reacting to certain fundamental psychologicalpressures is a basic human trait and, as such, the effects of this behaviour need to beunderstood and appreciated. Thus the approach taken here is one of experimentation andanalysis on models that are as simple as possible, consistent with underlying reasonableassumptions on human psychology. This allows us to isolate the effects of different formsof human ‘bounded rationality’ and their consequences for market statistics and aggregatebehaviour. We regard the ‘caricature’ nature of these models (and the very small numberof critical parameters) as an advantage rather than a drawback. Isolating phenomenawithin a minimalist framework has often proved to be the key to understanding the sameevents in more realistic environments.The paper is organized as follows. In Section 2 we introduce a base model that incorporates just two sources of tension. The first is ‘cowardice’ (the increasing stress causedby being in the minority position) and the second is ‘inaction’ which is the increasing urgeto act or re-evaluate one’s position since the last decision. The inaction tension also introduces a form of hysteresis into the model, and this is briefly discussed. We then describevarious ways in which the base model can be modified. In Section 3 we present numericalsimulations which forcefully demonstrate the non-Gaussian nature of the resulting marketstatistics, in particular, the generation of fat-tails and short-time volatility correlations.An interesting observation is that if the cowardice tension is excluded then the volatilityclustering and excess kurtosis vanish. Thus the herding tendency can be directly linkedto the existence of these phenomena, at least within this class of models. Finally, weshow that heteroskedasticity, and the corresponding long-time volatility correlations, canbe introduced simply by allowing the effect of new market information to be a functionof market sentiment. The resulting model thus reproduces the most important observed‘stylized facts’ of market data.3
2The ModelWe now describe an initial model, incorporating tension thresholds, that has been chosenfor its simplicity. The system is evolved in discrete timesteps of length h and there are Minvestors, all of equal weight in the market, who can be either long or short in the market(represented by 1 and 1 respectively) over each time interval. Whenever a particulartension reaches an agent’s pre-defined tolerance level, then that agent will be forced toswitch position in order to eliminate that tension (a closely-related model, applied to theclassic El Farol bar problem [1], can be found at [9]).We incorporate just two sources of psychological tension and describe both of them indetail before providing the necessary mathematical formulation. The first tension, whichwe are referring to as ‘cowardice’, is the increasing stress that an agent feels while theyare in the minority position. We assume that over each time interval, the cowardicetension level of an agent who is in the minority is increased by an amount proportionalto the magnitude of the difference in the overall long/short positions. When this agent’stolerance threshold is exceeded, the agent will switch positions to (attempt to) join themajority. At that time the cowardice tension is reset to zero since that participant has nowextinguished that particular source of tension. Agents with a lower cowardice tolerancecan, alternatively, be interpreted as ‘momentum traders’ who attempt to ride waves ofmarket exuberance or gloom.The second included tension is caused by ‘inaction’ of the participant. There areseveral ways of incorporating such a tension into the model. The most obvious is simplyto measure the length of time since the investor last acted and then force a re-evaluationwhen that interval becomes too large. However this does not take into account fluctuationsin the market price. An investor may be perfectly happy to stay put for a long time ina flat market. It is more reasonable to suppose that the investor will switch due toinaction whenever the price moves by a certain percentage, up or down, from the price atwhich they last switched. This percentage can then be regarded as an inaction threshold.Specifically, if investor i last made a switch when the market price was Pi then she willnext be forced to switch as soon as the price leaves the interval [Pi (1 Hi ), Pi (1 Hi )]where 100 Hi represents her tolerance level expressed as a percentage. Since we shall beusing a geometric pricing model, we instead use the interval [Pi /(1 Hi ), Pi (1 Hi )] (thedifference between the two is negligible for small Hi ). Note that we are not taking intoaccount whether the investor made or lost money. In other words this switching representseither ‘cutting one’s losses’ or ‘taking one’s profits’, depending upon the situation, andis symmetric with respect to both. Experimental and other evidence [12, 22, 32] hasshown that this is not the case. However, we consider this observed asymmetry betweeninvestors’ reactions to profits and losses to be a minor effect at this stage of the modelingprocess. It can be easily incorporated into a more complex model by, for example, shiftingthe intervals [Pi /(1 Hi ), Pi (1 Hi )] so that they are no longer log-symmetric about thelast decision price.The above modeling of the inaction tension can be regarded as a form of hysteresis4
[10]. Resetting the price of the ith investor has the effect of introducing a price rangewithin which that investor is comfortable with their current position (ignoring, of course,the cowardice tension). This range then moves, shadowing the market price, as the system evolves and the investor switches positions. Furthermore, the inaction tension, andthe existence of the above dynamic price ranges, is closely related to other economicand psychological factors. For example, the inclusion of transaction costs (that preventagents from switching positions arbitrarily often) will result in very similar hysteresis intervals [39][Volume I]. Also, the inaction tension can be linked to the notion of ‘anchoring’[23] whereby investors’ subsequent behaviour is dependent upon some, perhaps arbitrary,previous value.Both the above tensions are recognizably ‘human’. However, it might be argued thatthe above psychological considerations apply most naturally to non-professional investors.Whether or not this is the case, it is also interesting to consider some other motivations ofprofessional investors and fund-managers. Such professionals, who are rewarded (or fired)according to the performance of the funds under their control, can, if they are operatinga managed fund, want to be seen to be doing something, even if they have no particularjustification for doing it. Or, in the case of a mainly tracker-fund, they may not want todraw attention to themselves by standing apart from the crowd for too long.In order to isolate the effects of the cowardice and inaction propensities we abstractfrom the institutional detail of trading arrangements. Typically trades are conducted viamarket orders, whereby trades are conducted more or less immediately at the best available price; or via limit orders, where a worst allowable price is specified, and the ordersare stored in a queue or limit order book if they fail to trigger an immediate transaction.As demonstrated in [11], non-trivial properties emerge from such a more realistic specification of how prices evolve in an order-based market. It would be interesting to see howinvestor psychology interacts with market and limit orders in the price change process,but this is beyond the purpose and scope of the present paper.We now introduce some notation and define a model based upon the above considerations. The state (long or short) of the ith investor over the nth time interval is denotedby si (n) 1 andM1 Xsi (n)σ(n) M i 1is a measure of the ratio of long to short investors. A value of σ closer to -1 thus denotesa bearish market while a value closer to 1 denotes a bullish one. The market price atthe end of the nth time interval is denoted by p(n) and updated via³ p(n 1) p(n) exph W (n) κ σ(n)(2.1)where W (n) is a standard Gaussian random variable that represents the creation ofnew, uncorrelated and globally available, information over that time period. Note thatthe timestep h is measured in units where h 1 corresponds to the interval over whichthe random variable W (n) has unit variance. The variable σ(n) σ(n) σ(n 1) is5
the most recent change in market sentiment and the constant κ 0 determines the effectthat a single agent has on the market price — the larger the value of κ, the more themarket price is influenced by internal market dynamics as opposed to the generation ofnew market information. This linear dependence of the log-return rate on change in market sentiment has been used previously in many other agent-based models, even thoughempirical evidence [33] suggests a concave dependence of market price on supply/demand.In addition, a ‘fundamental price’ W (n) can be determined from the information stream W (n) by setting κ 0 in (2.1) and iterating. It is valuable to compare W (n) and p(n)in simulations as this helps identify extended periods of price deviations due to investorsentiment.Based on the new price in (2.1), the tension levels and states of all the participantsare updated as follows. Let the ith participant have inaction and cowardice thresholdsHi 0 and Ci 0 respectively, assigned at the start from predetermined (possibly joint)probability distributions. Then our rules for updating tensions and inducing switchingare:1. The cowardice level for investor i at time n is defined by ci (n), and is updated byapplyingci (n 1) ci (n) h σ(n) if si (n)σ(n) 0ci (n 1) ci (n)otherwise.(2.2)(2.3)2. Let Pi be the price at which the ith investor last switched. If either p(n 1) 6 [Pi /(1 Hi ), Pi (1 Hi )] or ci Ci (or both) then the long/short position of theinvestor is reversed, Pi is reset to the current price and the cowardice tension is alsoreset to zero.Note that the factor h in the updating of the cowardice tension (2.2) takes into accountthe length of time that the participant is in the minority, so that the model is independentof the (somewhat arbitrary) timestep used. Also, the cowardice level of all investors inthe majority remains unchanged, while the levels for all minority investors are increasedby the same amount h σ(n) (the differences between investors’ responses are due to theirdifferent threshold levels Ci ).We now make some important remarks about the above caricature model, henceforthreferred to as the base model. These take the form of a list of some of the most significantassumptions that have been made, together with suggestions as to how these could berelaxed in future models. Many other psychological tensions could be included, for example ‘contrariness’which can be thought of as an ‘anti-herding’ tendency caused by an increasing beliefthat the majority market sentiment is about to switch. This contrariness tensionhas not been incorporated into the base model because its effect is, to a large degree,replicated by the inaction tension: when an investor is in the majority her cowardice6
tension level stops increasing and, unless the market sentiment switches sign first,her next switching (which will be due to the inaction tension) can be interpreted asa belief that the market is about to switch. The mechanism for updating the cowardice tensions has, as with much else in thebase model, been chosen to be as simple as possible. A more realistic algorithmcould perhaps allow the cowardice tension level to subside while an agent is inthe majority, or permit some other complex interaction between the two includedtension levels. In (2.2) it is implicitly assumed that every agent correctly perceives the marketsentiment to be σ(n). In practice, such knowledge is likely to be imperfect, gleanedas it is from a mix of trading-floor statistics and chatter, and numerous sentimentsurveys, indices and reports. This could be more realistically simulated by definingan individual σi (n) for each agent by simply applying some random quantity to σ(n).If a spatial structure is introduced onto the set of agents, then a more complicatedmodel could, for example, adapt the cowardice tension so that agents are affectedby the sentiment of their neighbours rather than the market as a whole. However,one of the key motivations for the base model is the absence of any such spatialstructure. Each agent is forced to switch, with probability 1, whenever a threshold is reached.This can be modified so that there is a non-zero chance of not switching whenevera re-evaluation occurs. A market drift (which could reflect either the risk-free interest rate plus the equityrisk premium, or the expected rate of return) is easily incorporated into the modelby modifying W (n) and the price thresholds of the inaction tension so that theyare time-dependent and relative to the drift. However this change does not alterthe results significantly and so has been ignored for the sake of clarity. All agents are assumed to be of equal weight in the market. However, obviousmodifications allow for a Pareto (power-law) distribution of agent sizes (see, forexample, [34] for models incorporating such wealth distributions). We assume that every participant is able to carry out any transaction they havedecided upon. In particular, we do not attempt to match up buyers with sellers,specify the trading rules in operation, or incorporate effects due to margin calls andlimited cash supplies. This last point is especially noteworthy as it could be modeled by an additional tension that might significantly affect the market dynamics,especially during market corrections. Isolating the effects of such a change wouldbe an interesting application of the modeling approach taken in this paper. As mentioned earlier, the base model is perfectly symmetric with respect to profitsand losses. In fact, since the profit-and-loss history does not directly affect an agent’sdecision-making, it need not even be recorded. However, it is a simple matter todevelop related models where this symmetry is broken.7
3Numerical simulationsWe now choose parameters for a numerical investigation of the base model. The firstparameter to be fixed is the timestep h and, for the simulations presented here, we wishthis to correspond approximately to one trading day. There are numerous market studiesin the literature that calculate standard deviations of price returns over various timeperiods. However, we prefer not to directly quote any such values for the following tworeasons. Firstly, we wish to emphasize that the base model is a caricature based uponfundamental psychological considerations and not upon a particular financial product ormarket. Secondly, the value assigned to h reflects only the market price fluctuations due tothe information stream (i.e. excluding market sentiment) and this number can be boundedfrom above, but not inferred, from market data alone. For these reasons, we choose thestandard deviation of daily returns in the fundamental price W (n) to be approximately0.6–0.7%. This range seems to be consistent with many different applications and leadsus to choose h 0.00004. Our simulations will be over 10000 timesteps which, given thatthere are approximately 250 trading days in a year, corresponds to a period of about 40years.The above choice of timescale now determines the ranges of sensible values for theother parameters in the model. In particular it places limits on the fastest effects thatcan be modeled. For example, noise traders that operate on the timescale of minutes orhours are now excluded from being represented directly as agents in the model (althoughtheir effects can be interpreted as having been incorporated into the forcing term W (n)).We thus choose the inaction threshold for the ith participant from a uniform distributionover the range 10% to 30%. Similarly we assume that the typical participant will switchdue to cowardice over timescales ranging from weeks to several months, and so Ci ispicked from the uniform distribution over the interval [0.001, 0.004]. Notwithstanding ourearlier comments regarding managed funds and tracker funds, we suppose that agentswith a lower cowardice threshold will also have a lower inaction threshold. Such agentswill switch more often and so are more ‘short-term’ than investors with higher thresholds.Therefore, to fix the thresholds for the ith agent, a single random variable zi is chosenfrom the uniform distribution on [0, 1] and the thresholds are determined byCi 0.001 0.003zi ,Hi 0.1 0.2zi .(3.1)The parameter κ is more difficult to fix a priori. However, trial-and-error revealed that avalue of κ 0.2 results in market prices that deviate from the fundamental price W (t)to a significant degree, while still remaining highly-correlated with it.At this point, we note that the model contains two qualitatively different types ofparameter. The first are the pure numbers h and κ. The second are the joint probability distributions of the cowardice and inaction thresholds. The model is, predictably,independent of changes in h (provided that h remains small enough). However, at leastqualitatively , it appears to be very robust with respect to changes in κ and the probability distributions. In particular, the numerical results shown below are not the resultof our choice of correlated threshold distributions. As an example, if the cowardice and8
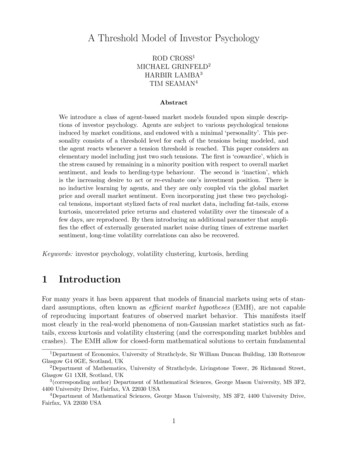
inaction thresholds for the ith agent are chosen from the same distributions as before butusing two independent random variables zC,i and zH,i , then qualitatively indistinguishableresults are obtained. Of course the true situation probably lies somewhere between thesetwo simplified extremes and future work by experimental economists could, in principle,provide better estimates for such joint distributions.Results from a typical simulation are shown in Figure 1. There are M 100 agentswith threshold values generated from the above distribution. Their initial tension levelsare randomly assigned, consistent with their threshold levels, as are their initial states 1. Figure 1a) shows the market sentiment as a function of time. It can be seen thatthere are dramatic shifts in overall sentiment, typically occurring every few years. Thisis interesting since individual participants may be switching every few weeks or months.Note that there are periods where almost every agent in our model is taking the sameposition. This is perhaps too extreme, and is due to our modeling every participant inthe market in a similar fashion. Nonetheless it seems plausible that in a real market therewill be periods during which the vast majority of investors whose actions are dominatedby the above sources of tension will be taking the same position in the market. 1 as a function of time. Time inFigure 1b) shows the daily price returns pn 1pntervals containing a few exceptional daily price moves of the order of 10%, can be seen.These correspond to large and dramatic shifts in market sentiment. Figure 1c) plots thefundamental price W (t) (dashed line) versus the market price p(t) (solid line). These (detrended) prices are plotted on a linear scale to accentuate the differences between them,even though a geometric pricing model is being used. Figure 1d) plots the percentage ofagents that switched market position at the end of each time period and is thus a measureof the market activity.Figure 1e) shows a cumulative log-plot of the number of daily returns (positive ornegative) that exceed a certain value, from 0–20%. If the daily returns followed a Gaussiandistribution then an approximate straight line would be expected. Instead, there is aclear exponential distribution for small daily returns (up to approximately 2%) but thenclear evidence of an excess of large daily fluctuations. This is in agreement with marketobservations. The kurtosis of the daily market returns was also computed over many suchruns. It is a highly variable quantity, depending as it does upon the precise number andmagnitude of the largest daily fluctuations, but typically ranged between 10 and 100 (fora Gaussian distribution the value should be 3), thus displaying excess kurtosis. Finally,figure 1f) shows the autocorrelations of both the daily market returns and their absolutevalue (the volatility). The market returns are completely uncorrelated over intervals ofa day or longer, as indicated by the lower line, and this is also in accordance with realmarket time series where these autocorrelations typically vanish over timescales of morethan a few minutes. On the other hand, volatility correlations are observed for intervalsupto about 4 days – and this is evidence of volatility clustering in the model. However, realmarket data usually reveal volatility correlations decaying slowly over weeks or months[21, 15, 31]. At the end of this section we shall introduce a simple addition to the basemodel that introduces volatility clustering over these longer timescales.9
0.2a)Price ChangesSentiment10.50 0.5 10200040006000Time80000.10 ime800010000204060Time Delay8010050Activity 0.5e)AutocorrelationsCumulative Distribution0.5210010051015Daily Returns (%)f)0 0.5200Figure 1: Numerical simulation of the base model.Before continuing, we note that the dynamics of the model does not depend significantly on the number of agents M . To demonstrate this, the base model was run with1000 agents, and the results are shown in Figure 2. The two sets of pictures display verysimilar ranges and timescales for all the important market statistics, and also qualitativelysimilar behaviour. Thus for the remaining simulations we shall revert to using 100 agents.In order to ascertain the effect of herding in the model, we now remove the cowardicetension by redefining all the cowardice thresholds Ci . Keeping all other parametervalues the same, we observe results typified by Figure 3. The most obvious change fromFigure 1 is the complete absence of extreme events in the distribution of daily price returns.Also, although the volume of trading is comparable to before, the vast majority of tradescancel each other and the market sentiment remains very close to zero. In turn, the marketreturn statistics are essentially Gaussian, as displayed
induced by market conditions, and endowed with a minimal ‘personality’. This per-sonality consists of a threshold level for each of the tensions being modeled, and the agent reacts whenever a tension threshold is reached. This paper considers an elementary model including