Transcription
User Manual III:Revenue Cycle Cube BasicsAuthors:USC Business Intelligence TeamSummary:The Revenue Cycle portion of MARS encompasses all clinical activity transacted in both IDX 4.0 andGECB 4.3 once it is recognized as a receivable (i.e. it hits the billing and accounts receivable (B/AR)module), from July 2006 to present day. This manual documents the key date and FSC components inthe MARS Revenue Cycle analytic database as well as explaining their use so you can derive the mostmeaningful and accurate analyses in answering your business inquiries.The nature of business dictates that in order for analytic databases to remain a valuable asset, they consistently undergodevelopment. As business requirements change over time, we will be adding new features or changing existing ones, thereforeplease check back with the MARS website frequently in order to verify that you have the most recent version of the excelworkbooks and this document.Document Version ControlVersionDate1.05/22/20111.011/20/2013Change AuthorLuis MuenchLuis MuenchChange DescriptionDocument ReleasedFinalize Key Concepts
CONTENTSINTRODUCTION . 3What is MARS?.3What is BI? .3What is an Analytic Database? .3Revenue Cycle Cube Organization .4Analytic Themes (Perspectives) .4KEY CONCEPTS . 5WHY AM I READING THIS?.5REVENUE CYCLE DIMENSIONS . 6DATE DIMENSIONS IN MARS .6Date Dimensions Are Event Based .6Dimension Structure - Hierarchies .6The 3 Revenue Cycle Date Dimensions .7Comparing Revenue Cycle Date Dimensions .9Posting Lag and Date Dimensions .10Charge Correction and Date Dimensions .11Date Dimension Usage Scenarios.12FSC DIMENSIONS IN MARS .14FSC Dimension Structure .14Comparing Revenue Cycle FSC Dimensions .15OTHER REPORT CONSIDERATIONS .16View Headings .16Group .16Department .16Source System .16SUMMARY . 17
Revenue Cycle Cube DocumentationManagement Analytic Reporting SystemINTRODUCTIONWhat is MARS?MARS (Management Analytic Reporting System) is simply an analytic tool whose goal is to provideeveryday business managers, clinical administrators and executive leadership insight into theperformance of USC’s clinical enterprise. This analytic tool is made up of many processes andcomponents that together comprise a performance management platform; that is, it provides a centralrepository for data that is extracted from multiple data sources, cleansed, and made available as astandardized data set, and presented to users throughout the enterprise in various modalities.What is BI?Business Intelligence refers to the next stage in the business reporting paradigm that emphasizes userinvolvement in report generation, and consequently a broader and deeper understanding of businessrules and management best practices across the enterprise. No longer captives of the ‘canned report’,users are free, through the concept of ‘Self-service BI’ and analytic databases, to explore the businessenvironment on their own schedule and are rewarded with real-time response and the data necessaryto make fact-based decisions.What is an Analytic Database?At the highest level, MARS is composed of multidimensional analytic databases. These analyticdatabases differ from other databases you may be familiar with (such as relational databases createdusing Microsoft Access or SQL Server) in that they are designed from the ground up for reportingpurposes and thus consist of pre-aggregated data structures, allowing for the quick and painless analysisof millions of records with instantaneous response times.Leveraging Microsoft Excel as the main tool used to interact with analytic databases (also known as‘cubes’) is welcome news for business users eager to apply their existing knowledge on a tool theyalready use, and means little or no training or implementation costs beyond what users already knowand have on their PC's.3Introduction USC Care Medical Group Inc.
Revenue Cycle Cube DocumentationManagement Analytic Reporting SystemRevenue Cycle Cube OrganizationAs mentioned, the Revenue Cycle cube (dealing with billed clinical activity) is designed to be browsedusing Microsoft Excel, using the built-in Pivot Table feature, which will allowFigure 1: Measuresyou to interact with the measures and dimensions of the cube. Measures arethe numerical facts about the business that we want to track, such ascharges, payments, procedure counts, etc. If you can count, add or subtractit, it’s a measure. In MARS, measures are subdivided into measure groupsthat distinguish the source of the measure. And for measure groups withnumerous or distinct kinds of measures, we have grouped them into subject-oriented folders, making them easier to manage (See Figure 1: Measures).Dimensions are the ways that you can use to filter, group and label the measures, and represent aspecific entity such as provider, department, location, date, etc. Most dimensions in MARS arecomposed of hierarchies that are made up of levels. Date dimensions are often used to explainhierarchies because they are composed of hierarchies with levels that most people are familiar with:that years contain quarters, quarters contain months, and months contain days, etc. A simple definitionof a hierarchy then would be that the top level contains all succeeding 'child' levels and that each childlevel only has one 'parent' level in that hierarchy (there are many January 1st’s but only one January 1,2011). It is no coincidence that as time plays a central role in our lives, it would also play a central rolein creating meaningful reports out of the data accessible through MARS. The single most importantconsideration you should give when sitting down to create a report in MARS is the selection of a datedimension, and the availability of those date dimensions will be managed by the particular perspectiveof MARS you are currently working with.Analytic Themes (Perspectives)In order to make the analysis of a complex enterprise possible, we have broken down the variouspatient tracking and billing activities into major analytic themes, which are called perspectives in MARS.These perspectives limit the available measures and dimensions to only contain those that areapplicable for that particular analytic purpose. For instance, the Scheduling perspective (reflectingpatient appointment scheduling activity) does not contain a Date of Posting dimension because that isout of scope for that particular activity (it belongs to the Revenue Cycle perspective, the main focus ofthis document).4Introduction USC Care Medical Group Inc.
Revenue Cycle Cube DocumentationManagement Analytic Reporting SystemKEY CONCEPTSWhy am I reading this?Imagine that you have access to over 30 million BAR line items covering half a decade of transactionalbilling activity. Now imagine that looking through that MOUNTAIN of data is as easy as clicking anddragging items from a pivot table list in Excel. Getting the data is no longer the problem, but makingsure it is correct or it is telling you what you need – that part you are still responsible for.This document is structured to introduce the basics and the key concepts. The basics you can pick up inan afternoon (or less if you are already familiar with Excel pivot tables). The key concepts are not hard tograsp but, because of the large number of possible combinations, can get complex. To help defray thatcomplexity, we have created Excel starter reports (available on the MARS website) for each of the“analytic paths” you are most likely to need to report on (such as charge activity, provider activity, etc.).So what are the key concepts then? They have to do with the best way to get the answer you are lookingfor, which would also be how the Excel report is set up. I am referring to the dimensions you will use tofilter and label your report. More than likely you will only be interested in a narrow sliver of the data –therefore you will filter that MOUNTAIN we spoke of to only give you the dates you care about by usinga date dimension but will you want to run your report by the Date of Service or the Date of Posting?How are date dimensions affected by posting lag and charge correction? What about FSC? Do you wantto run your report by the original FSC, the invoice FSC or the transaction FSC?Although the Excel starter reports available on the website will accurately set you on the correct analyticpath, you will still want to understand the ramifications of these choices so that you can not only “get itright” but also understand how these choices shape our data and the answers we glean from it. Readthis document at least once so you understand the scope, but keep it as a reference so that you can goback when you need to know how different choices in date dimensions or insurer Financial StatusClassifications (FSC) will affect the insight you seek.5Key Concepts USC Care Medical Group Inc.
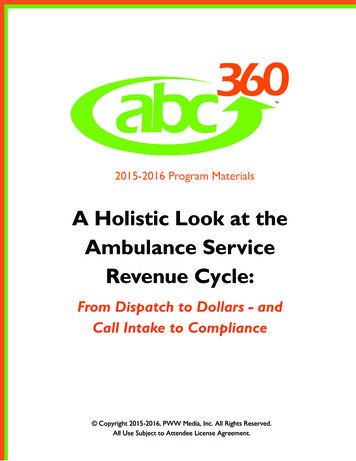
Revenue Cycle Cube DocumentationManagement Analytic Reporting SystemREVENUE CYCLE DIMENSIONSDate Dimensions in MARSAs mentioned previously, dimensions are the components in MARS that allow you to group, label andfilter the data (such as charges and payments). In other words, dimensions answer the questions likewho, where, and specifically for the date dimension, when something happened.Date Dimensions Are Event BasedAs you would expect, date dimensions allow you to slice business facts by date components like days,months, quarters, years, etc. Each event, such as the date of service or the date a payment posted intothe system is considered a separate event and therefore has its own date dimension. Some guidingprinciples in helping you decide on which dimension to use are covered in the following sections.Dimension Structure - HierarchiesDimensions contain attributes, such as year, quarter, month, etc. In order to make these attributes moreuseful, MARS organizes these attributes as levels within hierarchies. Allowing lower levels to becontained (or summarized) within higher levels is what makes hierarchies valuable when performinganalysis over millions of transactions, because detail data can now be summarized at various levels of ahierarchy. Hierarchies are also the way MARS optimizes query responsiveness by pre-aggregating (precalculating and storing) values at every level of a hierarchy, so that when a user decides to compare 4Figure 2: A Date Hierarchyyears of data (at the year level) the result can be returned in amatter of seconds. If the user then decides that they want to seethat data broken out by quarters (or months, or even days), thefact that all levels have been pre-aggregated means that thequery will again only take a couple of seconds to complete whenthe user drills in by clicking the ‘plus’ icon ( ) on the hierarchymembers (See Figure 2: A Date Hierarchy.) It is this ability tocustomize and drill in, working at the speed of your inquiry thatmakes reporting with an analytic database a lot more valuablethan traditional static reports.6Revenue Cycle Dimensions USC Care Medical Group Inc.
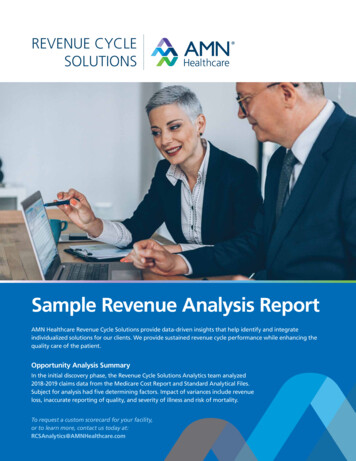
Revenue Cycle Cube DocumentationManagement Analytic Reporting SystemFigure 3: Roll-Up GroupingAlthough not pre-aggregated by the system, youcan create custom ‘hierarchy-like’ groupings thatare useful in summarizing your analytic goal. Anytime you stack dimension members in the Row orColumn Label boxes of the Pivot Table Field Listwith 2 or more members, you are creating areport that allows you to drill in to successivelevels of detail, much like you can usinghierarchies (in this case, all Day Name activity will roll up to Fiscal Year - See Figure 3: Roll-UpGrouping).The 3 Revenue Cycle Date DimensionsThe Revenue Cycle perspective contains 3 date dimensions: Date of Service, Date of Posting and DateInvoice Created. Although each one of these date dimensions reflects a separate timeline (when thepatient is seen by a provider, when a transaction is recognized as a receivable, and when the invoice iscreated) they all contain the same dimensional structure. In other words, although each one of theseFigure 4: Date Dimension Calendarsdate dimensions are used for different analytic purposes, they allhave the same number of hierarchies and all the hierarchies andother date components are structured in a similar fashion. Sincethe date dimensions are identical in structure (but not purpose),each component in them is preceded by the dimension’s fullname in order to maintain its uniqueness. So, if you want tobreak out data by the fiscal year, when you use the Fiscal Yearcomponent you will see it listed as “Date of Posting.Fiscal Year”.This helps insure you do not inadvertently mix components fromthe Date of Posting dimension with components of the Date ofService dimension (mixing members from different datedimensions can be done but is an advanced topic and only makes sense in a couple of analytic cases –most of the time it will just yield unexpected results, something you want to avoid.)7Revenue Cycle Dimensions USC Care Medical Group Inc.
Revenue Cycle Cube DocumentationManagement Analytic Reporting SystemAll 3 Revenue Cycle date dimensions are composed of 2 calendars, 4 hierarchies, and 18 individual datecomponents. The Civil Calendar starts January 1st and ends on December 31st, while the Fiscal Calendarstarts on July 1st and ends on June 30th of the following year, reflecting our financial reporting period.Each calendar folder contains 2 hierarchies that are organized with the following levels: in the CivilCalendar there is Calendar Hierarchy which is arranged with Calendar Year, Calendar Quarter, CalendarMonth and Calendar Date levels. The second hierarchy, Calendar Yr-Mth Hierarchy is just an abridgedversion of the first hierarchy and contains only 2 levels, Calendar Year and Calendar Month, useful if youknow you will not need to break out data into quarters or drill down to a specific date. The FiscalCalendar folder likewise has 2 hierarchies that mirror the civil calendar, but are based on our enterprisefiscal year. Fiscal Hierarchy contains Fiscal Year, Fiscal Quarter, Fiscal Month, and Fiscal Date. Similarly,Fiscal Yr-Mth Hierarchy is an abridged version containing only Fiscal Year and Fiscal Month levels (referto Figure 4: Date Dimension Calendars).Figure 5: More Date ComponentsHaving 2 predefined hierarchies is handy, but what happens if youhave to customize a report that only includes month and date, orwhat if you need other date-related components, like the day ofmonth or the day of week? If you select the More Fields button inany dimension, you will see a list of all available dimensioncomponents, some which were used to create the existinghierarchies and others which you will use to customize your reportsin a variety of useful ways (refer to Figure 5: More DateComponents). Just as the revenue cycle date dimensions aredivided into civil and fiscal calendars, so is each set of components:you will notice that all civil calendar components begin with theword ‘Calendar’, and all fiscal components begin with the word‘Fiscal’. When you are performing analysis using a particularcalendar, you should only use components from that calendar,exceptions being Day Name, Day of Month, Day of Week and MonthName Initial, which are not calendar specific, and can be used with either calendar.8Revenue Cycle Dimensions USC Care Medical Group Inc.
Revenue Cycle Cube DocumentationFigure 6: Quarter vs. Quarter NameManagement Analytic Reporting SystemHow each of these components work is fairly selfexplanatory except Month Name and Quarter Name (forboth calendars). The standard Month and Quartercomponents follow our hierarchy rule: the top levelcontains all succeeding 'child' levels and each child levelonly has one 'parent' level. Each Month and Quarterbelong to one and only one year, and they are labeled assuch (FQ1 2010, FQ2 2010, etc.), creating 4 quartermembers (and 12 month members) for each year. On theother hand, Quarter Name only has 4 members for allyears (Quarter 1 through 4), and Month Name only has 12.In order to create a line chart that compared quarterlyactivity year over year, you would have to use QuarterName which will display all ‘Quarter 1’ activity together. You can then use Year as a series to display oneyear over the other, creating a more impactful comparison (see Figure 6: Quarter vs. Quarter Name).Comparing Revenue Cycle Date DimensionsAs stated previously, the Revenue Cycle perspective allows you to slice, label and filter data with yourchoice of 3 different event timelines: the date of a patient encounter (Date of Service), the date abillable item posted into the practice management system as a receivable (Date of Posting), and a wayof grouping together all transactions in an invoice, regardless of when the service was rendered or whenit posted (Date of Invoice Creation). Deciding on which of these 3 dimensions to use should be the firstconsideration given when you are starting an analytic inquiry because this choice will affect your resultsand the ‘correctness’ of these results will depend on the goal you are trying to accomplish (each datedimension has its strengths and weaknesses). By and large, however, Date of Posting should be used ifyou are reporting on any financial activity or if it is important that your reports tie to existing ‘fiscallyoriented’ reports. You should consider using Date of Service when it is essential that you reflect yourpractice’s seasonality, but you should be aware of the caveats in using either dimension as outlinedbelow. Date of Invoice Creation is a third option that will allow you to match charges to payments,helpful if you need to know how procedures are getting paid from an invoice perspective.9Revenue Cycle Dimensions USC Care Medical Group Inc.
Revenue Cycle Cube DocumentationManagement Analytic Reporting SystemPosting Lag and Date DimensionsThe biggest difference between Date of Service and Date of Posting (besides them reflecting separatetimelines) is in how each dimension reacts to posting lag. Posting lag can be described as the number ofFigure 7: Posting Spread for Date of Service Activitydays it takes a patient encounter fromthe date of service to the date it posts inthe billing system as an accountreceivable. The main benefit of usingDate of Service in your analysis will be inreflecting the practice’s true seasonality; however, because not all charges are available in the system(posting lag) the most recent months to the current month will not reflect all activity. How badly doesposting lag affect analysis by date of service? It depends on department and month, but on average,about 55% of charges will be posted in the same month the service occurred, 35% will be posted in thefollowing month, 6% will be posted 2 months out and the remainder will trickle in over several months(see Figure 7: Posting Spread for Date of Service Activity).Date of Posting, on the other hand, does not suffer from posting lag per se, because its job is to simplyrecord any charges or payments that were entered to BAR during a posting period (note that since theintroduction of GECB 4.3, posting periods are synchronous with calendar months). Since posting periodsare used primarily for financial reporting purposes, activity in that period is finalized at period close andno additional activity ‘trickles in’ over later months. This is beneficial from a reporting standpointbecause it is now possible to compare activity to previous periods with the assurance that a validcomparison is being made, even with the current period (the main drawback when seeing things by dateof service). However, since a particular posting period will contain activity from multiple dates ofservice, it is not possible to infer any clinical seasonality when using the date of posting dimension –what you get instead is simply what posted into the system (irrespective of when the patient was seen).Date of Invoice Creation behaves a little like both the posting and service date dimensions. Since mostinvoices are created as a result of the first posted charge transaction, the posting date and invoicecreation date will be the same, but only for charges. That means that charges by invoice creation dateand posting date will be identical. All other transactions will have their own posting dates but will havethe same invoice creation date as the invoice to which they belong to, making it possible to matchpayments (and any other transactions) to the charges that spawned them. Date of Invoice Creation10Revenue Cycle Dimensions USC Care Medical Group Inc.
Revenue Cycle Cube DocumentationManagement Analytic Reporting Systembehaves like the service date in that other transactions (such as payments) will continue to trickle in asthey are entered in the system until the invoice is closed.Charge Correction and Date DimensionsAnother important difference between Date of Posting and Date of Service dimensions is how they workin the face of invoice charge correction. Charge correction is how GECB 4.3 handles changes to invoicesFigure 8: Invoice Correction Componentsthat have already posted to BAR but need to be corrected.Any material change to an invoice such as a change inprovider, procedure, diagnosis, etc., requires it to gothrough a “charge correction” process which typicallyresults in the automatic creation of two additionalinvoices. Thus, the net result when an invoice is correctedis the existence of 3 invoices in the system for the sameencounter: the original invoice with the ‘mistake’ (voided invoice), a balancing invoice that offsets theoriginal invoice with negative values (voiding invoice), and a new invoice with the corrections - the new‘active’ invoice. There are many other scenarios that may or may not result in the creation of exactly 3invoices (such as the correction of a correction (also known as a ‘Replaced Invoice’) that is beyond thescope of this document). Does charge correction matter? Overall, charge correction only affects 2-3% ofinvoices (see Figure 8: Invoice Correction Components) however it could vary by department or timeperiod, and it will make a material difference if you are trying to tie to GECB (posting date) reports.Figure 9: Invoice CorrectionFor reports created using Date of Service and Date of Invoice Creation,these additional invoices are considered noise and need to be filteredout. The only relevant invoice when looking at things by these 2 datedimensions is the current active invoice. Conversely, when you are usingthe Date of Posting dimension, you will want to keep the charge correction invoices so the voided andvoiding invoices can balance out within their posting period. Keeping the charge corrections is thedefault behavior so when you are using date of posting, you do not need to do anything special.Excluding charge corrections, which you should do when using date of service or invoice creation, isachieved by using the Invoice Correction Hierarchy of the Attributes Invoice dimension as a filter (seeFigure 9: Invoice Correction).11Revenue Cycle Dimensions USC Care Medical Group Inc.
Revenue Cycle Cube DocumentationManagement Analytic Reporting SystemDate Dimension Usage ScenariosIf your analytic goal is to reflect patient encounters as they occurred, you will want to structure yourreport by Date of Service. When you are using date of service (remember to filter out chargeFigure 10: Post Lag Effect on Date of Servicecorrections, keeping only active invoices) youwill get an accurate rendition of the actualclinical activity when it was performed, but youwill only see the clinical activity that has made itinto the system up to the date you lastrefreshed your report. Because of ourorganizational posting lag, it can take a coupleof months (from the most current month) toget the majority of data into the system. Theanalytic bottom line is that if you look at the current month (and up to 2 months back) that data will notbe complete - as it is still being ‘worked’, and you should be cautious about making any inferences forthe 2 or 3 most recent months because you do not have all the activity that took place in those servicedates nor do you know how much of it is still outstanding (see Figure 10: Post Lag Effect on Date ofService, displaying the use of the charge correction hierarchy showing only active invoices and theobvious effect posting lag has on the most recent months depicted for January charges).Figure 11: Post Lag Effect on Date of PostingIf your analytic goal is instead to report onfinancial activity (or clinical activity framedwithin a financial reporting context) morethan likely you will want to use the Date ofPosting dimension. When you are using dateof posting, you will not have to worry aboutdata trickling in after you have run yourreport, but you will have to remember that aposting period contains activity with dates ofservice many months into the past. From a financial analysis standpoint, being able to compare postingperiods does give you an idea of the health of the business by looking at charges that went out andpayments received in each posting period (a ‘cash flow-like’ view) – but it is important to understandthat the clinical activity reflected in a posting period will not be synchronous to actual activity in the12Revenue Cycle Dimensions USC Care Medical Group Inc.
Revenue Cycle Cube DocumentationManagement Analytic Reporting Systempractice. For example, if the practice had a particularly good month in terms of patient visits, dependingon how long it takes to get those encounters into the system your report will probably show moderateincreases over the following 2 or 3 posting periods, which is not what actually happened. Either way youlook at it (by date of posting or service), posting lag is the biggest impediment to getting timelyperformance information out of MARS, and of being able to make accurate assumptions about what istruly going on in the business (see Figure 11: Post Lag Effect on Date of Posting, which shows thatposting lag does not explicitly affect the most recent months since they simply contain activity that wasentered into the system during a posting period. Posting lag affects date of posting implicitly by thespread between the actual date of service and the date when the charge item finally posted).The Date of Invoice Creation dimension is a third option that is sort of a hybrid of the service andposting date dimensions. As its name implies, this dimension brings all transactions back to the invoiceheader’s creation date (which more than likely corresponds with the posting date of the first cha
The 3 Revenue Cycle Date Dimensions The Revenue Cycle perspective contains 3 date dimensions: Date of Service, Date of Posting and Date Invoice Created. Although each one of these date dimensions reflects a separate timeline (when the patient is seen by a provider, when a transaction is recognized as a receivable, and when the invoice is ". the