Transcription
Molecular Vision 2020; 26:76-90 http://www.molvis.org/molvis/v26/76 Received 22 May 2019 Accepted 21 February 2020 Published 25 February 2020 2020 Molecular VisionCell senescence altered the miRNA expression profile in porcineangular aqueous plexus cellsChen Tan,1 Yiyan Yang,2 Maomao Song,1,3 Zhiwei Cao,2 Xinghuai Sun,1,3,4,5 Yuan Lei,1,3 Junyi Chen1,3(Last two authors contributed equally to this work.)Department of Ophthalmology & Visual Science, Eye & ENT Hospital, Shanghai Medical College, Fudan University, Shanghai,China; 2Bioinformatics, School of Life Sciences and Biotechnology, Tongji University; 3Key Laboratory of Myopia, NHFPC(Fudan University), Shanghai, China; 4Shanghai Key Laboratory of Visual Impairment and Restoration (Fudan University),Shanghai, China; 5State Key Laboratory of Medical Neurobiology, Institutes of Brain Science and Collaborative InnovationCenter for Brain Science, Fudan University, Shanghai, China1Purpose: This study investigates the impact of aging on the miRNA expression profile in porcine angular aqueous plexus(AAP) cells, which are the porcine equivalent of human Schlemm’s canal endothelial cells.Methods: AAP endothelial cells were isolated and cultured in physiologic (5% O2) or hyperoxic condition (40% O2) for14 days to induce cell senescence. miRNA and protein expression profiles of control and senescent cells were analyzedwith miRNA microarray and isobaric tags for relative and absolute quantification (iTRAQ), respectively.Results: The miRNA microarray identified 33 differentially expressed miRNAs in senescent cells compared with controls (p 0.05), and quantitative real-time PCR (qRT-PCR) confirmed 12 of them (p 0.05). iTRAQ analysis identified 148upregulated and 222 downregulated proteins (p 0.05, fold change 1.2). Bioinformatics analysis of miRNA microarrayand proteomics data predicted that six out of seven miRNAs are associated with aqueous humor outflow by targetingintegrin and the downstream pathways (Src/Rho kinase, focal adhesion kinase (FAK)/NO-cGMP), and one miRNAmight influence gap junction by targeting the Inositol trisphosphate receptor (IP3R) /Protein kinase C (PKC) pathway.Conclusions: This study identified miRNAs in senescent AAP cells that might regulate aqueous humor outflow bytargeting proteins involved in focal adhesion, cytoskeleton, NO-cGMP signaling, and gap junction.(SIPS) [21]. This model provides a constant increase in reactive oxygen species without the need for additional chemicalor cellular treatments and has relatively low toxicity in thatsustained confluence, and thus, normal post-mitotic conditions were assured throughout the length of the experiment[22-24].Aging is a strong risk factor for developing primary openangle glaucoma (POAG) [1-7]. Schlemm’s canal (SC) innerwall and juxtacanalicular tissue are the main sites of aqueousoutflow resistance [8] which are responsible for the intraocular pressure (IOP) elevation in patients with POAG [8].Senescence of SC and trabecular meshwork (TM) cellshave been implicated in the initiation and progression ofglaucoma [9-13]. The oxidizing species produced and accumulating during cell metabolism can cause molecular damageto the TM cells, which could increase aqueous humor outflowresistance [10,14]. Further, significantly higher levels of DNAoxidation products were observed in the TM of patients withglaucoma, and the level of DNA damage strongly correlatedwith IOP elevation and visual field defects [13,15].Our previous studies showed that cell senescenceinfluenced cell monolayer permeability through cytoskeletal proteins and cell adhesion proteins in porcine angularaqueous plexus (AAP) cells [25]. Moreover, we demonstratedthat senescence reduced the mechanotransduction sensitivityof AAP cells; specifically, the senescent cells were less able torespond to shear stress which should downregulate junctionalproteins to facilitate aqueous humor drainage and maintainIOP homeostasis [12]. Cell senescence also altered eNOS andphosphorylated eNOS, and resulted in reduced NO production [26]. However, the mechanism by which these responseswere regulated remains unknown.Hyperoxia leading to senescence is an established modelof aging which has been widely used in aging research[16-18]. This model has also been investigated in the cells ofthe outflow pathway in the context of glaucoma pathogenesis[10,14,19,20]. This model is based on one of the most acceptedtheories of aging, stress-induced premature senescenceMicroRNAs (miRNAs) are highly conserved non-codingRNAs. They typically negatively regulate protein expression[27] by binding to their target sites in the 3′-untranslatedregion (UTR) of the mRNA. miRNAs are key modulators ofcellular senescence. miRNAs are differentially expressed inCorrespondence to: Junyi Chen, Department of Ophthalmology, 83Fenyang Road, Shanghai, China; email: chenjy@fudan.edu.cn76
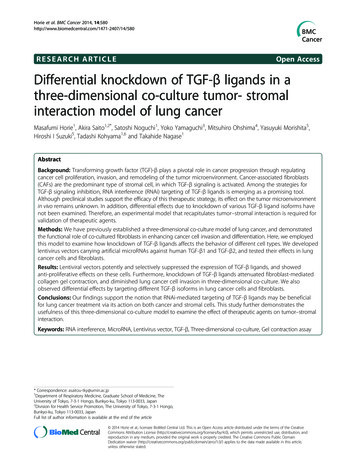
Molecular Vision 2020; 26:76-90 http://www.molvis.org/molvis/v26/76 2020 Molecular Visionsenescent cells, which further implicates them in the implementation of the senescent phenotype [28-30]. The dysregulation of miRNA-governed senescence underlies age-associateddiseases [31-33] and cancer [34]. Researchers reported themiRNA profile in the aqueous humor of patients with glaucoma and identified several differentially expressed miRNAs[35-37]. Further, microRNAs were differentially expressedin the retinas of eyes with advanced glaucomatous damagecompared with normal controls [38]. This evidence suggeststhat miRNA may be important in the pathogenesis of glaucoma and merits further investigation. However, the miRNAexpression profile is not known in senescent Schlemm’s canalendothelial cells.Cell culture: Cell culture AAP endothelial cells were isolated,cultured, and characterized according to an establishedmethod [39]. Briefly, for each cell line, outflow tissue fromten porcine eyes (4- to 6-month-old pigs) was collected. Thecells were allowed to multiply for 8 days and then treatedwith puromycin (4 µg/ml, InvivoGen, San Diego, CA) for 2days. The puromycin-selected cells were similar to humanSchlemm’s canal endothelial cells in that the cells exhibitedcontact inhibition and expressed the same surface markersas those seen in cultured human SC cells and whole porcinetissue (Appendix 1). Three independent cell lines (each cellline came from ten porcine eyes) were used as one biologicalreplicate for microarray assay or iTRAQ analysis.Cell senescence model: Cell senescence was induced by amodel of chronic oxidative stress [20,25]. Cells were culturedunder normobaric hyperoxia condition (40% O2, 5% CO2)for 14 days in a triple-gas incubator (Smart cell, Shanghai,China). Control cultures were grown under physiologicoxygen condition (20% O2, 5%CO2) for 14 days in parallelwith the experimental group of the same cell line. AAP cellswere stained positive for endothelial cell specific markersVE-cadherin and eNOS, and senescence of AAP cells wasconfirmed with β-galactosidase staining (Appendix 1). Theexpression levels of p53 and p21 and cell cycle analysis werealso investigated to ensure cell senescence (Appendix 1).This study aimed to characterize miRNA expressionprofile in senescent AAP cells, which are the porcine equivalent of human SC cells. These results were further correlatedto the protein expression profile with isobaric tags for relativeand absolute quantification (iTRAQ) analysis to identify theirtarget proteins. Bioinformatics analysis revealed the differentially expressed miRNAs may regulate critical pathwaysinvolved in aqueous humor outflow.METHODSExperimental design: This study adhered to the ARVOStatement for Use of Animals in Research. And our researchwas proved by Laboratory Animal Management and EthicCommittee of Eye & ENT Hospital. Porcine AAP cellswere isolated and cultured. Cell senescence was induced byhyperoxia for 2 weeks. miRNA microarray and proteomicsanalyses of normal and senescent AAP cells were performedto identify differential miRNAs and proteins. miRNA andprotein data were correlated with bioinformatics analysis.The workflow of this study is shown in Figure 1.MicroRNA microarray assay: The miRNA microarray analysis was performed three times using three independent cellsamples (each individual cell line came from ten porcine eyes).Total RNA was isolated with an miRNeasy kit (QIAGEN,Shanghai, China). The RNA integrity number (RIN) wasassessed using a Bioanalyzer (Agilent 2100, Shanghai, China)according to the manufacturer’s instructions. It allows visualinspection of RNA integrity to determine the RNA quality.Only samples that achieved an RIN score greater than 9.5were used for further microarray analysis. The miRNAFigure 1. Experimental design andwork flow. After the microarray andproteomics analysis of normal andsenescent aqueous plexus (AAP)cells, bioinformatics analysis wasperformed to determine key GeneOntology (GO) and Kyoto Encyclopedia of Genes and Genomes(KEGG) pathways, and miRNAprotein correlations.77
Molecular Vision 2020; 26:76-90 http://www.molvis.org/molvis/v26/76 2020 Molecular Visionmicroarray analysis was performed three times. In each oneof the biological replicates, miRNA expression was measuredusing eight technical replicates.Cell lysates were processed with radioimmunoprecipitation assay (RIPA) solution. Then, the protein concentrationwas measured using the Bradford method. One hundredmicrograms of protein from each sample was processed foriTRAQ labeling. Then, the proteins were denatured, reduced,alkylated, trypsin digested, and labeled with iTRAQ labeling(8-plex iTRAQ, AB SCIEX, Framingham, MA). The poolediTRAQ-labeled peptides were fractionated with strong cationexchange (SCX) chromatography (Shimadzu LC-20ABHPLC Pump system) using an SCX column containing 5mm particles (4.66250 mm Ultremex column, Phenomenex,Torrance, CA).The miRNA microarray analyses were performed usingdifferent samples by LC Sciences (Houston, TX). (Thesequences are listed in Appendix 2) Four to eight microgramsof total RNA samples were fluorescence labeled and hybridized overnight. Fluorescence signals were collected using alaser scanner (GenePix 4000B, Molecular Devices, San Jose,CA) and digitized (Array-Pro, Media Cybernetics, Rockville,MD). After the background signals were subtracted, data werenormalized using a locally weighted scatterplot smoothing(LOWESS) filter, which is a preferred method for miRNAdata sets [40]. Signals between groups were compared withthe Student t test. To include as many miRNA candidatesas possible, a p value of less than 0.05 without fold-changelimitation was regarded as statistically significant.The eluted peptides were pooled as 20 fractions, desaltedwith the Strata X C18 column (Phenomenex), and vacuumdried. The elute from the Nano Liquid Chromatographysystem (Shimadzu LC-20AD) was coupled to a tandem massspectrometer in an LTQ Orbitrap Velos (ThermoFisher Scientific, San Jose, CA), through an electrospray ionization sourceequipped with a 15 µm ID emitter tip.Quantitative real-time PCR: Quantitative real-time PCR(qRT-PCR) of differentially expressed miRNAs wasperformed using qTOWER 2.2 (Analytik Jena, Jena,Germany) to validate differentially expressed miRNAs(p 0.05) to ensure statistical significance. RNA was extractedfrom three experimental samples and three control sampleswhich were different from those used in the microarrayanalysis. cDNAs were synthesized in 40 μl reaction volume.The primer sequences are listed in Appendix 3. Amplification and detection were performed on 96-well plates. Each10 μl Bestar Real time PCR Master Mix (DBI, München,Germany) contained 5 μl 2 SYBR Green Supermix, 1 μlcDNA reaction mixture, 0.5 μl reverse and sense primers, aswell as 3 μl distilled deionized water (ddH2O). The reactionconditions were as follows: initial denaturation at 95 C for3 min, followed by 40 cycles of 95 C for 10 s, 58 C for 30s, and finally 60 C 95 C, 1 C/cycle holding time 4 s formelting curve analysis. The expression levels of mRNA werenormalized to reference genes U6. Relative miRNA levelswere calculated using the Pfaffl method [41] with the installedsoftware qPCRsoft3.0. (The Pfaffl method is preferred forlarge differences between the amplification efficiency of thetarget gene and the internal gene.)Similar to previous publications ([44,45]), protein expression ratios of 1.2 or 0.83 and a p value of less than 0.05according to the Student t test were considered differentialproteins. The abundance ratio was calculated using theunique peptide strength corresponding to each protein (thesum of the ion strength of the identification spectrum label)to calculate the average ratio. Protein coverage is the lengthof the sequence identified in the protein divided by the lengthof the total protein sequence. If the unique peptide segmentidentified in the protein met the false discovery rate (FDR)filtering criteria, the protein was identified. Complete experimental details for iTRAQ are in Appendix 4.Bioinformatics analysis: Differentially expressed miRNAsof the control and experimental groups were identified withthe t test using TMev bioinformatics software. To get thegene targets of differentially expressed miRNAs, porcine3′-UTR sequences of mRNA were downloaded from theEnsemble database and complementarily linked withmiRNA sequences. The final predicted targets and theircorresponding proteins were determined by the intersectionof results from three different databases (TargetScan, PicTa,and miRanda), which makes the prediction more reliable andhighly accurate. Clustering analysis was routinely performedusing the hierarchical method when the p value was less than0.01. Average linkage and Euclidean distance metric wereperformed in cluster analysis. Gene Ontology (GO) and KyotoEncyclopedia of Genes and Genomes (KEGG) pathwayannotations were performed against porcine proteins usingthe DAVID gene annotation tool.iTRAQ: iTRAQ technology is a widely used method in thefield of quantitative proteomics with high accuracy and reliability. It is an isobaric labeling method by tandem mass spectrometry to determine the number of proteins from differentsources in a single experiment [42,43]. Proteomics of controlcells and senescent cells were performed with iTRAQ, whichdetected the whole proteome in porcine proteins. iTRAQanalysis was performed three times.78
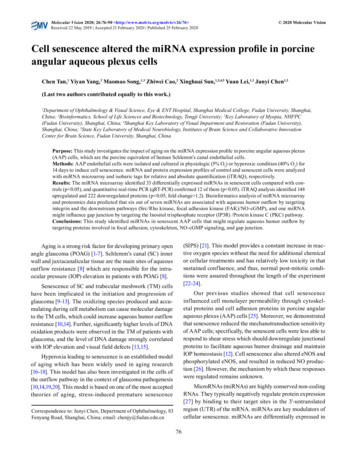
Molecular Vision 2020; 26:76-90 http://www.molvis.org/molvis/v26/76 2020 Molecular VisionBioinformatics analysis on the raw tandem massspectrometry (MS/MS) data was performed according toa standard protocol (Appendix 4). Taking the amino acidsequences as input, differentially expressed proteins (iTRAQ)were further annotated with GO and Cluster of OrthologousGroups (COG) analysis. GO functional classifications wereanalyzed with Blast2GO software, while COG informationwas retrieved by blasting the sequences on the COG database[46]. To explore the biological meanings of these proteins,GO enrichment analysis was performed to identify GO termsthat were statistically significantly enriched in differentiallyexpressed proteins (p 0.05), and the enriched metabolicpathways of these identified proteins were screened via theKEGG database (p 0.05).Student t test; detailed information is listed in Appendix 6).Then differential miRNAs were validated with qRT-PCR,which confirmed 12 miRNAs (Table 1).Target genes and proteins of differentially expressedmiRNAs are listed in Appendix 7. GO analysis revealed 504GO terms with p values smaller than 0.05 with the submissionof predicted target genes. GO terms of top-ranked classification gene numbers are listed in Appendix 8. Some are relevantto aqueous outflow, for example, extracellular matrix organization (GO:0030198, p 0.0111, gene number: 33), cell–celljunction organization (GO:0045216, p 0.0095, gene number:10), focal adhesion (GO:0005925, p 0.0001, gene number:139), cytoskeleton (GO:0005856, p 0.0056, gene number:88), cell–cell junction (GO:0005911, p 0.0043, gene number:65), microtubule cytoskeleton (GO:0015630, p 0.0436, genenumber: 52), adherents junction (GO:0005912, p 0.0268,gene number: 14), and actin binding (GO:0003779, p 0.0316,gene number: 92).Target proteins of differentially expressed miRNAs wereidentified from the iTRAQ analysis. These differentiallyexpressed proteins were further mapped to KEGG pathways,if more than three proteins are related to known pathways thatare important to the pathogenesis of glaucoma.KEGG analysis identified 138 pathways with p valuessmaller than 0.05. The top 20 KEGG pathways ranked bypredicted gene number are listed in Appendix 8. Some arepossibly involved in aqueous humor drainage.Western blotting: Cell lysates were prepared accordingstandard protocols. Briefly, cells were prepared using RIPAsolution. After protein concentrations were measured with theBradford method, equal amounts of protein (30 μg protein/lane) were separated with 10% sodium dodecyl sulfate–polyacrylamide gel electrophoresis (SDS-PAGE). Then theresolved proteins were transferred to nitrocellulose filterswhich was then blocked with 5% nonfat dry milk in Trisbuffered saline with 0.05% Tween-20 for 2 h. Filters wereprobed using primary antibodies, ITGAV (1:1,000, Abcam),ITGB3 (1:1,000, Abcam) pMLC (1:1,000), sGC (1:3,000), andeNOS (1:1,000), followed by incubation with peroxidaselinked secondary antibodies. GAPDH was used as a loadingcontrol. Four independent replicates were used for statisticalanalysis with the Student t test.Differential protein expression in senescent AAP cells:iTRAQ analysis identified a total of 4,165 proteins and17,603 unique peptides. The top ten up- and down-expressedproteins are presented in Table 2, and raw data are shown inAppendix 9 and Appendix 10. The protein abundance distribution is shown in Appendix 11. A total of 370 proteins weredifferentially expressed (p 0.05, fold change 1.2 or 0.83),of which 148 proteins were upregulated, and 222 proteinswere downregulated. Protein fold-difference was expressedin log form with the base equaling 2. A log ratio greater than0 indicates upregulation; less than 0 is downregulation. Mostof the values fell within 5 and 5 (Figure 3). GO classification and enrichment analysis revealed the functional groupsof differentially expressed proteins (Figure 4, Appendix 8).Intermediate filament (2.0%), extracellular matrix (3.8%),and cell–cell contact zone (1.5%) were identified. The KEGGpathway enrichment analysis is shown in Appendix 8. TheCOG protein analysis showed the protein distribution indifferent cell functional groups (Figure 5).RESULTSDifferential microRNA expression in senescent AAP cells:We identified differentially expressed miRNAs in senescent AAP cells with miRNA microarray analysis. Amongthe 407 miRNAs identified, 102 miRNAs were statisticallysignificantly expressed in senescent cells compared tocontrols (p 0.05). The microarray raw data are shown inAppendix 5. The miRNA microarray hybrid signal rangedfrom 0 to 51,949; those that had a value greater than 500were further analyzed (in our experience, a low hybrid signalwas more likely to result in false positives). The heat map ofthe miRNAs shown in Figure 2 demonstrated 17 statisticallysignificantly downregulated miRNAs and 16 statisticallysignificantly upregulated miRNAs (p 0.05, signal 500, n 3,Identification of miRNA and protein pairs: Differentiallyexpressed miRNA and protein pairs are presented in Table3. A total of seven miRNAs and 13 proteins were furthermapped to KEGG pathways after selection. These miRNAswere computationally predicted to negatively or positivelyregulate their target proteins (Figure 6). Six miRNAs werepredicted to directly target ITGA/ITGB, the two subunits ofintegrin, which could regulate IOP through the downstream79
Molecular Vision 2020; 26:76-90 http://www.molvis.org/molvis/v26/76 2020 Molecular Visionpathways related to focal adhesion, cytoskeleton, NO-cGMP,DISCUSSIONand gap junction. Western blot (WB) verification of ITGAVThis study identified a range of differentially expressedmiRNAs and proteins in senescent AAP cells, which are theporcine equivalent of SC cells. The senescence of SC cellswas thought to contribute to the elevation of IOP [11,12]. Bycorrelating the miRNA microarray data with proteomics data,we identified those key miRNAs whose target proteins arealso statistically significantly altered in AAP cells. The integration and analysis of differential miRNA and proteomicsand ITGB3 show no statistically significant changes inFigure 7. The possible reasons are analyzed in the Discussionsection. However, the proteins (pMLC, eNOS, and sGC) ofthe downstream pathways showed a statistically significantdifference.Figure 2. miRNA expression in APP cells. Heat map of miRNAs (p 0.05, signal 500, n 3, Student t test). Seventeen miRNAs were statistically significantly downregulated and 16 miRNAs significantly upregulated.80
Molecular Vision 2020; 26:76-90 http://www.molvis.org/molvis/v26/76 2020 Molecular VisionTable 1. Differentially expressed miRNAs by qPCR validation.miRNAP valueFold 3p0.04630.3948Downssc-miR-1840.00000.0590DownFold changes were calculated from the normalized signal ratio of the senescent AAP cells over normal AAP cells. P values were obtainedby Student t test (n 3).data may help us to better understand the responses occurringin SC cells under senescence.pattern within groups. Our speculation is that the differencemiRNA microarray analysis identified 33 differentiallyexpressed miRNAs (Appendix 6). However, the results ofthe miRNA microarray assays presented an inconsistentinconsistency within groups. Although the variation is large,between primary cells might be the possible reason for thewhich may lead to omission, the detected miRNAs wereunaffected. In addition, these miRNAs were confirmed withTable 2. Top 10 differentially expressed proteins by iTRAQ.Ensembl annotationGene aliasFold 352DownENSSSCP00000025799NXF10.377Down81
Molecular Vision 2020; 26:76-90 http://www.molvis.org/molvis/v26/76 2020 Molecular VisionPCR to ensure a statistically significant difference. Twelvewere verified with PCR. All 12 miRNAs were previouslyfound to be altered or participate in cell senescence. ThreemiRNAs (miR-146a [47], miR-146b, and miR-15b [30]) werealso detected in senescent TM cells. The other nine miRNAs(miR-34a [48], miR-99a [49], miR-24–3p [50], miR-181a [51],miR-23a [52], let-7g [53], let-7d-5p [54], miR-129a-3p [55], andmiR-184 [56]) were also found to be involved in senescencein other cell types.top molecular functions. The top biological processes werethe cellular process, metabolic process, and single-organismprocess. In senescent cells, these top changes in molecularfunction and biological processes were reasonable andconsistent with the cellular senescence hallmark [64,65]. Inthe senescent endothelial cells, signaling, biological adhesion,and localization might relate to alteration of the endothelialcell barrier and interaction with ECM.Bioinformatic analysis further revealed that the sevenmiRNAs might regulate aqueous humor outflow in AAPcells through three signaling pathways which are important toglaucoma pathogenesis (Figure 6). The three pathways forma network through integrin and PKG. In the following, wediscuss each signaling pathway in detail.The total differential expressed miRNAs produced atotal of 504 GO terms and 138 KEGG pathways. Some wereidentified to regulate IOP by actin binding, cytoskeleton,actin binding, cell–cell junction, extracellular matrix (ECM)organization, focal adhesion, and so on. In SC cells, stiffness [57] and junctions are related to the formation of pores.Reorganization of extracellular matrix [59] alters basementmembrane permeability. The present findings are consistentwith those of previous studies. For example, the let-7 familyis believed to inhibit fibrosis by repressing expression ofcollagen genes [60]. miR-24-3p accelerated the migration andinvasion of bladder cancer cells [61]. miR-15b directly targetstissue inhibitor of metallopeptidases 2 (TIMP2) to increasethe migration and invasion of human lung cancer cells [62].However, overexpression of miR-15b aggravates IL-1betainduced ECM degradation [63] in nucleus pulpous cells. Inother words, these miRNAs were found to be involved inECM regulation and cell junctions. The differential expression of 12 miRNAs was confirmed with PCR (Table 1).miRNA-protein pairs were identified for these miRNAs. Atotal of 4,165 proteins and 17,603 unique peptides were identified. GO and COG protein analysis further classified thesedifferential proteins according to their functions. Binding,catalytic activity, and transporter activity were included inFirst, miR-23a, miR-146a-5p, miR-146b, and let-7gcould regulate aqueous humor outflow by integrin/Src/Rhokinase/MLC/F-actin. ITGA and ITGB are direct targets ofmiR-23a, miR-146a-5p, miR-146b, and let-7g. Upon engagement of integrin receptors with extracellular ligands, thefocal adhesion kinase (FAK)-Src complex is activated. Srctransiently inhibits RhoA activity through RhoGAP andGRLF1 (p190RhoGAP) [66,67]. RhoA and Rac stimulationcan increase the transendothelial resistance of human SCcells, by phosphorylating MLC [68], and MLC phosphorylation can trigger F-actin organization which impacts focaladhesion and cell permeability [69]. It has also been reportedthat Rho-associated protein kinase inhibitor significantlydecreases outflow facility by targeting junction or calciumion transport of SC cells [70,71]. Rho kinase and MLC areimportant pharmaceutical targets for ocular hypertension.Rho kinase inhibitor (netarsudil, NDA:208254) was recentlyapproved by the U.S. Food and Drug Administration (FDA)Fig ure 3. Protein abundanceratio distribution. Differentiallyexpressed proteins (p 0.05, foldchange 1.2 or 0.83, n 3, Student ttest) are plotted in this scattergram.A total of 148 upregulated proteinsand 222 downregulated proteinswere observed.82
Molecular Vision 2020; 26:76-90 http://www.molvis.org/molvis/v26/76 2020 Molecular Visionas a novel glaucoma drug to increase conventional outflowand treat ocular hypertension. MLC kinase inhibitor is alsoa potential new therapy for lowering IOP [72]. It might bepossible to use their upstream miRNA to regulate outflowthrough Rho kinase and MLC.is upstream of the phosphatidylinositol 3-kinase (PI3K)/Aktsignal pathway [73]. In a previous study, we showed thatPI3K/Akt facilitates aqueous humor drainage through activation of eNOS [74], an enzyme that catalyzes the release of NO[75]. NO-cGMP is an important pathway for IOP regulation.The NO-donating prostaglandin analog latanoprostene bunod(LBN) was developed as a novel drug for ocular hypertension[76].Second, let-7d-5p and miR-184 could regulate outflowby integrin, FAK, PI3K, Akt, eNOS, and NO-cGMP. Theactivation of ITGA and ITGB phosphorylates FAK, whichFigure 4. GO analysis of identifiedproteins with the iTRAQ method.Gene Ontology includes the cellularcomponent (A), molecular function(B), and biological process (C). Celljunction and extracellular matrixproteins are closely related to intraocular pressure (IOP) regulation(A). Molecular function such asbinding, catalytic activity, transduction, and antioxidant activityare all implicated in IOP regulation(B). Biological adhesion is also keyto IOP regulation (C).83
Molecular Vision 2020; 26:76-90 http://www.molvis.org/molvis/v26/76 2020 Molecular VisionFigure 5. COG analysis of differentially expressed proteins. Among the 24 terms, the top three protein function classes are general functionprediction only, posttranslational modification, protein turnover, chaperones, and translation, ribosomal structure, and biogenesis.Third, miR-24–3p could regulate aqueous humor outflowby IP3R, Ca2 , and PKC which indirectly controls gap junction. Gap junction is related to endothelial cell stiffness [77],which may affect IOP homeostasis potentially by vacuole andpore formation in SC cells [57,77]. Gap junction blocker (e.g.,carbenoxolone) significantly increases outflow facility [58].Activation of IP3R by miR-24–3p results in the release of Ca2 from the endoplasmic reticulum (ER) [78]. The increase inthe Ca2 concentration activates connexins, a family of transmembrane proteins that constitute the gap junction channelsTable 3. miRNA-target genes pairs.MiRNA IDUp/down(miRNA)Target geneUp/down(protein)Regulation typessc-let-7d-5pDownSCD, ITGB3, KRT5, NAP1L1, ACSS2UpNegativeRANBP2, FNDC3B, IGF2BP2DownPositiveRANBP2, FNDC3B, IGF2BP2DownNegativessc-let-7gUpSCD, ITGB3, KRT5, NAP1L1, ACSS2UpPositivessc-miR-129a-3pDownWDR26, TM9SF3, SBDSUpNegativessc-miR-146a-5pUpITGAV, NAP1L1, VBP1, VPS36UpPositivessc-miR-146bUpITGAV, NAP1L1, VBP1, VPS36UpPositivessc-miR-15bDownSCD, CALU, ARL1, NEK9, ACSS2, CAB39,SBDSUpNegativeACSL4, TRPA1, SNRPA1, RRM1, GRK5,FNDC3BDownPositiveFNDC3B, IGF2BP2DownNegativeSCD, ENPP1, HSD11B1, PSME4, NEK9, TM9SF3UpPositiveITGB3, HADHUpNegativeEPHX1, GYS1DownPositiveSKIV2L2, SF3A1DownNegativeITGAV, TM9SF3UpPositiveGRK5, SKIV2L2, PARK7, DDX18, CYB5R1Do
IOP homeostasis [ 12]. Cell senescence also altered eNOS and phosphorylated eNOS, and resulted in reduced NO produc-tion [26]. However, the mechanism by which these responses were regulated remains unknown. MicroRNAs (miRNAs) are highly conserved non-coding RNAs. They typically negatively regulate protein expression