Transcription
Primary Carein the United StatesA Chartbook ofFacts and Statistics
Prepared by:Robert Graham Center (RGC)1133 Connecticut Avenue NW, Suite 1100Washington, DC on Health (IBM)75 Binney StCambridge, MA 02142www.ibm.com/watson-healthThe American Board of Family Medicine (ABFM) & affiliatedCenter for Professionalism & Value in Health Care (CPV)1016 16th Street NW, Suite 700Washington, DC ors:Brian Antono, RGCAndrew Bazemore, ABFM/CPVIrene Dankwa-Mullan, IBMJudy George, IBMAnuradha Jetty, RGCStephen Petterson, RGCAmol Rajmane, IBMKyu Rhee, IBMBedda L. Rosario, IBMElisabeth Scheufele, IBMJoel Willis, ABFM/CPVAcknowledgements:Thanks to the many people who contributed to this reportthroughout its development at IBM, ABFM, and the RobertGraham Center. IBM colleagues include: Sean Kennedy, TimBullock, Kay Miller, Amanda Mummert and Sarah Kefayati.Published February 2021Suggested Citation:Willis J, Antono B, Bazemore A, Jetty A, Petterson S, GeorgeJ, Rosario BL, Scheufele E, Rajmane A, Dankwa-Mullan I,Rhee K. The State of Primary Care in the United States:A Chartbook of Facts and Statistics. October 2020.Primary Care in the United States2
Table ofcontentsPrimary Care in the United States04Preface06Executive Summary070809I. IntroductionWhy Primary Care?Ecology of Medical Care101111121213131414151616II. First ContactWho Provides Primary Care?Primary Care PhysiciansPrimary Care Nurse Practitioners and Physician AssistantsAge Distribution of Primary Care PhysiciansPrimary Care Physicians by GenderNumber of Graduates from Primary Care ResidenciesWhere is Primary Care Provided?Ratios of Primary Care Professionals to PopulationPrimary Care Physician to Population Ratios by StatePrimary Care Physicians by Rural/Urban GeographyPrimary Care Practices by Ownership18191920III. ContinuityWho Visits Primary Care Practices?Office Visits to Physicians by SpecialtyOutpatient Visits to Primary Care Physiciansby Patient Age and Sex2122222323IV. ComprehensivenessWhat Medical Conditions do PrimaryCare Physicians Address?Primary Care Physicians’ Scope of PracticePrimary Care for Patients with Chronic ConditionsChanges in Primary Care Scope of Practice2425V. CoordinationHow Does Care Coordination Function in Primary Care?2728293030VI. CostHow Much Do We Spend on Primary Care?Expenditures for Primary CarePrimary Care Payment SourcesTrends in Compensation for Primary Care Providers3132333435363738VII. Preventive Care VisitsWhy Preventive Care Visits?Trend of Preventive Care Visit UtilizationPreventive Care Visit Utilization, Stratified by Age and SexPreventive Care Visit Utilization, Regional DistributionPreventive Care Visit Utilization, by Health PlanPatients with Preventive Care Visits, Primary Care and NonPrimary Care ProvidersTrend of Average Total Cost of Preventive Care Visit Utilization39VIII. References4244Methods AppendixDescription of Data Sources3
PrefacePrimary Care Amidsta Generational PandemicAs we launched this project in the summer of 2019, wecould scarcely have imagined that just 12 months later,the United States (U.S.) would be beleaguered in a globalpandemic by the coronavirus disease 2019 (COVID-19).What is even more surprising is that we would submit aChartbook for publication in the country facing the world’sheaviest pandemic burden at that time, despite having thegreatest per capita wealth and health care spendingof any nation. The United States, home to 4% of the world’spopulation, currently accounts for about a quarter ofboth the world’s COVID-19 cases (4,000,000) and deaths(150,000).1,2 Such dismal figures coincide with an overlyspecialized, and highly fragmented U.S. health caresystem with a long history of underinvestment in bothprimary care and public health.At this moment, the only certainty seems to be moreuncertainty as we find ourselves coming to grips with a“new normal.” Yet, as the current situation continues toevolve, the impact of COVID-19 will be felt far beyond itspopulation-based effects on morbidity and mortality,3with sequelae including:4 severely strained managementof chronic disease,5 increase in and worsening of mentalhealth,6,7 and associated effects,8 and exacerbation9 indisparity of an already existing and uneven provisionof medical and health care services10 for vulnerablepopulations. Despite the challenges being endured duringthis pandemic, the practice of primary care stands toplay a significant role in the management of these issues,employing previously underutilized technology such astelehealth, and overcoming the financial and physicallimitations imposed by the pandemic on a practice modelbuilt on routinely physician office-based patient care.Primary care is not exempt from the strain facing so manysectors of the U.S. economy, and health care in particular.Early convenience sampled surveys administered weeklyto a cohort of over 700 U.S. primary care clinicians (across49 states) suggested they experienced extreme mentalPrimary Care in the United Statesstress, increased morbidity and mortality among patientsfrom pandemic-related constraints, resource loss (due tostaff sickness and/or quarantine), and existential financialstrain.11 The means by which primary care practices meetsuch challenges is evolving, but there is little doubt thatthe pandemic will leave an indelible mark on primary careaccess, team-structure, size, and delivery.The health care community has also experienced atransformation in clinical care delivery. After years oflamenting the limited use, and sluggish adoption oftelehealth in primary care,12 the swift pivot and embraceof this platform by primary care clinicians and patientsalike to accommodate social distancing imperatives hasbeen remarkable. The demand and use of telehealthservices has accelerated rapidly as new rules relaxed priorregulations, resulting in exponentially expanding access,billing, and services.13 A study by The CommonwealthFund showed that as in-person visits dropped earlyin the pandemic, telemedicine visits briskly peakedto 14% of weekly visits through mid-April. By midJune, telemedicine visits declined from its peak, butremained substantially higher than pre-COVID-19 levels.14Unfortunately, primary care practices, that were unable toshift to virtual care, were forced to restrict certain servicesor to close.11One model examining the financial impact of COVID-19on U.S. primary care practices estimates that 15.1 billionis needed to neutralize revenue losses nationally.15 Evenassuming a rapid ramp up of telemedicine services tooffset losses of in-person visits, a variety of scenariosestimates primary care practices losing over 65,000per full-time equivalent (FTE) physician from currentfee-for-service payment structures.15 An example inVirginia demonstrated that a network of 12 primary careoffices and 500 employees experienced 50% losses inpatient volume and 60% losses in revenue by May 2020– resulting in furloughs of 50 employees, reduced staff4
hours, and significant pay cuts to clinician salaries.16Despite such financial challenges, clinicians and primarycare practices around the country have fought hard tokeep their doors open.17With adequate attention and investment, primary care– in coordination with public and community healthsectors – can mitigate both the long-established healthdisparities and indirect sequelae facing the Americanpublic after COVID-19 recedes. Whether this happensdepends on fundamental reforms to infrastructure andassociated payment models, and a renewed prioritizationof core functions. Empowered to provide ‘First Contact’ forpatients suffering directly or indirectly from COVID-19,and coordinate contact tracing, primary care can help toreduce emergency room and intensive care unit burdenfrom unnecessary care, expense, and overwhelmedcapacity. Primary care clinicians can further build on‘Continuity’ relationships previously established withtheir patients to offer reassurance, effective triage, andcertainty in a time rife with more questions than answers.The ‘Comprehensive’ range of services that primary careoffers across the widest platform of delivery in America canreduce the collateral damage from COVID-19 to supportpatients with chronic diseases whose routine care wasusurped by the urgency of the pandemic and to incorporateeventual vaccine and possible treatment regimens as theyemerge. And finally, well-supported primary care canprovide our patients and populations with ‘Coordinated’care, including but not limited to mitigating challengesin accessing mental health support and services as wellas securing affordable food, medications, and shelter.Alternatively, the financial apocalypse ushered in by thepandemic for many primary care practices could leavethe nation with critical gaps in its most utilized and widelydistributed source of care, exactly when we need it most.We hope that this Chartbook provides some utility to thoseseeking to better understand primary care and to thoseworking to ensure its viability as we continue through thepandemic-engendered “new normal.”Primary Care in the United StatesPrefaceAs it currently stands, the direct costs of COVID-19illustrate a disproportionate burden on minoritycommunities. Black, Indigenous, Latinx, and otherpeople of color are facing higher rates of hospitalizationor death from COVID-19 compared to non-Hispanicwhite persons.18 People of color have also suffered fromlong-standing systemic health and social inequitiesleading to higher rates of chronic conditions that worsenthe effects of COVID-19.19 In addition to direct costs ofCOVID-19 are indirect ones, or COVID collateral. Theseinclude but are not limited to missed preventive careneeds, depression, anxiety, substance misuse, anddomestic violence increasingly witnessed by primary carepractices throughout the country.11 Ultimately, the risks ofsignificant morbidity and mortality from these sequelaemay far outweigh the enormous damage by the initialwave of COVID-19.5
ExecutiveSummaryPrimary Care (PC) has entered a new decade facing trulydynamic times for U.S. politics, culture, health, and thesystem charged with its maintenance. And yet, just twoyears after the world’s nations reaffirmed primary care’scentral role in the achievement of “Health for All,” and aswe await the first report from the National Academies ofMedicine on High Performing Primary Care since 1996,20not much has changed.Despite renewed interest in strengthening primarycare in the United States in recent years, there remainsan inadequate understanding of what primary care isand does, insufficient investment in its infrastructureand growth, inadequacy in its workforce numbers anddistribution, and inefficient coordination with other sectors.In what follows, we seek to improve upon gaps in knowledgeby offering a snapshot of the facts and figures that make upcontemporary U.S. Primary Care. It is our sincere hope thatsuch information not only ignites a curiosity to learn more,but simultaneously serves as a foundation to improve uponthis vital health system function.The Chartbook is loosely organized around Dr. BarbaraStarfield’s conceptual framing of primary care’ssalutary effects as “4 C’s” - First Contact, Continuity,Comprehensiveness, and Coordination of care. Throughthese four dimensions, Dr. Starfield explained how systemsemphasizing primary care achieved greater access tohigher quality health care at lower costs and with greaterequity across populations.The analyses conducted within this Chartbook reaffirmPrimary Care’s standing as the largest platform of healthcare delivery in the United States, an idea first quantifiedand illustrated by the grandfather of Health ServicesResearch, Dr. Kerr White, in 1961 – and which still holdstrue today. Additional analyses also confirm that theproportion of the U.S. physician workforce in primary carehas diminished to 31% (Table 1), as specialist trainingcontinues to grow in the absence of a National WorkforceCommission or federal agency directing workforceplanning. Hopes that nurse practitioners and physicianassistants might fill the gap remain. However, these groupsface the same incentives to specialize as physicians,and their proportional PC contributions continue to laganticipated levels (Table 2).Primary Care in the United StatesSections II and III of the Chartbook frames basic facts andfigures on patient contact with primary care, by exploringvisits,and how they vary by specialty type, age and gender.Section IV tackles the frequency and range of conditionsseen in primary care, and how they are changing.Remarkably, despite representing less than one-third of thephysician workforce, more than 80% of patientswith 8 common chronic conditions saw a primary carephysician for that condition within a two-year period.Understanding the adequacy of a future PC workforce,particularly for vulnerable areas and populations, requiressuccessful definition of who is currently practicing primarycare as well as elucidation of age and gender distributions,and graduate outputs (Figures 2-4). Recent years haveseen misestimation of primary care physician supply thathave potentially dangerous implications for workforceplanning.21 For example, Table 1 offers a contemporaryenumeration of the total physician workforce in primarycare. Other figures will help the reader understand thepercentage of the current PC workforce approachingretirement age, who are serving rural communities, thedistribution across practice ownership types and sizes,and how the ratios of primary care to population variesacross all 50 states (Figure 5).In Section V, new analyses inform the coordinatingfunction of primary care, as exemplified by an evolvingand multifaceted primary care team. New conceptualapproaches to capturing overall investment in primarycare are the subject of Section VI. Using a nationallyrepresentative data source, this section also reveals thepersistent underinvestment in primary care relativeto other sectors.In Section VII, the Chartbook takes a novel look atPreventive Care Visit (PCV) utilization. Using the largestaggregation of commercial data available, we find that PCVuse has steadily increased over the ten-year period of 20082018. However, the results also suggest that PCV utilizationremains low (28.9% to 44.8% in 2018), particularly amongmales and in rural communities and in the WesternU.S., suggesting that there remain policy and practiceopportunities to improve preventive care.While it would be a daunting task for a chartbook to painta complete portrait of a domain as broad as primary care,we hope that readers will find the array of facts and figurescollected into this one to be helpful in their understandingof primary care, well-established as the ‘central’ and‘essential’ feature of any robust health system.6
I. IntroductionPrimary Care in the United States7
In 2000, the World Health Organization (WHO) assessed theworld’s health systems and ranked the United States 37th out of 191countries.22 Despite attempts at improvement, the United States in2020 continues to woefully underperform in key aspects of healthcare services including access, efficiency, quality, and equity whilesimultaneously spending more on health care than any other systemin the world—over 3 trillion per year.23 One major culprit is a U.S.health care system that has become increasingly fragmented in itsdelivery, services, and attempts at solutions begetting unsustainability,ineffectiveness, and more brokenness.24 U.S. primary care can playa critical role in reconnecting and correcting a system capable ofachieving safe, high-quality, accessible, equitable, and affordablehealth care for all Americans. This chartbook describes the currentstate of primary care in the United States presenting information froma variety of national data sources to answer questions about who, what,where, and how primary care is being delivered.Why Primary Care?In 1978, the nations of the world gathered at Alma-Ata anddeclared primary care as the key to attaining “Health forAll.”25 In 1996, an Institute of Medicine (IOM) report definedprimary care as “the provision of integrated, accessiblehealth care services by clinicians who are accountablefor addressing a large majority of personal health careneeds, developing a sustained partnership with patients,and practicing in the context of family and community.”26In her seminal work, Dr. Barbara Starfield, preeminentscholar and health services researcher, conceptualized thevital role and value of primary care as 4 C’s—First Contact,Continuity, Comprehensiveness, and Coordination ofcare. Over a 25 year career, Starfield reinforced primarycare’s strong association with improvement in overallhealth outcomes for persons and populations, includingbut not limited to broader access, lower costs, greaterhealth equity, and higher quality.27 Presently, in the U.S.primary care sits on the precipice of a broken health caresystem. If strengthened in well-designed, well-delivered,and well-used ways, the 4 C’s of primary care can providea solid foundation for achievement of the quadruple aim—improving quality of care, health of people and populations,reducing health care cost, and improving the work life ofhealth care clinicians and staff.Primary Care in the United States1. Introduction8
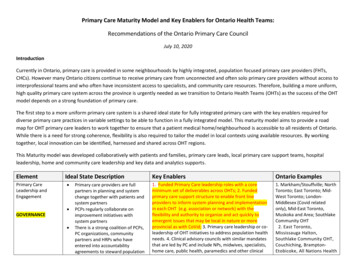
Ecology of Medical CarePrimary care remains the largest platform of health caredelivery in the United States, first demonstrated by KerrWhite in 1961. Forty years later, an updated and expandedestimate of the use of all health services calculated thenumber of Americans who experience certain health careevents in a typical one-month period. Using multiple datasources and comparing primary care services to othermedical specialty services, the model showed that morepeople seek primary care than any other type of healthcare service.Figure 1 below shows the proportion of Americans whoseek various types of health care services in an averagemonth. For every 1,000 people in the United States:– 800 report symptoms– 327 consider seeking medical care– 217 visit a physician’s office(of which 113 visit a primary care physician)– 104 visit a specialist physician– 65 visit a complementaryor alternative medical care provider– 21 visit a hospital-based outpatient clinic– 14 receive health services at home– 13 visit an emergency department– Eight are hospitalized– Less than one person is hospitalizedin an academic medical centerFigure 1. The Ecology of Medical Care, 20011000 persons800 report symptoms327 consider seeking medical care217 visit a physician’s office(113 visit a primary care physician’s office)65 visit a complimentary or alternative medicalcare provider21 visit a hospital outpatient clinic14 receive home healthcare13 visit an emergency department8 are hospitalized 1 is hospitalized in an academic medical centerPrimary Care in the United States1. Introduction9
II. First ContactPrimary Care in the United States10
Who Provides Primary Care?Unlike many other countries, the U.S. primary care workforce lagswoefully behind its specialty care counterparts. At present, primarycare physicians represent only about one-third of the overall physicianworkforce in the United States.28 This falls far short of the 40 percentprimary care workforce recommended by the Council on GraduateMedical Education (COGME) report on Advancing Primary Care.29Although the 2010 COGME report outlined significant evidencedemonstrating optimal health outcomes when 40 percent of thephysician workforce are primary care physicians, the United Stateshas seen a decades decline in production of primary care physiciansrelative to specialty physicians.30 A closer look reveals declining trendsin U.S. medical graduates choosing family medicine—14 to 8 percentamong allopathic graduates from 2000 to 2005 and 34 to 29 percentamong osteopathic graduates from 2001 to 2008.29 This decline isfurther magnified by the looming retirement of one-quarter of theprimary care physician workforce,28 and an anticipated increase indemand for primary care physicians as the U.S. population growslarger and older. If supply and demand trends persist, the AmericanAssociation of Medical Colleges (AAMC) estimates a shortage rangingbetween 21,100 and 55,200 primary care physicians by 2032.31Primary Care PhysiciansIn 2019, there were more than 228,000 direct patientcare physicians in the five major primary care specialties(Table 1). The major specialty of primary care is familymedicine, accounting for nearly 40 percent of the totalprimary care physician workforce, followed by generalinternal medicine and general pediatrics. The number ofgeriatricians is relatively small. Primary care physiciansmake up less than one-third of the physicians who spendmost of their time caring for patients.28Table 1. Number of Office-Based, Direct Patient Care Physicians by Specialty, 2019Physician TypeNumber of PhysiciansPercent of Primary Care PhysiciansPercent TotalTotal Physicians730,026–100.0%Non-Primary Care Physicians501,089–68.6%Total Primary Care Physicians228,936100.0%31.4%Family eneral Practice5,5792.4%0.8%General Internal Medicine78,98434.5%10.8%General Pediatrics48,84221.3%6.7%Source: American Medical Association (AMA) Physician Masterfile, 2019Primary Care in the United States2. First Contact11
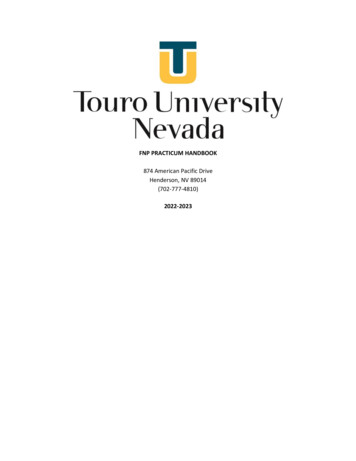
Primary Care Nurse Practitionersand Physician AssistantsRapid growth in the number of nurse practitioners (NPs)and physician assistants (PAs) have offered new hope forfilling gaps in access to primary care. However, the welldocumented decline in physicians choosing primary careappears to be shared by NPs and PAs, which have seensimilar reductions in primary care as a preferred specialtychoice.32 In recent reports, debate remains over whatportion of NPs and PAs enter primary care. For example,the National Commission on Certification of PhysicianAssistants (NCCPA) notes that only 25.8% of PAs (25,487)currently work in primary care settings, versus findings bythe Agency for Health Care Research and Quality (AHRQ)in 2016 estimating 43.4% of PAs (36,119) practice primarycare.33,34 It is clear in either case that ensuring PAs and NPsentry into and retention in primary care is a challenge,much like that faced in the physician workforce. Table 2below shows an updated estimate of the total numberof PAs and NPs, and the proportion of each working inprimary care based on a ‘co-location’ method describedin the Appendix. Lacking the type of data Masterfile thatis available to physicians, this is an estimate only.Table 2. Estimates of Nurse Practitioners and Physician Assistants in Primary Care, 2020Provider TypeTotal NumberPercent in Primary CareNumber in Primary CareNurse Practitioners220,33242.8%94,302Physician Assistants118,19535.7%42,195Source: Medicare Provider Enrollment, Chain, and Ownership System (PECOS), 2020Age Distribution of Primary Care PhysiciansMost primary care physicians arrive in the workforce intheir late 20s, and typically remain in the workforce for 40years. The increased interest in primary care in the late1990s likely explains the age peak of physicians in the midlate 40s (Figure 2). In 2019, nearly one-quarter of primarycare physicians were aged 60 years and older.28Compared to physicians, physician assistants (PAs) inprimary care tend to be younger on average. Only 14% ofprimary care PAs are aged 60 years or older. The medianage is 40 years.35 Age distribution data were not available forprimary care nurse practitioners.Figure 2. Age Distribution of Primary Care Physicians, 201940K35K30K25K20K15K10K5K0 8485 Source: American Medical Association (AMA) Physician Masterfile, 2019Primary Care in the United States2. First Contact12
Primary Care Physicians by GenderThe primary care physician (PCP) workforce in manyindustrialized nations is increasingly female. In recentdecades, the proportion of PCPs who are women hasdoubled or nearly doubled, often outpacing non-primarycare specialties in these industrialized countries.36,37There is an increasing balance by gender across mostof the primary care disciplines, and as of 2019, a majorityof pediatricians, geriatricians, and nurse practitionersare women (Figure 3).Figure 3. Primary Care Physicians by Gender and Specialty, 2019FemaleMale42%58%39%61%Internal MedicineFamily 4%All Primary Care PhysiciansGeneral PracticeSource: American Medical Association (AMA) Physician Masterfile, 2019Number of Graduates from Primary Care ResidenciesThe number of graduates from primary care residencytraining programs peaked in the late 1990s andsubsequently declined for the next decade (Figure 4).There appears to be a growth in the number of graduatesin recent years, though there is a long lag period aftercompletion of training before a physician’s practicespecialty or location is certain. Data sources, suchas the AMA Physician Masterfile, reflect this periodof uncertainty for recent residency graduates.Figure 4. Primary Care Physicians by Year of Residency Graduation, 010-2015Source: American Medical Association (AMA) Physician Masterfile, 2019Primary Care in the United States2. First Contact13
Where is Primary Care Provided?Over a hundred years ago, Abraham Flexner noted thedisproportionate geographic distribution of physicians38 –an enduring access problem re-emphasized in numerousfederal agency reports and expert panels in recent decades.According to the Organisation for Economic Co-operationand Development (OECD), the number of physicians per1,000 residents in the United States is slightly lower thanthe average in other similarly developed OECD countries —2.6 for the United States compared to the OECD average of3.5.39 However, significant state-level variation exists withinthe United States.40Compared to any other specialty group, family physicians,primary care nurse practitioners, and primary carephysician assistants are more likely to provide care in ruraland remote areas. The number of providers at practicesites also varies significantly, but as recently as 2016, themajority of clinic sites have five or fewer providers.41Ratios of Primary Care Professionals to PopulationThere are 223.1 physicians per 100,000 persons in theUnited States. Of those, nearly one-third (70/223.1) areprimary care physicians (Table 3). There are 111.7 primarycare providers overall per 100,000 population, includingphysicians, physician assistants, and nurse practitioners.This translates to one primary care physician for aboutevery 1,429 people in the United States, and one primarycare professional for every 895 people.28,42,43There are substantial variations across the primarycare specialties and professions. Pediatric and geriatricphysician ratios are adjusted for the appropriatepopulation ages. Physician assistant and nursepractitioner ratios are considerably higher because ofthe smaller number of professionals. Table 3 shows boththe number of health care professionals per 100,000population and the ratio of persons per provider.28,42,43Table 3. Primary Care Professionalsper 100,000 Population by Specialty, 2019SpecialtyProvidersper 100,000Personsper ProviderFamily Medicine27.83,594General Practice1.758,643General Internal Medicine24.14,142Geriatrics*8.611,664General Pediatrics66.51,503Primary Care NursePractitioners28.83,470Primary Care PhysicianAssistants12.97,754All Primary Care Physicians70.01,429All Primary Care Providers111.7895All Physicians223.1448 Sources:American Medical Association (AMA) Physician Masterfile, 2019 (Physicians)Medicare Provider Enrollment, Chain, and Ownership System (PECOS),2020 (NP/PA)United States Census Bureau, 2018 population estimates*Population: Persons over age 65 Population: Persons under age 18Primary Care in the United States2. First Contact14
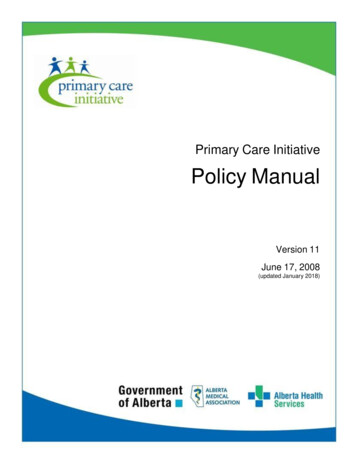
Primary Care Physician to Population Ratios by StateThe number of primary care physicians per 100,000population varies significantly by state (Figure 5).Mississippi has the lowest, with 49.1, and Vermont thehighest, with 103.9 primary care physicians per 100,000people. The District of Columbia has an even higherphysician-to-population ratio of 130.7. The Northeast,Northwest, and northern Midwest regions have the highestratios of primary care physicians per population.28Figure 5. Primary Care Physicians per 100,000 Population by State, .6DC100.3103.9130.7Source: American Medical Association (AMA) Physician Masterfile, 2019;United States Census Bureau, 2019 population estimates 44Primary Care in the United States2. First Contact15
Primary Care Physicians by Rural/Urban GeographyTable 4 shows that primary care physicians are betterrepresented in rural areas than specialist physicians.Among primary care physicians, family physicians andgeneral practice physicians are more highly concentratedin rural areas compared to geriatricians, internists, andpediatricians. Conversely, geriatricians, internists, andpediatricians are as highly concentrated in urban areas asspecialist physicians.Table 4. Primary Care Physicians by Rural-Urban Commuting Area (RUCA) DesignationRuralStatusPercentof Large Rural8.7%3.3%4.5%6.2%2.3%5.8%3.3%3.2%Small Rural4.1%0.9%2.2%3.8%0.9%3.6%1.1%1.0%Isolated Rural3.0%0.4%1.1%2.1%0.6%2.3%0.5%0.4%Sources: American Medical Association (AMA) Physician Masterfile, 2019American Community Surv
The State of Primary Care in the United States: A Chartbook of Facts and Statistics. October 2020. Table of contents 04 Preface 06 Executive Summary 07 I. Introduction 08 Why Primary Care? 09 Ecology of Medical Care 10 II. First Contact 11 Who Provides Primary Care?