Transcription
Unit 3: Inventory ManagementBy: Ester KalipiDate: 05 March 2018
Table of contents1.2.3.4.5.6.7.8.9.objectives of the UnitImportance of Inventory ManagementPurpose of inventoryClassification of InventoryInventory Management ConceptsInventory CostsMathematics of Inventory ManagementInventory Replenishment SystemInventory Control through ABC Analysis
1. Objectives of the LessonBy the end of this unit, students should be able to: Define inventory management; Explain the reasons for holding inventory; List the types of inventory and their classification; Explain the inventory management concepts; Evaluate the inventory management costs; Calculate the economic order quantity (EOQ) and Total inventorycosts; Discuss inventory management control systems
What is Inventory? Inventories are: stockpiles of raw materials, supplies, components, work in progress and finished goods appear at numerous points throughout a firm’s production and logisticschannelWhere can you find inventories?
Inventory Management helps the supply chain to improve customer service can meet high expectations for product availability when located inthe proximity of the customer reduce costs in the supply chain Holding inventories may encourage economies of production Holding inventories fosters economies in purchasing andtransportation.
2. Purpose of inventory Management Inventory management helps in maintaining a trade off between carryingcosts and ordering costs which results into minimizing the total cost ofinventory. Inventory management facilitates maintaining adequate inventory forsmooth production and sales operations. Inventory management avoids the stock-out problem that a firm otherwisewould face in the lack of proper inventory management. Inventory management suggests the proper inventory control system to beapplied by a firm to avoid losses, damages and misuses.
3. Purpose of inventorya) Decoupling: is the separation of manufacturing process from the selling process. Semi-finished products is held between different phases of the production process Decoupling allows the economies of production Transport economies are achieved in the case of large-volume shipments Inventory is held to reduce the cost of purchasing ordering goods frequently in small quantities involves: high delivery costs, handling costs, and administration costs.
b) Balancing supply and demandBalancing supply and demand is more appealing in seasonal supply and/ordemand. Seasonal production, but year-round consumption Canned fruits and frozen vegetables, fresh fruits and vegetables onlyharvested during their season, but consumption is throughout the year. Seasonal consumption, where supply must meet peak demand seasonal variation in demand of some products. demand for beverages during the festive season.
c) Buffering against uncertainties in supply and demandProtecting the business or supply chain against three types of uncertainty: Uncertainty of future demand Lead-time uncertainty A lead time is the elapsed time from order placement to orderreceipt. Uncertainty in supply
d) Geographical specialization Availability and cost of the factors of production influence the location offactories Factors of production are not closer to the markets where the product isconsumed. Inventory in the form of materials, semi-finished goods or components iskept across the supply chain. Each member of the supply chain requires a basic inventory, and in-transitinventories are necessary to link manufacturing and distribution.
e) Preventing the cost of stock outThere are three costs attached to stock-outs:The cost of back order: additional costs of processing and expediting anorder that cannot be met from inventory at hand.The cost of a lost sale: incurs when the customer goes elsewhere for thepurchase. These costs can be measured in terms of the contribution orprofit that is lost of on the particular sale.The cost of the lost customer: unavailability may result into a customerpermanently seeking another supplier.
4. Classification of inventoriesa) Classification of inventory based on its position in the supply chainInventory can be classified in terms of where it is in the supply chain.NB: The more inventory moves to the downstream from the factory towardsthe final consumer, the higher the value of the inventory. Raw material: E.g. iron ore, water, crude oil, sugar cane. Work-in-progress Packaging material: E.g. cold drinks cans; shrink-wrapping is used in variousstages of the logistics process. Finished goods inventory
b) Classification of inventory based on its purposei. Cycle stock (base stock) Amount cycle stock depends mainly on the average demand and leadtime under conditions of certainty.ii. Transit inventory: inventory that is in the pipelineiii. Safety (buffer) stock: make provision for the uncertainties in demandiv. Speculative stock inventory held for reasons other than satisfying normal day-to-daydemand.v. Dead Stock: items which has deteriorated, becomes out-dated
Reasons for Speculative stockAn organization may purchase merchandise in volumes larger thannecessary for the following reasons: To qualify for discounts When a price increase in goods is expected When a shortage of goods is expected To protect against strike To provide for the promotion of an item To provide for a seasonal sales.
CLASS ACTIVITY:Contrast the following inventory based on its position inthe SC and classification of inventory based on its purposeby completing the following table:1. Vehicle on ship destined for export market2. Fuel additive manufacturer bough additional 20,000 litres ofoil in anticipation of oil increase3. Beer brewing tank at NB4. Iron ore extracted & on site at Aglo America5. Iron ore on site at Mittal Steel6. Cell phones released in 2000 in warehouse at Nokia7. Floppy Disk drive at Dell computer manufacturers8. Paper stock at printer in February preparing to printChristmas wrapping9. Cool drinks in distribution centre of large retailer stocking upfor heroes day10. Foodstuff in distribution warehouse of large retail chainContrast inventory based on purpose vs positionPositionCycle Transit Safety Speculative Deadstock stock stock gMaterialFinishedGoods
CLASS ACTIVITY:Contrast the following inventory based on its position in theSC and classification of inventory based on its purpose bycompleting the following table:1. Vehicle on ship destined for export market2. Fuel additive manufacturer bough additional 20,000 litres ofoil in anticipation of oil increase3. Beer brewing tank at NB4. Iron ore extracted & on site at Aglo America5. Iron ore on site at Mittal Steel6. Cell phones released in 2000 in warehouse at Nokia7. Floppy Disk drive at Dell computer manufacturers8. Paper stock at printer in February preparing to printChristmas wrapping9. Cool drinks in distribution centre of large retailer stocking upfor heroes day10. Foodstuff in distribution warehouse of large retail chainContrast inventory based on purpose vs positionpositionCycle TransitSafety Speculativ Deadstock inventory stock e stockstockPurposeRaw5materialWork in 3progress278PackagingMaterialFinishedGoods41,1096
5. Inventory Management Conceptsa) Inventory policy: guidelines regarding what to purchase or manufacture, when to takeaction, and in what quantity.b) Availability: the capacity of the business to have inventory when desired by the customer.Availability is measured in three ways: Stock-out frequency Fill rate: measures the magnitude or impacts of the stock-out over time. Case fill rate: define the percentage of cases (units) ordered & supplied. Line fill rate: the percentage of individual items (product lines) that could be suppliedin totality. Order shipped complete (order fill): measure the number of times the business can supplyall the items ordered by a customer from the available stock. Performance cycle time: the elapsed time between the release of the purchase order bythe buyer to the receipt of shipment.
Inventory Management Concepts (Cont’d.)c) Inventory turnover It is also known as Stock Turnover Measures how well stock is managed. It gives an indication of how many times during the year an average stock is used up. Inventory turnover Total Annual sales Average Inventory
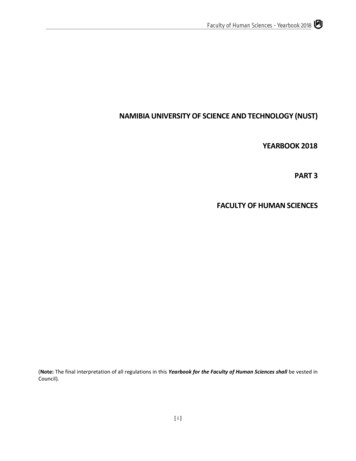
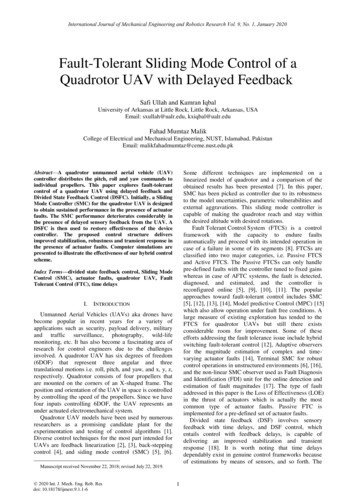
Inventory Management Concepts (Cont’d.)d) Average inventory: consists on the materials, WIP, components, andfinished products that are typically held in inventory. Average inventoryinclude cycle stock, safety stock and transit inventory components.Example: the target inventory levels must be planned for each facility. If afacility carries a maximum stock of N 50,000.00 during normalperformance cycle and minimum of N 10,000.00. The difference betweenthese two levels, N 40,000.00 (N 50,000.00 – N 10,000.00), is the orderquantity, resulting in an cycle inventory of N 20,000.00 (N 40,000.00/2).
Figure 3.1. Inventory cycle for a typical productN 50,000.00Average InventoryN 30,000.00N 10,000.00TransitSpeculativeObsoleteSafety Stock12
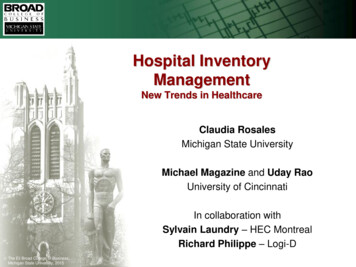
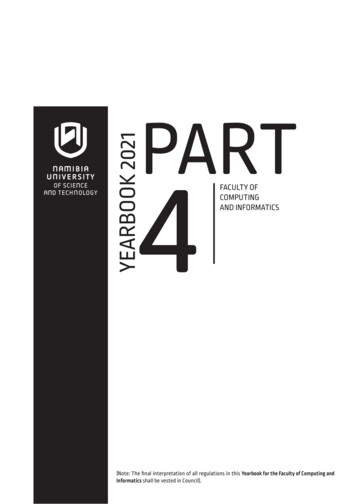
Average inventory Across Multiple performance cyclesAssume that replenishment performance cycle is constant, 10 days; daily sales rate is 10 units per day and order quantity is200 units. See figure 3.2 belowInventory200100Order arrivalOrderplacementAverage inventoryFigure 3.2 inventory relationship for constant sales and performance cycles
6. Inventory CostsThe total inventory cost is made up of purchasing costs, ordering costs and carrying costs.a. Ordering costs: administration. Communication and handling costs linked to order placement, processingand receiving.Ordering costs on products ordered from an external suppliers: Order preparation and submittal Receiving the product Placing products in storage Processing invoice for paymentOrdering costs of internal supplies: Transmitting and processing inventory transferHandling the product if in stock or cost of setting up production and handling in not in stockReceiving at distribution warehouseProcessing associated documentation
Inventory Costs (Cont’d.)b. Carrying costs: associated with holding products in stock. Carrying cost is also known as holding or maintenance costs.Inventory carrying costs Value of average inventory carrying cost %Categories of inventory carrying costs Capital costs on inventory investment: money used to purchase goods that are kept in inventory could have been for othertypes of investment. Capital is tied up in the stock, regardless of whether the money is borrowed or not.Insurance: inventory should be insured against theft and fire. Insurance risks is based on estimated risk or exposure overtime, which depends on the nature of the product and the place of the warehouse. Storage costs: use of warehouse space for storing products in inventory. Inventory risk costs Obsolescence: deterioration of products and it is not covered by insurance. This is the difference between originalcost of the products and the salvage value. Damage: damage incurred in the warehouse while inventory is stored. This could be the excess fee. Shrinkage: loses that that are not easily identifiable and traced to a specific instance of theft. It cannot be claimedfrom insurance.
7. Mathematics of Inventory ManagementInventory Planning Requires setting optimum inventory levels in the supply chain, with due consideration forlowest total logistics costs and uncertainty in demand and supply. The starting point for proper inventory planning is reliable and accurate forecasts ofindependent demand.How much to order? This question can be answered by calculating the economic order quantity (EOQ) for aspecific item. EOQ is a trade-off or a balance between the inventory ordering costs and inventorycarrying-costs.
EOQWhere:C total annual cycle-inventory costQ lot sizeH holding cost per unit per yearD annual demandS ordering or setup costs per lotEOQ 2DSH
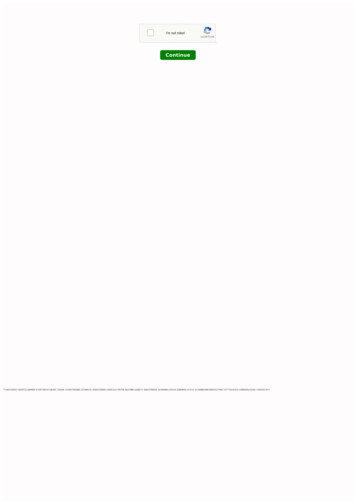
Five assumptions of EOQ1. Demand rate is constant and known with certainty.2. No limitations are placed on the size of each lot.3. The only two relevant costs are the inventory holding cost and the fixedcost per lot for ordering or setup.4. Decisions for one item can be made independently of decisions for otheritems.5. The lead time is constant and known with certainty.6. NB:THE ORDER QUANTITY AT WHICH THE ACQUISITION COSTS IS EQUALHOLDING COSTS.
Economic Order QuantityFigure 3.3: Annual Holding costs, Ordering and Total Costs
Calculating EOQ
Calculating EOQ
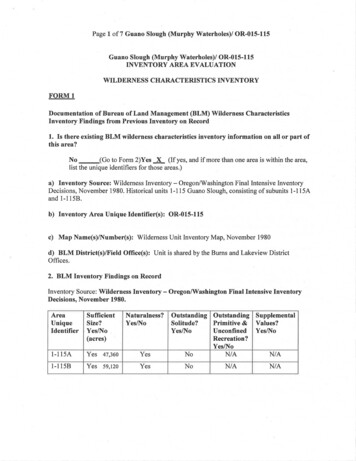
EXAMPLE 1 A museum of natural history opened a gift shop which operates 52 weeks per year.Managing inventories has become a problem.Top-selling SKU is a bird feeder.Sales are 18 units per week, the supplier charges 60 per unit.Ordering cost is 45.Annual holding cost is 25 percent of a feeder’s value.Management chose a 390-unit lot size.What is the annual cycle-inventory cost of the current policy of using a 390-unit lotsize? Would a lot size of 468 be better?
SOLUTIONWe begin by computing the annual demand and holding cost asD H (18 units/week)(52 weeks/year) 936 units0.25( 60/unit) 15The total annual cycle-inventory cost for the current policy isQ390D936( 15) ( 45)C 2 (H) Q (S) 2390 2,925 108 3,033468936( 15) ( 45) 3,510 90 3,600C 2468
Fig. 3.4: Total Annual Cycle-Inventory Cost Function for the Bird Feeder
Calculate the EOQEXAMPLE 1For the bird feeders in Example 1, calculate the EOQ and its total annual cycleinventory cost.SOLUTIONUsing the formulas for EOQ and annual cost, we getEOQ 2DSH 2(936)(45)15 74.94 or 75 units
Finding the EOQ, Total Cost,Figure 3.5 shows that the total annual cost is much less than the 3,033 cost of thecurrent policy of placing 390-unit orders.Figure 3.5 –Copyright 2010 Pearson Education,Inc. Publishing as Prentice Hall.Total Annual Cycle-Inventory Costs Based on EOQ
Class Exercise 1 An annual demand of 2000 items, cost of replenishing an order isN 400.00, carrying cost is 25% and the purchase price per item isN 100.00.Required: Calculate the EOQ If there are 50 units on the pallets, the order quantity would beestablished at 250 units. Required: calculate the Annual Total Inventory Cost
When to Order?The reorder point defines when a replenishment should be initiated.Reorder point is stated in terms of units or days’ supply.ROP formula: 𝑅 𝐷 𝑇Where: R Reorder points in unitsD Average Daily demand in unitsT Average Performance cycle length in dayse.g. assume demand of 20 units/day and a 10-day performance cycle𝑅 𝑅 𝑇 20 units/day 10 days 200 unitsAlternatively, Reorder point is defined in terms of days of supply, which is 10 Days.
When to Order (Cont’d.)?In terms of uncertainty in demand or performance cycle length, safety stock is required.The reorder point formula is then:𝑅 𝐷 𝑇 𝑆𝑆Where R Reorder points in unitsD Average daily demand in unitsT Average Performance cycle length in daysSS Safety Stock in units
Target stock level system (TSL)The level at which inventory is topped up when ordering cycle reach the level of ordering atfixed times. This procedure follows steps ROP D*T:Step 1: specify a day each week / month on which to place orderStep 2: Review the stock on a chosen dayStep 3: Calculate the order quantity, Q TSL - stock on hand - supply orders outstanding withinthe current lead timesTherefore, TSL D*(T P) SSWhere: TSL Target stock levelD Daily or weekly demandT average lead time in days or weeksP reviewed period in days or weeks
Target stock level system (TSL) (Cont’d.)Example:Assume deliveries take place once a week and the average demand is 20 units per week.The lead time is 5 weeks. There is no uncertainty in demand and lead time.TSL D*(T P) SSTSL 20(5 1) 0 120 units to be topped up after review have been done.Assuming that there is 30 Units in stock at review timeOrder quantity 120-30 90
Class Exercise 2PQR LTD has an annual demand of 104,000 with a replenishing order cost ofN 1,200, a carrying cost percentage of 18% and a purchase price of N 30per unit, you are required to: Calculate the EOQ Calculate the ROP if the safety stock level is set to 3,800 and the leadtime is 4 weeks Calculate the TSL if the weekly demand is 2,000 units, the lead time is6weeks and the review is done once per week. There is no uncertainty indemand and lead time
8. Inventory Replenishment System Collaborative Planning, Forecasting and Replenishment: this process is initiated bythe fast-moving consumer goods (FMCG) industries to achieve the such coordination. CPFR coordinates the requirements planning process between the supply chainpartners for demand creation and demand fulfilments activities. CPRF shares information involving promotions, forecasts, item data and order using asystem or internet. Information developed collaboratively is used by planners to generate demand,determine replenishment requirements and match production to demands.
Inventory Replenishment System (Cont’d.) Joint Business Planning: customers and suppliers share, discuss, coordinate &rationalize individual strategies to form a joint plan Joint calendar is created to share information determining the product flow. A common sales forecast is created and shared between retailer & supplier based onknowledge of each supply chain partner’s plan. Forecast and requirements plan is exchange and refined by partners until consensus isreached.
HomeworkHome work: research on the following collaborative inventory replenishment! Quick Response Vendor Managed Inventory Profile replenishment
Types of Collaborative Inventory Replenishment Quick Response: the sharing of retail sales information among supply chainparticipants. Continuous sharing of information as regards the availability and delivery reducesuncertainty in demand and supply across the total supply chain. It reduces the need for safety stock It increases the flexibility of the supply chain QR enable the company to react faster to market changes and run operations in costeffective manner to satisfy the end consumers needs.
Principles of Quick Response Activities regarding the inventory flow must be driven by andharmonized with the demand and behaviour of end-consumers. QR may be considered as the application of JIT in a distributionenvironment. The focus should be on reducing lead times. Access to and sharing of information in the supply chain is importantfor the QR concept.
Inventory replenishment system (cont’d.) Vendor inventory management (VMI): similar to QR however it eliminates the need forthe downstream customer to place a replenishment order. Suppliers manages the customer’s stock and plans replenishment orders based oninventory balances and demand information. Suppliers commits to maintaining appropriate inventory levels on the customer’spremises. Profile replenishment: an extension of QR and VMI, whereby the supplier anticipatesfuture demand based on overall knowledge of the market for a specific product category. Categories provide details about the size, colours and products likely to sell in a retailstore Suppliers can simplify retailer involvement by eliminating the need for the retailer to keep records of sales and inventory levels.
9. Inventory Control system through ABC Analysisa) The purpose of inventory control Superior customer service Relate to availability from current inventory Relatively low inventory costs Minimum possible amount of cash tied up in inventory and space. Lowest possible total operating costs A trade-off among the costs of the major logistics activities. Major operating costs are: Warehousing operations Inventory Purchasing Transport
Inventory Control system through ABC Analysis (Cont’d.)b) ABC Analysis (Pareto analysis) Economist Villefredo Pareto found that 20% of the people controlled 80% of wealth. The minority has the greatest importance and majority has the little importance isbroaden to include situations, referred to Pareto Principle. Examples of Pareto Principles: 20% of products account for 80% of the sales 80% of the stock value is caused by 20% of the stock lines. 80% of purchased items come from 20% of the suppliers. 80% of the warehouse space is occupied by 20% of the stock lines. 20% of the stock lines give 80% of the turnover.
ABC Analysis using Pareto Principle (Cont’d.) Pareto analysis forms the basis of inventory control and is an important management tool that can be usedto minimize effort and obtain the best results. 80/20 rule Efforts and control should focus on high-costs and high-impacts areas. 20% of the stock lines that cause 80% of the cost should be subject to tight control to reduce costs Tight control on 20% of the lines that contribute to 80% of the turnover could result in excellent customerservice. Measures of ABC classification of inventory includes: Annual sales Profit contribution Inventory value Usage rate (demand) and nature of the item Product value is the most determinant of inventory-carrying cost, hence a combination of annual sales andproduct value is an appropriate measure. 𝐴𝑛𝑛𝑢𝑎𝑙 𝑡𝑢𝑟𝑛𝑜𝑣𝑒𝑟 𝑎𝑛𝑛𝑢𝑎𝑙 𝑑𝑒𝑚𝑎𝑛𝑑 𝑢𝑛𝑖𝑡 𝑐𝑜𝑠𝑡
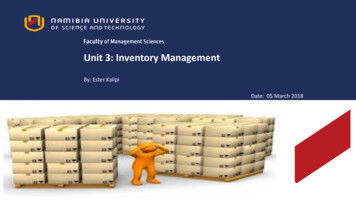
Figure 3.6: ABC analysis based on Pareto PrincipleClassification of product linesbased on annual turnover: A class 10% of linescontributing to 65% ofturnover B class 20% of linescontributing to 25% ofturnover C class 70% of linescontributing to 10 percentof turnover
Solved problem 1Booker’s Book Bindery divides SKUs into three classes, according to their dollarusage. Calculate the usage values of the following SKUs and determine which ismost likely to be classified as class A.
Solved Problem 1 (Cont’d.)SOLUTIONThe annual dollar usage for each item is determined by multiplying the annual usagequantity by the value per unit. As shown in Figure below, the SKUs are then sortedby annual dollar usage, in declining order. Finally, A–B and B–C class lines aredrawn roughly, according to the guidelines presented in the text. Here, class Aincludes only one SKU (signatures), which represents only 1/7, or 14 percent, of theSKUs but accounts for 83 percent of annual dollar usage. Class B includes the nexttwo SKUs, which taken together represent 28 percent of the SKUs and account for 13percent of annual dollar usage. The final four SKUs, class C, represent over half thenumber of SKUs but only 4 percent of total annual dollar usage
Solved problem 1
Solved Problem 1Figure 3.7: Annual Dollar Usage forClass A, B and C SKUs
ABC Classification Example: Assume a firm has ten stock keeping units (SKU). Given the annualdemand and the cost we can determine the turnover for the 1335Turnover99074201901625875Turnover 1063297003003750300630457864.90.78.20.71.4
Step 1: Ranking stock using ABC classification method-based on the turnovercontribution and to assign the ABC lassABBCCCCCCC
Policy and control based on ABC classificationClass CharacteristicsAFew itemsMost of turnoverBCPolicyTight controlPersonal supervisionCommunicationBalanced safety stockImportant ItemsLean stock policySignificant turnover Typical stock controlFast appraisal methodsManaged by exceptionMethodsFrequent monitoring- dailyAccurate recordsSophisticated forecastingHigh service policyLess frequent monitoring-weeklyCalculated safety stocksLimited order valueComputerisedException reportingMany itemsMinimum supervisionSimple systemLow turnover value Supply of order where possible- Avoid stock shortages or excessFew movement of keep stock centrallyInfrequent orderinglow-value itemsLarge order quantitiesAutomatic systemZero or high safety stock policy
Stock Cover Inventory control aims to drive stock towards appropriate levels determined by supply anddemand Inventory performance of each item is monitored using a measurement stock balance. Stock cover (is an appropriate measure): defined as the time in which inventory will bedepleted at an average demand. 𝑆𝑡𝑜𝑐𝑘 𝑐𝑜𝑣𝑒𝑟 𝑐𝑢𝑟𝑟𝑒𝑛𝑡 𝑠𝑡𝑜𝑐𝑘 52 𝑎𝑛𝑛𝑢𝑎𝑙 𝑑𝑒𝑚𝑎𝑛𝑑 Stock cover results into a number of weeks that the current inventory will last Stock cover indicates whether the stock is in right ballpark & gives an insight into the priorityfor action. Stock turnover is the same as stock cover, and it measure the effectiveness of inventorymanagementStock targets based on ABC An allowable stock cover range can be set for ABC inventory categories in a ratio which 1:3:7. A class: between one and four weeks B class: between two and eight weeks C class: between three and twenty weeks
ReferencesBowersox, D. J., Closs, D. J., Cooper, M. B. Bowersox, J. C. (2013). Supply ChainLogistics Management (4th ed) . New York: McGraw- HillKrajewski, L.J., Ritzman, L.P. & Malhotra, M.K. (2010). Operationsmanagement: processes and supply chains. United States of America: PearsonPrentice HallPienaar, W. J., & Vogt, J. J. (2009). Business logistics management: A Supplychain perspective (3rd Ed.). Cape Town: Oxford University Press.Savage, C. (2013). Lecture notes: Logistics and Service Management.Polytechnic of Namibia
Next ChapterWarehousing Procedures
Inventory Management helps the supply chain to improve customer service can meet high expectations for product availability when located in the proximity of the customer reduce costs in the supply chain Holding inventories may encourage economies of production Holding inventories fosters economies in purchasing and transportation.