Transcription
NCES 2019-071U.S. DEPARTMENT OF EDUCATIONCharacteristics of PrivateSchools in the United States:Results From the 2017–18Private School Universe SurveyFirst Look
Characteristics of PrivateSchools in the United States:Results From the 2017–18Private School Universe SurveyFirst LookJUNE 2019Stephen P. BroughmanNational Center for Education StatisticsBrian KincelJennifer PetersonU.S. Census BureauNCES 2019-071U.S. DEPARTMENT OF EDUCATION
U.S. Department of EducationBetsy DeVosSecretaryInstitute of Education SciencesMark SchneiderDirectorNational Center for Education StatisticsJames L. WoodworthCommissionerSample Surveys DivisionChristopher ChapmanAssociate CommissionerThe National Center for Education Statistics (NCES) is the primary federal entity for collecting, analyzing, andreporting data related to education in the United States and other nations. It fulfills a congressional mandate tocollect, collate, analyze, and report full and complete statistics on the condition of education in the United States;conduct and publish reports and specialized analyses of the meaning and significance of such statistics; assist stateand local education agencies in improving their statistical systems; and review and report on education activities inforeign countries.NCES activities are designed to address high-priority education data needs; provide consistent, reliable, complete,and accurate indicators of education status and trends; and report timely, useful, and high-quality data to the U.S.Department of Education, the Congress, the states, other education policymakers, practitioners, data users, and thegeneral public. Unless specifically noted, all information contained herein is in the public domain.We strive to make our products available in a variety of formats and in language that is appropriate to a variety ofaudiences. You, as our customer, are the best judge of our success in communicating information effectively. If youhave any comments or suggestions about this or any other NCES product or report, we would like to hear from you.Please direct your comments toNCES, IES, U.S. Department of EducationPotomac Center Plaza (PCP)550 12th Street SWWashington, DC 20202June 2019The NCES Home Page address is http://nces.ed.gov.The NCES Publications and Products address is http://nces.ed.gov/pubsearch.This publication is only available online. To download, view, and print the report as a PDF file, go to the NCESPublications and Products address shown above.Suggested CitationBroughman, S.P., Kincel, B., and Peterson, J. (2019). Characteristics of Private Schools in the United States:Results From the 2017–18 Private School Universe Survey First Look (NCES 2019-071). U.S. Department ofEducation. Washington, DC: National Center for Education Statistics. Retrieved [date] fromhttp://nces.ed.gov/pubsearch.Content ContactStephen Broughman(202) 245-8338Stephen.Broughman@ed.gov
ContentsPageList of Tables . ivIntroduction . 1Selected Findings . 2References . 4Tables . 5Appendix A—Glossary . A-1Appendix B—Technical Notes . B-1Appendix C—Standard Error Tables . C-1iii
List of TablesTablePage1.Number and percentage distribution of private schools, students, and full-timeequivalent (FTE) teachers, by selected school characteristics: United States,2017–18 . 62.Number and percentage distribution of private schools, students, and full-timeequivalent (FTE) teachers, by religious or nonsectarian orientation of school:United States, 2017–18 . 73.Percentage distribution of private schools within selected school characteristics,by program emphasis: United States, 2017–18 . 84.Number and percentage distribution of private schools, by urbanicity type andselected school characteristics: United States, 2017–18 . 95.Number and percentage distribution of private school students, by urbanicitytype and selected school characteristics: United States, 2017–18 . 106.Number and percentage distribution of private school students, by grade andprivate school typology: United States, 2017–18 . 127.Average private school size, by school level and selected school characteristics:United States, 2017–18 . 138.Number and percentage distribution of private schools within selected schoolcharacteristics, by school size: United States, 2017–18 . 149.Percentage distribution of private school students within selected schoolcharacteristics, by racial/ethnic background: United States, 2017–18 . 1610.Percentage male enrollment in private schools and percentage distribution ofprivate schools within selected school characteristics, by coeducationalcategory: United States, 2017–18 . 1711.Number and percentage distribution of private school teachers (headcount)within selected school characteristics, by work status: United States, 2017–18 . 1812.Pupil/teacher ratio of private schools, by school level and selected schoolcharacteristics: United States, 2017–18 . 2013.Percentage of private schools with 12th-graders, number of graduates,graduation rate, and percentage of graduates who attended 4-year colleges, byselected school characteristics: United States, 2016–17 . 2114.Number of private schools, students, and teachers (headcount), by schoolmembership in private school associations: United States, 2017–18 . 2315.Number of private schools, students, full-time equivalent (FTE) teachers, and2016–17 high school graduates, by state: United States, 2017–18 . 24iv
List of Tables—ContinuedTablePageAppendix B—Technical NotesB-1.Number of responding and nonresponding schools, out-of-scope cases, andschool response rate, by frame: 2017–18 . B-3B-2.Summary of 2017–18 PSS nonresponse bias statistics . B-6Appendix C—Standard Error TablesC-1.Standard errors for Table 1: Number and percentage distribution of privateschools, students, and full-time equivalent (FTE) teachers, by selected schoolcharacteristics: United States, 2017–18 . C-2C-2.Standard errors for Table 2: Number and percentage distribution of privateschools, students, and full-time equivalent (FTE) teachers, by religious ornonsectarian orientation of school: United States, 2017–18 . C-3C-3.Standard errors for table 3: Percentage distribution of private schools withinselected school characteristics, by program emphasis: United States, 2017–18 . C-4C-4.Standard errors for Table 4: Number and percentage distribution of privateschools, by urbanicity type and selected school characteristics: United States,2017–18 . C-5C-5.Standard errors for Table 5: Number and percentage distribution of privateschool students, by urbanicity type and selected school characteristics: UnitedStates, 2017–18. C-6C-6.Standard errors for Table 6: Number and percentage distribution of privateschool students, by grade and private school typology: United States, 2017–18. C-7C-7.Standard errors for Table 7: Average private school size, by school level andselected school characteristics: United States, 2017–18 . C-8C-8.Standard errors for Table 8: Number and percentage distribution of privateschools within selected school characteristics, by school size: United States,2017–18 . C-9C-9.Standard errors for Table 9: Percentage distribution of private school studentswithin selected school characteristics, by racial/ethnic background: UnitedStates, 2017–18. C-10C-10.Standard errors for Table 10: Percentage male enrollment in private schools andpercentage distribution of private schools within selected school characteristics,by coeducational category: United States, 2017–18. C-11C-11.Standard errors for Table 11: Number and percentage distribution of privateschool teachers (headcount) within selected school characteristics, by workstatus: United States, 2017–18 . C-12v
C-12.Standard errors for Table 12: Pupil/teacher ratio of private schools, by schoollevel and selected school characteristics: United States, 2017–18 . C-14C-13.Standard errors for Table 13: Percentage of private schools with 12th-graders,number of graduates, graduation rate, and percentage of graduates whoattended 4-year colleges, by selected school characteristics: United States,2016–17 . C-15C-14.Standard errors for Table 14: Number of private schools, students, and teachers(headcount), by school membership in private school associations: UnitedStates, 2017–18. C-16C-15.Standard errors for Table 15: Number of private schools, students, full-timeequivalent (FTE) teachers, and 2016–17 high school graduates, by state: UnitedStates, 2017–18. C-17vi
IntroductionIn 1988, the National Center for Education Statistics (NCES) developed a private school datacollection that improved on the sporadic collection of private school data dating back to 1890and at the same time developed an alternative to commercially available private school samplingframes. Since 1989, the U.S. Bureau of the Census has conducted the biennial Private SchoolUniverse Survey (PSS) for NCES. PSS is designed to generate biennial data on the total numberof private schools, students, and teachers, and to build a universe of private schools to serve as asampling frame of private schools for NCES sample surveys. For more information about themethodology and design of the PSS, please see the Technical Notes in appendix B of this report.The target population for the PSS is all schools in the 50 states and the District of Columbia thatare not supported primarily by public funds, provide classroom instruction for one or more ofgrades kindergarten through 12 (or comparable ungraded levels), and have one or more teachers.Organizations or institutions that provide support for home schooling, but do not provideclassroom instruction, are not included.The 2017–18 PSS data were collected between October 2017 and August 2018. All data are forthe 2017–18 school year except the high school graduate data, which are for the 2016–17 schoolyear.Because the purpose of this report is to introduce new NCES survey data through thepresentation of tables containing descriptive information, only selected findings are listed below.These findings are purely descriptive in nature and are not meant to imply causality. Thesefindings have been chosen to demonstrate the range of information available from the 2017–18PSS rather than to discuss all of the observed differences, emphasize any particular issue, ormake comparisons over time.The tables in this report contain counts and percentages demonstrating bivariate relationships.All of the results have been weighted to reflect the sample design and to account for nonresponseand other adjustments. Comparisons drawn in the selected findings have been tested forstatistical significance at the .05 level using Student’s t statistics to ensure that the differences arelarger than those that might be expected due to sampling variation. No adjustments were madefor multiple comparisons. Many of the variables examined are related to one another, andcomplex interactions and relationships have not been explored. Statistical Analysis Software(SAS 9.2) and SUDAAN (10.0) were used to compute the statistics for this report.1
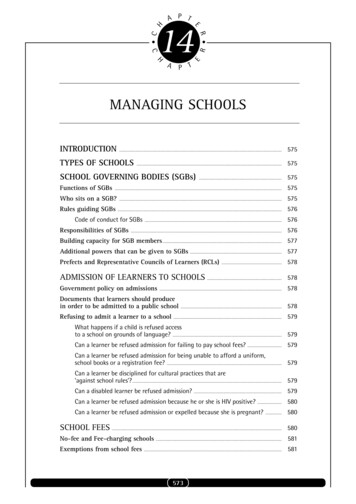
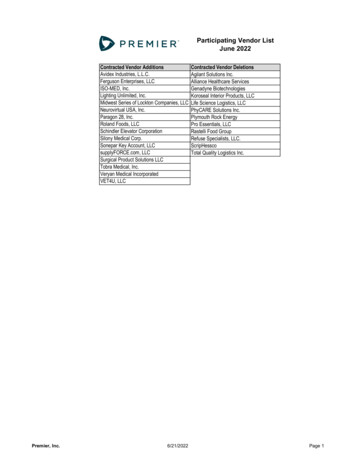
Selected Findings In the fall of 2017, there were 32,461 private elementary and secondary schools with4,898,154 students and 482,325 full-time-equivalent (FTE) teachers in the United States(table 1). Sixty-six percent of private schools, enrolling 78 percent of private school students andemploying 70 percent of private school FTE teachers in 2017–18, had a religiousorientation or purpose (table 2). Sixty-eight percent of private schools in 2017–18 emphasized a regular elementary/secondary program, 9 percent emphasized a Montessori program, 3 percent had a specialprogram emphasis, 6 percent emphasized a special education program, less than1 percent emphasized a vocational/technical program, 7 percent emphasized analternative program, and 6 percent emphasized an early childhood program (tables 1and 3). In 2017–18 there were 12,152 private schools in suburban locations, followed by those incities (10,531), rural areas (7,024), and towns (2,754) (tables 1 and 4). The largest number of private school students in 2017–18 were enrolled in schoolslocated in cities (2,153,089), followed by those in suburban schools (1,906,478), ruralareas (526,631), and then by those in towns (311,956) (tables 1 and 5). More private school students in 2017–18 were enrolled in kindergarten (456,876) than inany other grade level (table 6). The average school size in 2017–18 was 151 students across all private schools. Privateschool size differed by instructional level. On average, elementary schools had 108students, secondary schools had 284 students, and combined schools had 202 students(table 7). Forty-three percent of all private schools in 2017–18 enrolled less than 50 students(table 8). Sixty-seven percent of private school students in 2017–18 were White non-Hispanic;11 percent were Hispanic, regardless of race; 9 percent were Black non-Hispanic;6 percent were Asian non-Hispanic; 5 percent were of Two or more races non-Hispanic,.5 percent were American Indian non-Hispanic, and .8 percent were Pacific Islander nonHispanic (table 9). Ninety-six percent of all private schools in 2017–18 were coeducational, while2 percent enrolled all girls and 2 percent enrolled all boys (table 10). Seventy-nine percent of private school teachers in 2017–18 were full-time teachers;5 percent taught less than full time, but at least three-quarter time; 9 percent taught lessthan three-quarter time, but at least one-half time; 4 percent taught less than one-halftime, but at least one-quarter time; and 3 percent taught less than one-quarter time(table 11).2
The average pupil/teacher ratio in 2017–18 was 10.2 across all private schools. Privateschool pupil/teacher ratios were larger in elementary and secondary schools than incombined schools. On average, the pupil/teacher ratio was 11.0 in secondary schools,10.8 in elementary schools, and 9.2 in combined schools (table 12). Ninety-seven percent of 12th-graders enrolled in private schools around October 1, 2016graduated in 2016–17 and 62 percent of the graduates attended 4-year colleges by the fallof 2017 (table 13). In 2017–18, there were 10,750 private schools that did not report membership in anyprivate school association (table 14). In 2017–18, there were 250,000 or more students enrolled in private schools inCalifornia, Florida, New York, and Texas (table 15).3
ReferencesBeller, N.D. (1984). Private Elementary and Secondary Education, 1983 Enrollment, Teachers,and Schools (Bulletin). U.S. Department of Education. Washington, DC: National Center forEducation Statistics.Broughman, S., Kincel, B., Peterson, J., and Mosina, S. (forthcoming). Private School UniverseSurvey (PSS): Survey Documentation for School Year 2017–18 (NCES 2019-076). U.S.Department of Education. Washington, DC: National Center for Education Statistics.Geverdt, D. (2018). Education Demographic and Geographic Estimates Program (EDGE):Locale Boundaries File Documentation, 2017 (NCES 2018-115). U.S. Department ofEducation. Washington, DC: National Center for Education Statistics. Retrieved March 26,2019, from https://nces.ed.gov/programs/edge/docs/EDGE NCES LOCALE FILEDOC.pdf.U.S. Department of Education, National Center for Education Statistics. (2003). NCES StatisticalStandards (NCES 2003-061). Washington, DC: U.S. Government Printing Office.Wolter, K.M. (1985). Introduction to Variance Estimation. New York: Springer-Verlag.4
Tables5
Table 1.Number and percentage distribution of private schools, students, and full-time equivalent(FTE) teachers, by selected school characteristics: United States, 2017–18Selected school characteristicTotalPrivate school typologyCatholicParochialDiocesanPrivateOther religiousConservative ChristianOther affiliatedUnaffiliatedNonsectarianRegularSpecial emphasisSpecial educationSchool levelElementarySecondaryCombinedProgram emphasisRegular elementary/secondaryMontessoriSpecial program emphasisSpecial educationVocational/technicalAlternativeEarly FTE Size (number of students)Less than 500–7491,1543.6699,18414.362,19912.9750 or ty NOTE: Detail may not sum to totals because of rounding or missing values in cells with too few sample cases. Theseestimates include private schools that provide instruction for one or more of grades kindergarten through 12 (orcomparable ungraded levels).SOURCE: U.S. Department of Education, National Center for Education Statistics, Private School Universe Survey(PSS), 2017–18.6
Table 2.Number and percentage distribution of private schools, students, and full-timeequivalent (FTE) teachers, by religious or nonsectarian orientation of school: UnitedStates, 2017–18Religious or nonsectarian PercentFTE 4171,56566,0622,0967050.10.313.70.40.1Church of God in ChristChurch of the NazareneDisciples of ,0802,524‡0.1‡2.70.5Greek OrthodoxIslamicJewishLatter Day SaintsLutheran Church—Missouri .11.06.1‡1.9Evangelical Lutheran Church in AmericaWisconsin Evangelical Lutheran SynodOther sbyterianSeventh-Day 0.90.9Religious orientationRoman CatholicAfrican Methodist EpiscopalAmishAssembly of GodBaptistBrethrenCalvinistChristian (unspecified)Church of ChristChurch of GodNonsectarian10,91333.61,078,70422.0146,56130.4! Interpret data with caution. The coefficient of variation for this estimate is between 30 and 50 percent (i.e., the standarderror is at least 30 percent and less than 50 percent of the estimate).‡ Reporting standards not met. There are fewer than 15 sample cases.NOTE: Detail may not sum to totals because of rounding or missing values in cells with too few sample cases. Theseestimates include private schools that provide instruction for one or more of grades kindergarten through 12 (orcomparable ungraded levels).SOURCE: U.S. Department of Education, National Center for Education Statistics, Private School Universe Survey(PSS), 2017–18.7
Table 3.Percentage distribution of private schools within selected school characteristics, byprogram emphasis: United States, ‡‡2.80.7‡‡‡Other religiousConservative ChristianOther .31.42.16.6NonsectarianRegularSpecial emphasisSpecial ��†School Size (number of students)Less than 5050–149150–299300–499500–749750 or 7.53.07.47.0Selected schoolcharacteristicTotalPrivate school mentary/secondaryUrbanicity !2.94.2‡4.11.5 !† Not applicable.! Interpret data with caution. The coefficient of variation for this estimate is between 30 and 50 percent (i.e., the standarderror is at least 30 percent and less than 50 percent of the estimate).‡ Reporting standards not met. There are fewer than 15 sample cases.NOTE: Detail may not sum to totals because of rounding or missing values in cells with too few sample cases. Theseestimates include private schools that provide instruction for one or more of grades kindergarten through 12 (orcomparable ungraded levels).SOURCE: U.S. Department of Education, National Center for Education Statistics, Private School Universe Survey(PSS), 2017–18.8
Table 4.Number and percentage distribution of private schools, by urbanicity type and selectedschool characteristics: United States, 2017–18TotalNumber PercentCityNumber PercentSuburbanNumber 2.91.9Other religiousConservative ChristianOther larSpecial emphasisSpecial 21.48.19.53.8School .735.1Program emphasisRegular elementary/secondaryMontessoriSpecial program emphasisSpecial educationVocational/technicalAlternativeEarly 1.5!Size (number of students)Less than 5050–149150–299300–499500–749750 or 40182792965.121.79.12.61.10.4Selected schoolcharacteristicTotalPrivate school typologyCatholicParochialDiocesanPrivateTownNumber PercentRuralNumber 16.476810.9! Interpret data with caution. The coefficient of variation for this estimate is between 30 and 50 percent (i.e., the standarderror is at least 30 percent and less than 50 percent of the estimate).‡ Reporting standards not met. There are fewer than 15 sample cases.NOTE: Detail may not sum to totals because of rounding or missing values in cells with too few sample cases. Theseestimates include private schools that provide instruction for one or more of grades kindergarten through 12 (orcomparable ungraded levels).SOURCE: U.S. Department of Education, National Center for Education Statistics, Private School Universe Survey(PSS), 2017–18.9
Table 5.Number and percentage distribution of private school students, by urbanicity type and selected school characteristics:United States, 2017–18Selected schoolcharacteristicTotalPrivate school typologyCatholicParochialDiocesanPrivateOther religiousConservative ChristianOther affiliatedUnaffiliatedNonsectarianRegularSpecial emphasisSpecial educationSchool levelElementarySecondaryCombinedProgram emphasisRegular elementary/secondaryMontessoriSpecial programemphasisSpecial educationVocational/technicalAlternativeEarly childhoodSize (number of students)Less than 5050–149150–299300–499500–749750 or moreSee notes at end of 2.4‡2.30.4 !21.523.826.013.09.26.6
Table 5.Number and percentage distribution of private school students, by urbanicity type and selected school characteristics:United States, ected 451
The average school size in 2017-18 was 151 students across all private schools. Private school size differed by instructional level. On average, elementary schools had 108 students, secondary schools had 284 students, and combined schools had 202 students (table 7).