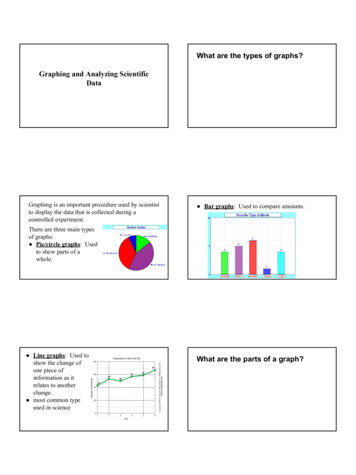
Transcription
Essential Graphs for MicroeconomicsBasic Economic Concepts Production Possibilities CurveGood XAConcepts:BPoints on the curve-efficientPoints inside the curve-inefficientPoints outside the curve-unattainablewith available resourcesGains in technology or resourcesfavoring one good both not other.WCDFEGood YNature & Functions of Product Markets Demand and Supply: Market clearing equilibriumPSVariations:Shifts in demand and supply caused bychanges in determinantsChanges in slope caused by changes inelasticityEffect of Quotas and TariffsPeDQeQ Floors and CeilingsPPSSPePeDQDQeQSFloor Creates surplus Qd QsDQQSQeQDQCeiling Creates shortage Qd Qs
Consumer and Producer SurplusPSConsumersurplusPeProducersurplusDQeQ Effect of TaxesA tax imposed on the SELLER-supplycurve moves leftelasticity determines whether buyeror seller bears incidence of taxshaded area is amount of taxconnect the dots to find the triangleof deadweight or efficiency loss.A tax imposed on the BUYER-demandcurve moves leftelasticity determines whether buyer orseller bears incidence of taxshaded area is amount of taxconnect the dots to find the triangleof deadweight or efficiency eivePD1QTheory of the Firm Short Run CostP/CMCATCAVCAFCQAFC declines as output increasesAVC and ATC declines initially, thenreaches a minimum then increases (Ushaped)MC declines sharply, reaches aminimum, the rises sharplyMC intersects with AVC and ATC atminimum pointsWhen MC ATC, ATC is fallingWhen MC ATC, ATC is risingThere is no relationship between MC andAFC
Long Run CostATCEconomiesof ScaleDiseconomiesof ScaleConstantReturnsto ScaleQ Perfectly Competitive Product Market StructureLong run equilibrium for the market and firm-price takersAllocative and productive efficiency at P MR MC min ATCPMCPSPeyMR D AR PPeDQeQQeQVariations:Short run profits, losses and shutdown cases caused by shifts in market demand andsupply. Imperfectly Competitive Product Market Structure: Pure MonopolySingle price monopolist(price maker)Earning economic profitMCPNatural Regulated MonopolySelling at Fair return ( Qfr at Pfr)MCATCPPmATCPFRDQMRPSOQDQmQFR QSOMRQ
Imperfectly Competitive Product Market Structure: MonopolisticallyCompetitiveLong run equilibrium where P AC at MR MC outputMCPATCVariations:PMCShort run profits, losses andshutdown cases caused byshifts in market demand andsupply.DQmcMRQFactor Market Perfectly Competitive Resource Market StructurePerfectly Competitive Labor Market – Wage takersFirm wage comes from market so changes in labor demand do not raise wages.Labor MarketSWageRateIndividual FirmWageRateS MRCWcWcD mrp’sQcVariations:QuantityDL mrpqcQuantityChanges in market demand and supply factors can influence the firm’s wage and numberof workers hired.
Imperfectly Competitive Resource Market StructureImperfectly Competitive Labor Market – Wage makersQuantity derived from MRC MRP (Qm)Wage (Wm) comes from that point downward to Supply curve.MRCWageRateSbWcaWmMRPcQmQcQ Market Failures - ExternalitiesMSCOverallocation of resources when external costs arePpresent and suppliers are shifting some of their costs ontoMPCthe community, making their marginal costs lower. Thesupply does not capture all the costs with the S curveunderstating total production costs. This means resourcesDare overallocated to the production of this product. Byshifting costs to the consumer, the firm enjoys S1 curveQoQeSpillover CostsPQand Qe., (optimum output ).Underallocation of resources when externalSbenefits are present and the market demandcurve reflects only the private benefits understatingthe total benefits. Market demand curve (D) andMSBthan Qo shown by the intersection of D1 and S withMPBQe QoSpillover Benefitsmarket supply curve yield Qe. This output will be lessQresources being underallocated to this use.
Thinking on the Margin Allocative Efficiency: Marginal Cost (MC) Marginal Benefit (MB)Definition: Allocative efficiency means that a good’s output is expanded until itsmarginal benefit and marginal cost are equal. No resources beyond that pointshould be allocated to production.Theory: Resources are efficiently allocated to any product when the MB and MC areequal.Essential Graph:MCMCThe point where MC MB isallocative efficiency sinceneither underallocation oroverallocation of resourcesoccurs.&MBMBQApplication: External Costs and External BenefitsExternal Costs and Benefits occur when some of the costs or the benefits of thegood or service are passed on to parties other than the immediate buyer or seller.MSCPExternal CostPMCExternalBenefitsMPCMBQoQeQExternal costsproduction or consumptioncosts inflicted on a third partywithout compensationpollution of air, water areexamplesSupply moves to rightproducing a larger output thatis socially desirable—overallocation of resourcesLegislation to stop/limitpollution and specific taxes(fines) are ways to correctMPBQe QoMSBQExternal benefitsproduction or consumption costsconferred on a third party orcommunity at large without theircompensating the producereducation, vaccinations are examplesMarket Demand, reflecting only privatebenefits moves to left producing asmaller output that society would like—under allocation of resourcesLegislation to subsidize consumersand/or suppliers and direct productionby government are ways to correct
Diminishing Marginal UtilityDefinition: As a consumer increases consumption of a good or service, the additionalusefulness or satisfaction derived from each additional unit of the good or servicedecreases.Utility is want-satisfying power— it is the satisfaction or pleasure one gets fromconsuming a good or service. This is subjective notion.Total Utility is the total amount of satisfaction or pleasure a person derives fromconsuming some quantity.Marginal Utility is the extra satisfaction a consumer realizes from an additionalunit of that product.Theory: Law of Diminishing Marginal Utility can be stated as the more a specificproduct consumer obtain, the less they will want more units of the same product. Ithelps to explain the downward-sloping demand curve.Essential Graph:Total Utility increases at adiminishing rate, reaches amaximum and lityMarginal Utility diminishes withincreased consumption, becomeszero where total utility is at amaximum, and is negative whenTotal Utility declines.UnitMUWhen Total Utility is atConsumedits peak, Marginal Utility is becomes zero. Marginal Utilityreflects the change in total utility so it is negative when Total Utility declines.Teaching Suggestion: begin lesson with a quick ―starter‖ by tempting a student withhow many candy bars (or whatever) he/she can eat before negative marginal utilitysets in when he/she gets sick!
Law of Diminishing ReturnsDefinitions:Total Product: total quantity or total output of a good producedMarginal Product: extra output or added product associated with adding a unitof a variable resourceMP change in total productD TP change in labor inputD LinputAverage Product: the output per unit of input, also called labor productivityAP total product TP units of laborLTheory: Diminishing Marginal Product a s successive units of a variable resource areadded to a fixed resource beyond some point the extra or the marginal product willdecline; if more workers are added to a constant amount of capital equipment,output will eventually rise by smaller and smaller amount.Essential Graph:TPTPNote that the marginalproduct intersects theaverage product at itsmaximum averageproduct.Quantity of rnsWhen the TP has reached itmaximum, the MP is at zero.As TP declines, MP is negative.DiminishingMarginalReturnsQuantity of LaborMPTeaching Suggestion: Use a game by creating a production factory (square off somedesks). Start with a stapler, paper and one student. Add students and record the ―marginalproduct‖. Comment on the constant level of capital and the variable students workers.
Short Run CostsDefinitions:Fixed Cost: costs which in total do not vary with changes in the output; costswhich must be paid regardless of output; constant over the outputexamples—interest, rent, depreciation, insurance, management salaryVariable Cost: costs which change with the level of output; increases in variablecosts are not consistent with unit increase in output; law of diminishing returns willmean more output from additional inputs at first, then more and more additionalinputs are needed to add to output; easier to control these types of costsexamples—material, fuel, power, transport services, most laborTotal Cost: are the sum of fixed and variable. Most opportunity costs will be fixedcosts.Average Costs (Per Unit Cost): can be used to compare to product priceAFC TFCQAVC TVCQATC TC(or AFC AVC)QMarginal Costs: the extra or additional cost of producing one more unit ofoutput; these are the costs in which the firm exercises the most controlMC D TCDQEssential Graph:P/CMCAFC declines as output increasesAVC declines initially thenreaches a minimum, thenincreases (a U-shaped curve)ATC will be U-shaped as wellMC declines sharply reaches, aminimum, and then rises sharply.MC intersects with AVC and ATCat minimum pointsATCAVCAFCQWhen MC ATC, ATC is fallingWhen MC ATC, ATC is risingThere is no relationship between MC and AFCTeaching Suggestion:Let students draw this diagram many times. Pay attentionto the position of the ATC and AVC and the minimum point of each. Reinforce thatthe MC passes through these minimums, but observe that the minimum position ofATC is to the right of AVC.
Marginal Revenue Marginal CostDefinitions:Marginal Revenue is the change in total revenue from an additional unit sold.Marginal Cost is the change in total costs from the production of another unit.Theory: Competitive Firms determine their profit-maximizing (or loss-minimizing)output by equating the marginal revenue and the marginal cost. The MR MC rule willdetermine the profit maximizing output.Essential Graph:In the long run for a perfectlycompetitive firm, after all thechanges in the market (moredemand for the product, firmsentering in search of profit, andthen firms exiting becauseeconomic profits are gone), longrun equilibrium is established. Inthe long run, a purelycompetitive firm earns onlynormal profit since MR P D MCat the lowest ATC. This conditionis both Allocative and ProductiveEfficient.MCATCPPeP D MR ARQeQPMCATCPUnitCostMR MCFor a single pricemonopolist, the outputis determined at theMR MC intersectionand the price isdetermined where thatoutput meets thedemand curve.DQMRQTeaching Suggestion: Be sure to allow students to practice the drawing of the shortrun graphs as the lead in to the understanding of the long-run equilibrium incompetitive firms and its meaning. Always begin with this lesson by showing why theDemand curve and the MR curve are the same since a perfectly competitive sellerearns the price each time another unit is sold.
Marginal Revenue Product Marginal Resource CostDefinition:MRP is the increase in total revenue resulting from the use of each additionalvariable input (like labor). The MRP curve is the resource demand curve.Location of curve depends on the productivity and the price of the product.MRP MP x PMRC is the increase in total cost resulting from the employment of eachadditional unit of a resource; so for labor, the MRC is the wage rate.Theory: It will be profitable for a firm to hire additional units of a resource up to thepoint at which that resource’s MRP is equal to its MRC.Essential Graphs:In a purely competitive market:large number of firms hiring a specific type of labornumerous qualified, independent workers with identical skillsWage taker behavior—no ability to control wage on either sideIn a perfectly competitive resource market like labor, the resource price isgiven to the firm by the market for labor, so their MRC is constant and is equalto the wage rate. Each new worker adds his wage rate to the total wagecost. Finding MRC MRP for the firm will determine how many workers the firmwill hire.Labor MarketIndividual FirmSWageRateWageRateS MRCWcWcD mrp’sQcDL mrpqcQuantityQuantityIn a monopsonistic market, an employer of resources has monopolistic buying(hiring) power. One major employer or several acting like a single monopsonist ina labor market. In this market:single buyer of a specific type of laborlabor is relatively immobile—geography or skill-wisefirm is ―wage maker‖ —wage rate paid varies directly with the # of workershiredMRCWageRateSbWcWmaMRPcQmQcQThe employer’s MRC curve liesabove the labor S curve since itmust pay all workers the higherwage when it hires the next workerthe high rate to obtain his services.Equating MRC with MRP at point b,the monopsonist will hire Qm workersand pay wage rate Wm.
Thinking on the Margin Allocative Efficiency: Marginal Cost (MC) Marginal Benefit (MB) Definition: Allocative efficiency means that a good's output is expanded until its marginal benefit and marginal cost are equal. No resources beyond that point should be allocated to production.