Transcription
OLDERAMERICANS2019PROFILE OFPUBLICATION DATE: MAY 2020The Administration for Community Living, which includesthe Administration on Aging,2019is anPROFILEoperatingdivision of theOF OLDER AMERICANS PAGE 1U.S. Department of Health and Human Services.
Profile NotesThis report is prepared by the Administration on Aging (AoA), part of theAdministration for Community Living, an operating division of the U.S. Departmentof Health and Human Services.AoA serves as an advocate for older adults within the federal government andis working to encourage and coordinate a responsive system of family- andcommunity-based services throughout the nation. AoA helps states developcomprehensive service systems which are administeredby a national network of 56 state agencies on aging,The Profile629 area agencies on aging, nearly 20,000 serviceincorporates the latestproviders, and 282 Title VI grantees representing overdata available, but not400 Federally recognized tribes, made up of 281 Tribalall items are updatedorganizations and 1 Native Hawaiian organization.on an annual basis, sothere is a combinationPrincipal sources of data are the U.S. Census Bureau,of data rangingthe National Center for Health Statistics, and thefrom 2015 to 2019Bureau of Labor Statistics. A complete list of sourcespresented herein.appears at the end of this report.This report includes data on the American population age 65 and older unlessotherwise noted. The phrases “older adults” and “older persons” refer to thatpopulation. Age-adjusted estimates are used when available.The data presented refer to the noninstitutionalized population except where noted.Some numbers in this report may not add up due to rounding.2019 PROFILE OF OLDER AMERICANS PAGE 2
Profile Highlights Over the past 10 years, the population age 65 and older increased from 38.8million in 2008 to 52.4 million in 2018 (a 35% increase) and is projected toreach 94.7 million in 2060.POPULATION GROWTH38.8 MILLION (2008)52.4 MILLION (2018)94.7 MILLION (2060) Racial and ethnic minority populations have increased from 7.5 million in 2008(19% of the older adult population) to 12.3 million in 2018 (23% of older adults)and are projected to increase to 27.7 million in 2040 (34% of older adults). The number of Americans age 45-64—who will reach age 65 during the nexttwo decades—increased by 7% between 2008 and 2018. In 2018, more than one in every seven Americans is an older adult. There were 93,927 persons age 100 and older in 2018 (0.2% of the total age 65and older population). In 2018, older women outnumber older men at 29.1 million older women to 23.3million older men.23.3 MILLION OLDER MEN (2018)29.1 MILLION OLDER WOMEN (2018) In 2018, 23% of persons age 65 and older were members of racial or ethnicminority populations: 9% were African Americans (not Hispanic), 5% were Asian(not Hispanic), 0.5% were American Indian and Alaska Native (not Hispanic),0.1% were Native Hawaiian/Pacific Islander (not Hispanic), and 0.8% of persons65 and older identified themselves as being of two or more races. Persons ofHispanic origin (who may be of any race) represented 8% of the older population.2019 PROFILE OF OLDER AMERICANS PAGE 3
In 2018, nearly 1 in 10 older adults (9.7%, or 5,146,000) lived below the povertylevel. This poverty rate is not statistically different from the poverty rate amongolder adults in 2017 (9.2%).NEARLY 1 IN 10 OLDER ADULTS LIVE BELOWPOVERTY LEVEL (2018) A larger percentage of older men (69%) were married as compared to olderwomen (47%). In 2019, 31% of older women were widows. As of 2019, about 28% (14.7 million) of older persons lived alone (5 million men,9.7 million women). Among women age 75 and older, 44% lived alone. The median income of older persons in 2018 was 34,267 for men and 20,431 for women. The real median income (after adjusting for inflation) of allhouseholds headed by older people increased by 3.3% (which was statisticallysignificant) between 2017 and 2018. Households containing families headed bypersons age 65 and older reported a median income in 2018 of 64,023. The need for caregiving increases with age. In 2018, the percentage of olderadults age 85 and older who needed help with personal care (21%) was morethan twice the percentage for adults ages 75–84 (8%) and five times thepercentage for adults ages 65–74 (4%). The 85 and older population is projected to more than double from 6.5 million in2018 to 14.4 million in 2040 (a 123% increase).AGE 85 AND OVER PROJECTED GROWTH(IN MILLIONS)6.5 (2018)2019 PROFILE OF OLDER AMERICANS PAGE 414.4 (2040)
The Older American PopulationIn the United States, the population age 65 and older numbered 52.4 million in2018 (the most recent year for which data are available). They represented 16%of the population, more than one in every seven Americans. The number of olderAmericans has increased by 13.7 million (or 35%) since 2008, compared to anincrease of 4% for the under-65 population.Between 2008 and 2018, the number of Americans age 45-64 (who will reach age65 over the next two decades) increased by 7% from 78.6 million to 83.9 million.The number of Americans age 60 and older increased by 34% from 54.1 million to72.8 million.In 2018, 29.1 million women and 23.3 million men were over the age of 65. That’s125 women for every 100 men. At age 85 and older, this ratio increased to 181women for every 100 men.Since 1900, the percentage of Americans age 65 and older more than tripled (from4.1% in 1900 to 16% in 2018), and the number increased more than 16 times (from3.1 million to 52.4 million). The older population itself became increasingly older.In 2018, the 65-74 age group (30.5 million) was more than 13 times larger than in1900 (2,186,767); the 75-84 group (15.4 million) was 20 times larger (771,369),and the 85 group (6.5 million) was more than 53 times larger (122,362).In 2018, persons reaching age 65 had an average life expectancy of an additional19.5 years (20.7 years for women and 18.1 years for men). A child born in 2018could expect to live 78.7 years, more than 30 years longer than a child born in1900 (47.3 years).In 2018, 3.7 million persons celebrated their 65th birthdays. Census Bureaupopulation estimates showed an annual net increasebetween 2017 and 2018 of 917,687 people age 65.There were 93,927persons age 100 andBetween 1980 and 2018, the centenarian populationolder in 2018 – almostexperienced a larger percentage increase than did thetriple the 1980 figuretotal population.of 32,194.Future GrowthThe older population is expected to continue to grow significantly in the future.Growth slowed somewhat during the 1990s because of the relatively small numberof babies born during the Great Depression of the 1930s. But the older populationis beginning to burgeon again as more than one-third (36%) of the “baby boom”generation is now age 65 and older.2019 PROFILE OF OLDER AMERICANS PAGE 5
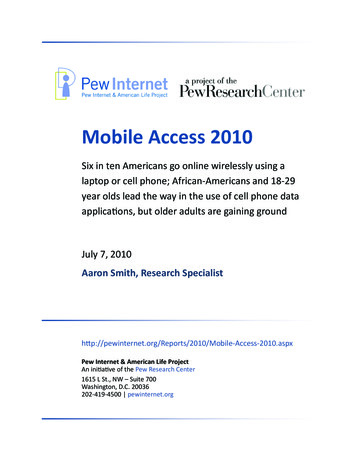
The population age 65 and older increased from 38.8 million in 2008 to 52.4 millionin 2018 (a 35% increase) and is projected to reach 94.7 million in 2060. By 2040,there will be about 80.8 million older persons, more than twice as many as in 2000.People age 65 and older represented 16% of thepopulation in the year 2018 but are expected to grow to be21.6% of the population by 2040.The 85 and older population is projected to more than double from 6.5 million in2018 to 14.4 million in 2040 (a 123% increase).Number of Persons Age 65 and Older 1900 to 2060(numbers in millions)Note: Increments in years are uneven. Lighter bars (2020, 2040, and 2060)indicate projections.Source: U.S. Census Bureau, Population Estimates and Projections.Racial and ethnic minority populations increased from 7.5 million in 2008 (19%of the older adult population) to 12.3 million in 2018 (23% of older adults) and areprojected to increase to 27.7 million in 2040 (34% of older adults). Between 2018and 2040, the white (not Hispanic) population age 65 and older is projected toincrease by 32% compared to 125% for older racial and ethnic minority populations,including Hispanics (175%), African Americans (not Hispanic) (88%), American Indianand Alaska Native (not Hispanic) (75%), and Asians (not Hispanic) (113%).2019 PROFILE OF OLDER AMERICANS PAGE 6
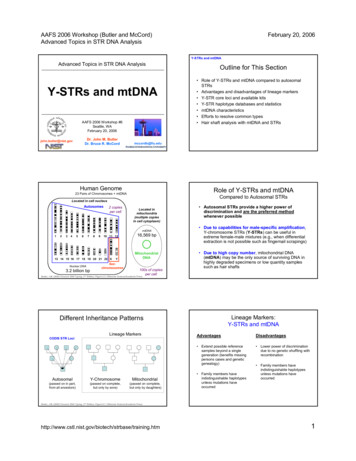
Marital StatusIn 2019, a larger percentage of older men (69%) than older women (47%)were married.Widows accounted for 31% of all older women in 2019. There were more thanthree times as many widows (8.9 million) as widowers (2.6 million).Divorced and separated older persons represented only 15% ofall older persons in 2019, which is unchanged from 2018. However, thispercentage has increased since 1980, when approximately 5%of the older population were divorced or separated/spouse absent.Marital Status of Persons Age 65 and Older, 2019Source: U.S. Census Bureau, Current Population Survey, Annual Social and Economic Supplement.Living ArrangementsOf the older adults living in the community, more than half (57%) of persons age 65and older lived with their spouse (including partner) in 2019. Approximately 17.3million or 72% of older men, and 14.1 million or 49% of older women, lived withtheir spouse.About 28% (14.7 million) of all older adults living in the community in 2019 lived alone(5 million men, 9.7 million women). They represented 21% of older men and 34% ofolder women. The proportion living alone increases with advanced age for both menand women. Among women age 75 and older, for example, 44% lived alone.2019 PROFILE OF OLDER AMERICANS PAGE 7
Living Arrangements of Persons Age 65 and Older, 2019Sources: U.S. Census Bureau, Current Population Survey, Annual Social and Economic Supplement1967 to present.A relatively small number of people (1.2 million) age 65 and older lived in nursinghomes in 2018. However, the percentage increases dramatically with age, rangingfrom 1% for persons ages 65-74 to 2% for persons ages 75-84 and 7% forpersons over age 85.Racial and Ethnic CompositionIn 2018, 23% of persons age 65 and older were members of racial or ethnicminority populations—9% were African Americans (not Hispanic), 5% were Asian(not Hispanic), 0.5% were American Indian and Alaska Native (not Hispanic), 0.1%were Native Hawaiian/Pacific Islander, (not Hispanic),and 0.8% of persons age 65 and older identifiedPersons of Hispanicthemselves as being of two or more races.origin (who may be ofany race) representedOnly 9% of all the people who were members of racial8% of the olderand ethnic minority populations were age 65 and olderpopulation.in 2018 compared to 20% of non-Hispanic whites. Thepercentage of people age 65 and older within each racial and ethnic minority groupwere as follows: 12% of African Americans (not Hispanic), 13% of Asians (notHispanic), 10% of Native Hawaiian and Other Pacific Islanders (not Hispanic), 12%of American Indian and Alaska Native (not Hispanic), and 7% of Hispanics.Geographic DistributionThe proportion of older persons in the population varied considerably by state,with some states experiencing much greater growth in their older populations. In2018, 51% of persons age 65 and older lived in 9 states: California (5.7 million);Florida (4.4 million); Texas (3.6 million); New York (3.2 million); Pennsylvania (2.3million); Ohio (2 million); Illinois (2 million); Michigan (1.7 million); and North Carolina(1.7 million). Georgia, New Jersey, Virginia, Arizona, Washington, Massachusetts,Tennessee, Indiana, and Missouri each had more than 1 million people age 65 andolder in 2018.2019 PROFILE OF OLDER AMERICANS PAGE 8
About half ofpeople 65 andolder lived in oneof 9 states.The three states with the highest percentage of their populations age 65 and olderin 2018 were Maine (21%), Florida (21%), and West Virginia (20%).In three states, the age 65 and older population increased by 57% or morebetween 2008 and 2018: Alaska (69%), Nevada (57%), and Colorado (57%).The 12 states with poverty rates at or above 10% for older adults during 2018were: District of Columbia (16.7%), New Mexico (13.3%), Louisiana (12.4%),Mississippi (12.4%), New York (11.8%), Rhode Island (11.2%), Texas (11.1%),Florida (10.6%), California (10.5%), Alabama (10.3%), North Dakota (10.3%),Arkansas (10.2%), Georgia (10.2%), Kentucky (10.2%), and West Virginia (10.0%).A smaller percentage of older adults changed residence as compared with youngerage groups. From 2018 to 2019, only 4% of older persons moved as opposed to11% of the population below the age 65. Most older movers (58%) stayed in thesame county. The other older movers either remained in the same state (23%) ormoved out-of-state or abroad (19%).2019 PROFILE OF OLDER AMERICANS PAGE 9
Persons Age 65 and Older as a Percentage of Total Population 2018Percent Increase in Population Age 65 and Older, 2008 to 2018Source: U.S. Census Bureau, Population Estimates.2019 PROFILE OF OLDER AMERICANS PAGE 10
The 65 and Older Population by State, 2018Persons65 United States (50 States DC) 9Connecticut615,121Delaware181,086District of 3,666Nevada476,181New Hampshire245,645New Jersey1,438,527New Mexico366,189New York3,213,534North Carolina1,689,265North Dakota116,637State% 6%18%16%18%16%16%15%% %26%57%43%24%42%26%44%22%2019 PROFILE OF OLDER AMERICANS PAGE 11% 3.3%11.8%8.7%10.3%
StateOhioOklahomaOregonPennsylvaniaPuerto RicoRhode IslandSouth CarolinaSouth est VirginiaWisconsinWyomingPersons65 11,164,232359,878985,47395,375% %15%20%17%17%% 38%41%50%23%30%42%% 11.1%6.1%9.3%8.4%7.2%10.0%7.9%7.3%Notes: Poverty data for US total are from the Current Population Survey. Povertydata for states and Puerto Rico are from the American Community Survey.Sources: U.S. Census Bureau, Population Estimates; Current Population Survey, Annual Social andEconomic Supplement; American Community Survey.IncomeThe median income of older persons in 2018 was 25,601. Men had a highermedian income overall: 34,267 compared to 20,431 for women. From 2017 to2018, the real median income (after adjusting for inflation) of all households headedby older people increased by 3.3% which was statistically significant. Householdscontaining families headed by persons age 65 and older reported a median incomein 2018 of 64,023 ( 67,904 for non-Hispanic Whites, 41,928 for Hispanics, 47,149 for African Americans, and 63,528 for Asians). About 5% of familyhouseholds with an older adult householder had incomes less than 15,000 and77% had incomes of 35,000 or more.2019 PROFILE OF OLDER AMERICANS PAGE 12
Percent Distribution by Income: 2018Family Households with Age 65 and Older Householder, 2018 64,023 median income for 18.4 million family households with age 65 and overhouseholder.Persons Age 65 and Older Reporting Income, 2018 25,601 median income for 52.8 million persons 65 and older reporting income.Note: Percentages may not add to 100 due to rounding.Source: U.S. Census Bureau, Current Population Survey, Annual Social and Economic Supplement.For all older persons reporting income in 2018 (52.8 million), 14% reported lessthan 10,000 and 52% reported 25,000 or more.The Bureau of Consumer Financial Protection defines financial well-being as beingable to meet current and ongoing financial obligations, feeling financially secure inthe present and future, and being able to make choices that allow them to enjoylife. In 2015, adults age 62 and older who retired when they planned to scoredhigher on a financial well-being scale than those who retired earlier or later thanthey originally planned.2019 PROFILE OF OLDER AMERICANS PAGE 13
PovertyIn 2018, nearly 1 in 10 people age 65 and older (9.7% or 5.1 million) lived belowthe poverty level. 1 This poverty rate is not statistically different from the povertyrate in 2017 (9.2%). Another 2.3 million or 4.4% of older adults were classified as“near-poor” (income between the poverty level and 125% of this level).In 2018, 3 million older Whites (alone, not Hispanic) (7.3%) were poor, comparedto 18.9% of older African Americans (alone), 11.7% of older Asians (alone), and19.5% of older Hispanics (any race).Percentage of Persons Age 65 and Over Living Below thePoverty Level by Race and Hispanic Origin, 2018Source: U.S. Census Bureau, Current Population Survey, Annual Social and Economic Supplement.Older women had a higher poverty rate (9.7%) than older men (8.1%) in 2018. Ahigher percentage of older persons living alone were poor (17.3%) as comparedwith older persons living with families (6.4%).The highestIn 2011, the U.S. Census Bureau released a newpoverty rates wereSupplemental Poverty Measure (SPM). The SPMexperienced amongmethodology shows a significantly higher number ofolder Hispanic womenolder persons below poverty than is shown by thewho lived aloneofficial poverty measure. For persons age 65 and(37.8%).older, this poverty measure showed a poverty level of13.6% in 2018—almost 4 percentage points higher than the official rate of 9.7%.Unlike the official poverty rate, the SPM takes into account regional variations inthe cost of housing etc. and, even more significantly, the impact of both non-cashbenefits received (e.g., SNAP/food stamps, low income tax credits, and WIC) andnon-discretionary expenditures including medical out-of-pocket expenses. Forpersons 65 and older, medical out-of-pocket expenses were the major source ofthe significant differences between these measures. The SPM does not replace theofficial poverty measure.2019 PROFILE OF OLDER AMERICANS PAGE 14
HousingOf the 12.9 million households headed by persons age 75 and older in 2017,76% owned their homes and 24% rented. The median family income of olderhomeowners was 32,800. The median family income of older renters was 17,000. In 2017, 37% of older householders spent one-third or more of theirincome on housing costs: 30% for owners and 65% for renters.Persons Age 75 Who Spent One-Third or More of TheirIncome on Housing Costs, 2017Source: Department of Housing and Urban Development,American Housing Survey.For older homeowners age 75 and older in 2017, the median construction yearwas 1971 compared to 1978 for all homeowners. Among the homes owned bypeople age 75 and older, 2.7% had moderate to severe problems with plumbing,heating, electric, wiring, and/or upkeep. In 2017, the median value of homesowned by older persons was 175,000 (with a median purchase price of 65,000).In comparison, the median home value of all homeowners was 200,000 (with amedian purchase price of 137,000).EmploymentIn 2019, 10.7 million (20.2%)Americans age 65 and olderwere in the labor force(working or actively seeking work)INCLUDING 5.9MILLION MEN (24.7%)AND 4.8 MILLIONWOMEN (16.4%)Older adults constituted 6.5% of the U.S. labor force. Approximately 3% wereunemployed.Labor force participation of men age 65 and older decreased steadily from 63.1%in 1900 to 45.8% in 1950 and then to 15.8% in 1985. It stayed under 20% until2006 and has been hovering around 23%-24% for the last few years. The laborforce participation rate for women age 65 and older rose slightly from 8.3% in1900 to 9.7% in 1950 and then fell to 7.3% in 1985. It stayed at 8%-9% during the1990s. Beginning in 2000, the labor force participation rate of older women startedto gradually rise to the 2019 level of 16.4%.2019 PROFILE OF OLDER AMERICANS PAGE 15
Employment Status of Persons Age 65 and Over by Sex, SelectedYears 1900 to 2019Note: Increments between years are uneven. While the enactment of the SocialSecurity Act in 1935 played an important role in the declining labor forceparticipation rates among men age 65 , research suggests the decline may havestarted as early as 1880.Source: Bureau of Labor Statistics, Current Population Survey, Labor Force Statistics, Household Data;U.S. Census Bureau, Decennial Census, 1990.2019 PROFILE OF OLDER AMERICANS PAGE 16
EducationThe educational level of the older population is increasing.Between 1970 and 2019, the percentage of older personswho had completed high school rose from 28% to 88%.Almost one-third (31%) in 2019 had a bachelor’s degree or higher. The percentagewho had completed high school varied considerably by race and ethnic origin in2019: 92% of Whites alone (not Hispanic), 79% of African Americans alone, 80%of Asians alone, and 59% of Hispanics. The increase in educational levels is alsoevident within these groups. In 1970, only 30% of older Whites and 9% of olderAfrican Americans were high school graduates.Health and Health CareIn 2018, 45% of noninstitutionalized people age 65 and older assessed their healthas excellent or very good compared to 65% for persons ages 18-64 years.Leading chronic conditions among adults age 65Most older personsand older include heart disease (28% in 2016-2017),have at least onephysician-diagnosed and undiagnosed diabetes (28% inchronic condition2013-2016), cancer (19% in 2016-2017), stroke (9% inand many have2016-2017), and arthritis (54% in 2018 among peoplemultiple conditions.age 75 and older). In 2013-2016, 67% of men age 75and older and 79% of women age 75 and older hadhypertension or were taking antihypertensive medication.In 2018, 69% of people age 65 and older reported that they received an influenzavaccination during the past 12 months and 69% reported that they had everreceived a pneumococcal vaccination. Only 9% of persons age 65 and olderreported that they were current smokers and 8% reported excessive alcoholconsumption. 2 Approximately 3% of persons age 65 and olderreported that they had experienced serious psychologicaldistress during the past 30 days.In 2018, 8.5 million people age 65 and older stayed ina hospital overnight at least one night during the year.Among this group of older adults, 11% stayed overnight 1 time, 3% stayedovernight 2 times, and 3% stayed overnight 3 or more times. This wasapproximately double the number of overnight hospital stays for the populationages 45 to 64: 5% had stayed overnight 1 time, 2% stayed overnight 2 times, and2019 PROFILE OF OLDER AMERICANS PAGE 17
1% stayed overnight 3 or more times. Older persons averaged more office visitswith doctors than younger persons in 2018. Among people age 75 and older, 22%had 10 or more visits to a doctor or other health care professional in the past 12months compared to 19% among people ages 65 to 74, 14% among people ages45 to 64, and 11% among people ages 18 to 44.In 2018, 97% of persons age 75 and older reported that they had a usual place togo for medical care and only 3% of people age 65 and older said that they failed toobtain needed medical care during the previous 12 months due to cost.In 2018, consumers age 65 and older averaged out-of-pocket health careexpenditures of 6,802, an increase of 48% since 2008 ( 4,605). In contrast, thetotal population spent considerably less, averaging 4,968 in out-of-pocket costs.Older Americans spent 11.9% of their total expenditures on health, as compared to8.1% among all consumers. Health costs incurred on average by older consumersin 2018 consisted of 4,776 (70%) for insurance, 3 998 (15%) for medical services, 768 (11%) for drugs, and 260 (4%) for medical supplies.Health Insurance CoverageIn 2018, almost all (95%) non-institutionalized persons age 65 and older werecovered by Medicare. Medicare covers mostly acute care services and requiresbeneficiaries to pay part of the cost, leaving about half of health spending to becovered by other sources. About half of older adults (50%) had some type ofprivate health insurance, 6% had military-based health insurance, 6% were coveredby Medicaid, and 1% had no coverage.Percentage of Persons Age 65 and Over by Type of HealthInsurance Coverage, 2018Note: A person can be represented in more than one category.Source: U.S. Census Bureau, Current Population Survey, Annual Social and Economic Supplement.2019 PROFILE OF OLDER AMERICANS PAGE 18
Disability and Physical FunctioningAccording to the U.S. Census Bureau’s American Community Survey, 34% ofpeople age 65 and older reported having some type of disability (i.e., difficulty inhearing, vision, cognition, ambulation, self-care, or independent living) in 2018.The percentages for individual disabilities ranged from 21% having an ambulatorydisability to 6% having a vision difficulty.Percentage of Persons Age 65 and Over with a Disability, 2018Source: U.S. Census Bureau, American Community Survey.In 2018, 49% of people age 75 and older reported having a difficulty in physicalfunctioning. This percentage is more than twice as large as for the age group45 to 64 (19%). The percentage of people age 75 and older reporting difficultiesin physical functioning ranged from 5% reporting it was very difficult to (orcannot) sit for two hours to 33% reporting it was very difficult to (or cannot)stand for two hours.CaregivingThe need forcaregiving increaseswith age.In 2018, the percentage of older adults age 85 and olderneeding help with personal care (21%) was more thantwice the percentage for adults ages 75–84 (8%) andfive times the percentage for adults ages 65–74 (4%).Older adults often also provide care to younger family members. For example,approximately 1.1 million grandparents age 60 and older were responsible for thebasic needs of one or more grandchildren under age 18 living with them in 2018.Of these caregivers, 59% were grandmothers and 41% were grandfathers.2019 PROFILE OF OLDER AMERICANS PAGE 19
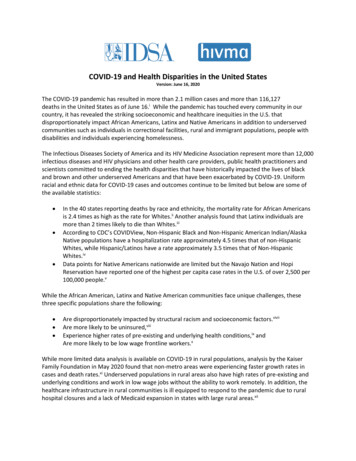
In addition, in 2017, among the 5.3 million people with Intellectual andDevelopmental Disabilities (I/DD) living with a family caregiver, 24% had caregiverswho were age 60 and older (1,299,389). The percentage of people with I/DD livingwith older caregivers ranged from 12% in Alaska to 24% in Florida.SPECIAL SECTION: ObesityObesity is a major cause of preventable disease and premature death and is aserious concern for older adults. Obesity is measured by dividing a person’s weight inkilograms by their height in meters squared to calculate their body mass index (BMI).Starting at 25.0, the higher a person’s BMI, the greater is their risk of developingobesity-related health problems. People who have obesity, compared to those with anormal or healthy weight, are at increased risk for many serious diseases and healthconditions, including all-causes of death, hypertension, hyperlipidemia, diabetes,heart disease, stroke, gallbladder disease, osteoarthritis, sleep apnea and breathingproblems, mental illness such as clinical depression, anxiety, and other mentaldisorders, and body pain and difficulty with physical functioning.Percentage of People Age 55 and Older Who Are Overweight orObese by Age Group and Sex, 2013-2016Note: Body mass index equals weight in kilograms divided by height in meters squared.Source: Centers for Disease Control and Prevention, National Center for Health Statistics, National Healthand Nutrition Examination Survey.2019 PROFILE OF OLDER AMERICANS PAGE 20
The most recent national data on obesity prevalence among U.S. adults, showthat more than 60% of adults age 55 and older were overweight or obese in 20132016. The highest prevalence was 79% among men age 65 to 74 and the lowestprevalence, 67%, was among women age 75 and older.Age differences inobesity prevalencevary between menand women.The prevalence of obesity was higher among women age 55to 64 (48%) compared with women age 65 to 74 (44%) and75 and older (32%). Among men, the prevalence of obesitywas approximately the same for men age 55 to 64 (39%) and65 to 74 (40%) and less for men 75 and older (23%).Percentage of Men Age 55 and Older Who Are Overweight orObese by Age Group, 1988-2016Percentage of Women Age 55 and Older Who Are Overweight orObese by Age Group, 1988-2016Source: Centers for Disease Control and Prevention, National Center for Health Statistics, National Healthand Nutrition Examination Survey.2019 PROFILE OF OLDER AMERICANS PAGE 21
The prevalence of obesity has increased over time for both men and women age55 and older. The largest increase was among men age 75 and older from 57% in1988-1994 to 75% in 2013-2016.In recent years, the prevalence of obesity leveled off at around 75% for the agegroup 55-64 for both men and women, however the older age groups continued tosee an increase.SPECIAL SECTION: Aerobic Activity andMuscle-Strengthening ActivitiesAerobic activity and muscle-strengthening activities are important for older adultsto improve overall health and reduce the risk of many health problems. Accordingto the HHS Office of Disease Prevention and Health Promotion’s Physical Activityguidelines for Americans, the key guidelines for older adults include 150-300minutes a week of moderate-intensity or 75 to 150 minutes of vigorous-intensityaerobic physical activity, or an equivalent combination of moderate- and vigorousintensity aerobic activity. Adults should also engage in muscle-strengtheningactivities of moderate or greater intensity and that involve all major muscle groupson 2 or more days
Of the older adults living in the community, more than half (57%) of persons age 65 and older lived with their spouse (including partner) in 2019. Approximately 17.3 million or 72% of older men, and 14.1 million or 49% of older women, lived with their spouse. About 28% (14.7 million) of all older adults living in the community in 2019 lived alone