Transcription
2016Older AmericansKey Indicators of Well-Being
Federal Interagency Forum on Aging-Related StatisticsThe Federal Interagency Forum on Aging-Related Statistics (Forum) was founded in 1986 to fostercollaboration among Federal agencies that produce or use statistical data on the older population. Forumagencies as of June 2016 are listed below.Consumer Product Safety Commissionhttp://www.cpsc.govDepartment of CommerceU.S. Census Bureauhttp://www.census.govDepartment of Health and Human ServicesDepartment of Housing and UrbanDevelopmenthttp://www.hud.govDepartment of LaborBureau of Labor Statisticshttp://www.bls.govAdministration for Community Livinghttp://www.acl.govEmployee Benefits Security Administrationhttp://www.dol.gov/ebsaAgency for Healthcare Research and Qualityhttp://www.ahrq.govDepartment of Veterans AffairsCenters for Medicare and Medicaid Serviceshttp://www.cms.govEnvironmental Protection AgencyNational Center for Health Statisticshttp://www.cdc.gov/nchsOffice of Management and BudgetNational Institute on Aginghttp://www.nia.nih.govOffice of the Assistant Secretary for Planning ttp://www3.epa.gov/Office of Statistical and Science Policyhttp://www.whitehouse.gov/omb/inforeg statpolicySocial Security AdministrationOffice of Research, Evaluation, and Statisticshttp://www.ssa.govSubstance Abuse and Mental Health ht information: All material appearing in this report is in the public domain and may be reproduced or copied without permission; citationas to source, however, is appreciated. Recommended citation: Federal Interagency Forum on Aging-Related Statistics. Older Americans 2016: KeyIndicators of Well-Being. Federal Interagency Forum on Aging-Related Statistics. Washington, DC: U.S. Government Printing Office. August 2016.Report availability: Single copies of this report are available at no charge through the National Center for Health Statistics while supplies last. Requestsmay be sent to the Information Dissemination Staff, National Center for Health Statistics, 3311 Toledo Road, Room 5412, Hyattsville, MD 20782.Copies may also be ordered by calling 1-866-441-NCHS (6247) or by e-mailing nchsquery@cdc.gov. This report is also available on the World WideWeb at http://www.agingstats.gov.
Older Americans 2016Key Indicators of Well-Being
ForewordOlder Americans (those age 65 and over) are a vibrantand growing part of our Nation. They also experienceunique challenges to their economic well-being, health,and independence. To inform decisions regarding thesupport and well-being of older Americans, robuststatistics reflecting these experiences are needed. Althoughmany Federal agencies provide statistics on aspects ofolder Americans’ lives, it can be difficult to fit the piecestogether into a comprehensive representation. Thus, it hasbecome increasingly important for policymakers and thegeneral public to have an accessible, easy-to-understandportrait of how older Americans fare.Older Americans 2016: Key Indicators of Well-Being(Older Americans 2016) provides a comprehensive,easy-to-understand picture of our older population. Itis the seventh such chartbook prepared by the FederalInteragency Forum on Aging-Related Statistics (Forum).Readers will find here an accessible compendium ofindicators drawn from the most reliable official statistics.Indicators are categorized into six broad groups:Population, Economics, Health Status, Health Risks andBehaviors, Health Care, and Environment.The Forum’s recent review of the Older Americanschartbook resulted in the addition of several newindicators particularly relevant to many of the challengescurrently facing older Americans. Among these additionsare an indicator describing the changing demographics ofSocial Security beneficiaries and an indicator describingtransportation access for older Americans. Indicators havealso been added to describe dementia rates (includingAlzheimer’s disease rates, among the non-nursing homepopulation) as well as to examine the number of olderAmericans receiving long-term care by different typesof providers. Finally, the Supplemental Poverty Measure(SPM) for Americans age 65 and over has been added.The SPM extends the official poverty measure by takinginto account many government programs designed toassist low-income families that are not included in theofficial poverty measure.Although Federal agencies currently collect and reportsubstantial information on the population age 65 andover, other important gaps in our knowledge remain.In Older Americans 2012, the Forum identified six suchareas where more data are needed: informal caregiving,residential care, elder abuse, functioning and disability,mental health and cognitive functioning, pensionmeasures, and end-of-life issues. In Older Americans 2016,we provide updated information on the data availabilityfor these specific areas, in addition to a special feature oninformal caregiving.We continue to appreciate users’ requests for greater detailfor many existing indicators. We also extend an invitationto all of our readers and partners to let us know what elsewe can do to make our reports more accessible and useful.Please send any comments to agingforum@cdc.gov.The Older Americans reports reflect the Forum’scommitment to advancing our understanding of whereolder Americans stand today and what challenges theymay face tomorrow. I congratulate the Forum agenciesfor joining together to present the American people withsuch valuable tools for understanding the well-being of theolder population. Last, but not least, none of this workwould be possible without the continued cooperation ofmillions of American citizens who willingly provide thedata that are summarized and analyzed by staff in theFederal agencies for the American people.Katherine K. WallmanChief StatisticianOffice of Management and Budgetiii
AcknowledgmentsOlder Americans 2016: Key Indicators of Well-Being is areport of the Federal Interagency Forum on Aging-RelatedStatistics (Forum). This report was prepared by the Forum’splanning committee and reviewed by the Forum’s principalmembers, which include Vicki Gottlich and RobertHornyak (retired), Administration for Community Living(ACL); Steven B. Cohen, Agency for Healthcare Researchand Quality (AHRQ); Dorinda Allard, Bureau of LaborStatistics (BLS); Karen Humes and Roberto Ramirez, U.S.Census Bureau; Debra Reed-Gillette, Centers for Medicare& Medicaid Services (CMS); Kathleen Stralka, U.S.Consumer Product Safety Commission (CPSC); LynnRoss, Department of Housing and Urban Development(HUD); Joseph Piacentini and Anja Decressin, EmployeeBenefits Security Administration (EBSA); Kathy Sykes,Environmental Protection Agency (EPA); Charles Rothwelland Jennifer Madans, National Center for Health Statistics(NCHS); John Haaga and John Phillips, National Instituteon Aging (NIA); Ruth Katz and William Marton, Officeof the Assistant Secretary for Planning and Evaluation(ASPE), Department of Health and Human Services;Katherine K. Wallman, Office of Management and Budget(OMB); Daryl Kade, Substance Abuse and Mental HealthServices Administration (SAMHSA); Howard Iams, SocialSecurity Administration (SSA); and Dat Tran and RichardAllman, Department of Veterans Affairs (VA).The Forum’s planning committee and contributing staffmembers include Forum Staff Director, Traci Cook; SusanJenkins and Kristen Robinson, ACL; David KashiharaAHRQ; Emy Sok, BLS; Amy Symens Smith and Wan He,U.S. Census Bureau; Kathleen Stralka, CPSC; KatherineGiuriceo and Lisa Mirel, CMS; Meena Bavan, HUD;Allan Beckmann and Lynn Shniper, EBSA; Kathy Sykes,EPA; Julie Dawson Weeks and Ellen Kramarow, NCHS;John Phillips, and Prisca Fall, NIA; Helen Zayac Lamont,ivASPE; Jennifer Park, OMB; Beth Han, and JenniferSolomon, SAMHSA; Howard Iams and Brad Trenkamp,SSA; Hazel Hiza, USDA; and Carolyn Stoesen,VA.In addition to the 16 agencies of the Forum, theDepartment of Agriculture (USDA) was invited tocontribute to this report. The Forum greatly appreciatesthe efforts of Hazel Hiza and TusaRebecca Schap, Centerfor Nutrition Policy and Promotion, USDA, in providingvaluable information from their agency. Other staffmembers of Federal agencies who provided data andassistance include Jennifer Klocinski, ACL; Rachel KrantzKent and Geoffrey Paulin, BLS; William Dean, MariaDiacogiannis, Deborah Kidd, Chris McCormick, MaggieMurgolo, Joseph Regan, and Laura Saffron, CMS; EllenBaldridge, David Mintz, and Rhonda Thompson, EPA;Carolyn Lynch, HUD; Elizabeth Arias, Robin Cohen,Nazik Elgaddal, Ginny Freid, Lauren Harris-Kojetin,Cynthia L. Ogden, Eunice Park-Lee, and ManishaSengupta, NCHS; Vicky Cahan, NIA; Lynn Fisher, SSA;and Peter Ahn and Tom Garin, VA.The Forum is also indebted to the people outside theFederal government who contributed to this chartbook:Gwen Fisher, Cathy Liebowitz, and David Weir, Universityof Michigan; and Xianfen Li, Harris Corporation.Member agencies of the Forum provided funds andvaluable staff time to produce this report. NCHS andits contractor, American Institutes for Research (AIR),facilitated the production, printing, and disseminationof this report. Melissa Diliberti, Ashley Roberts, KatieMallory, Susan Armstrong, and Kathryn Low managedthe report’s production process and designed the layout;Richard Devens, First XV Communications, providedconsultation and editing services.
About This ReportIntroductionOlder Americans 2016: Key Indicators of Well-Being (OlderAmericans 2016) is the seventh in a series of reports by theFederal Interagency Forum on Aging-Related Statistics(Forum) describing the overall condition of the U.S.population age 65 and over. The reports use data fromover a dozen national data sources to construct broadindicators of well-being for the older population and tomonitor changes over time. By following these data trends,the reports make more information available targetedtoward efforts to improving the lives of older Americans.The Forum periodically conducts a conceptual andmethodological review of report indicators and formataccording to an established indicator selection criteria (see“Selection Criteria for Indicators”). This review ensuresthat the report features the most current topics and themost reliable, accurate, and accessible statistics.After conducting a conceptual framework and literaturereview in preparation for this report, the Forum modifiedseveral existing indicators and added four new indicators:Social Security Beneficiaries, Dementia, Long-Term CareProviders, and Transportation. The 2016 report alsocontains a newly established Environment domain.This report is intended to stimulate relevant and timelypublic discussions, encourage exchanges between the dataand policy communities, and foster improvements inFederal data collection on older Americans. By examininga broad range of indicators, researchers, policymakers, andservice providers can better understand the areas of wellbeing that are improving for older Americans as well as theareas that require more attention.Structure of the ReportBy presenting data in a nontechnical, user-friendly format,Older Americans 2016 complements other more technicaland comprehensive reports from the individual Forumagencies. The report includes 41 indicators grouped in sixsections: Population, Economics, Health Status, HealthRisks and Behaviors, Health Care, and Environment.There is also a special feature this year on InformalCaregiving.Each indicator includes A paragraph describing the relevance of the indicator tothe well-being of the older population. One or more charts that illustrate important aspects ofthe data. Bulleted data highlights.The data used in the indicators are presented in tables inthe back of the report. Data source descriptions and aGlossary are also provided in the back matter.Selection Criteria for IndicatorsThe Forum chose these indicators because they meet thefollowing criteria: Easy to understand by a wide range of audiences. Objectively based on substantial research that connectsthe indicator to the well-being of older Americans. Balanced so that no single section dominates thereport. Measured periodically (but not necessarily annually) sothat they can be updated, making possible, descriptionof trends over time. Representative of large segments of the agingpopulation, rather than one particular group.Based on reliable, nationwide data sponsored, collected,or disseminated by the Federal government.Considerations When Examining theIndicatorsThe data in Older Americans 2016 usually describe theU.S. population age 65 and over. More specific age groups(e.g., ages 65–74, 75–84, and 85 and over) are reportedwhenever possible.Data availability and analytical relevance may factorinto the determination of the age groups presented inan indicator. For example, data for the age range 85and over may not appear in an indicator because smallsurvey sample sizes have resulted in statistically reliabledata for that age range not being available. On the otherhand, data for the population younger than age 65 aresometimes included in an indicator if the inclusion allowsfor a more comprehensive interpretation of the indicator’scontent. For example, in “Indicator 12: Participation inLabor Force,” a comparison with a younger populationprovided an opportunity for an enhanced interpretationof labor force trends among people age 65 and over. Inorder to show trends in the amount of savings reservedv
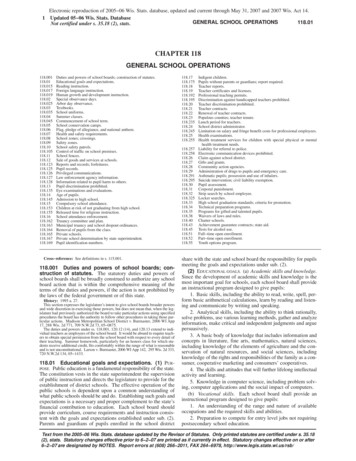
for retirement by the entire population, data on publicand private retirement assets are included for the totalpopulation in “Indicator 11: Net Worth.”To standardize the age distribution of the population age65 and over across years, some estimates have been ageadjusted by multiplying age-specific rates by time-constantweights. If an indicator has been age adjusted, this will bestated in the note under the chart(s) as well as under thecorresponding table(s).The reference population (the base population sampledat the time of data collection) for each indicator islabeled under each chart and table and is defined inthe Glossary. Whenever possible, the indicators includedata on the U.S. resident population (both people livingin the community and people living in institutions).However, many indicators show data only for the civiliannoninstitutionalized population. Because the olderpopulation residing in nursing homes (and other longterm care institutional settings) is not included in samplesbased on the noninstitutionalized population, use cautionwhen attempting to generalize the findings from thesedata sources to the entire population age 65 and over. Thisis especially true for the older age groups. For example,in 2014, 10 percent of the population age 85 and overwas not included in the civilian noninstitutionalizedpopulation as defined by the U.S. Census Bureau.Civilian noninstitutionalized population as a percentage of the total residentpopulation, by age: July 1, 2014.Percent10097999790to determine whether differences between populationsexist at generally accepted levels of confidence or whetherthey occurred by chance. Unless otherwise noted, onlydifferences that are statistically significant at the 0.05 levelare discussed in the text. To indicate the reliability of theestimates, standard errors for selected estimates in thechartbook can be found on the Forum’s website at http://www.agingstats.gov.Where possible, data estimates have been obtained fromthe true unrounded value of the original data. Data arerounded to one decimal place in the data tables and areshown as whole numbers in the report text unless a finerbreakdown is needed to show a significant differencebetween two estimates that would otherwise round to thesame number. While figures display rounded numbers, thefigures are created using unrounded estimates.Finally, the data in some indicators may not sum to totalsbecause of rounding.Sources of DataThe data used to create the charts are provided in thetables in the back of the chartbook along with data thatare described in the bullets below each chart. The sourceof the data for each indicator is noted below the chart.Descriptions of the data sources can be found in the backmatter. Additional information about these data sourcesand contact information for the agency providing thedata are available on the Forum’s website at http://www.agingstats.gov.80Data Needs60In Older Americans 2012, the Forum identified sixareas where better data were needed to support researchand policy efforts related to older Americans: informalcaregiving, residential care, elder abuse, functioningand disability, mental health and cognitive functioning,pension measures, and end-of-life issues.4020065 and over65–7475–8485 and overSOURCE: U.S. Census Bureau, Population Estimates, July 1, 2014.Survey YearsThe reader should be aware that the range of yearspresented in each chart varies because data availability isnot uniform across the data sources.Accuracy of the EstimatesMost estimates in this report are based on a sample of thepopulation and are therefore subject to sampling error.Standard tests of statistical significance have been usedviSince then, the Federal statistical community and theForum have made significant improvements to enhancedata availability related to these data needs, many ofwhich are reflected in Older Americans 2016. This reportincludes a new indicator on dementia using data from the2011 National Health and Aging Trends Study (NHATS)as well as a special feature on informal caregiving basedon data from the 2011 National Study of Caregiving(NSOC). Data from the 2015 NHATS and NSOC willbe available in late 2016. A new indicator on long-termcare providers, with data from the new 2014 National
Study of Long-Term Care Providers, addresses residentialcare data needs. The indicator on functional limitationspresents disability prevalence among those 65 and over,using questions developed by the United Nationssponsored Washington Group on Disability Statistics andcollected as part of the National Health Interview Survey.The report also includes a new indicator on social securitybeneficiaries. This indicator is based on data from theMaster Beneficiary Record (MBR) which are publishedannually in the Statistical Supplement to the SocialSecurity Bulletin.Other key indicators were identified by the Forum forinclusion in this year’s report, such as new measures onoral health, cancer screenings, and transportation. Dataon other topics of continued interest, like end-of-life, havebeen covered in other Federal reports.With continued discussion on measurement issues and theeffect of survey technique on estimates of the incidenceof elder abuse1 as well as with the number of older adultswith substance use disorders in the U.S. projected todouble by 2020,2 the Forum continues to identify elderabuse and substance use disorder as ongoing areas of dataneed and will follow up with forthcoming survey findings.MissionThe Forum’s mission is to encourage cooperation andcollaboration among Federal agencies in order to improvethe quality and utility of data on the aging population.The specific goals of the Forum are Widening access to information on the agingpopulation through periodic publications and othermeans. Promoting communication among data producers,researchers, and public policymakers. Coordinating the development and use of statisticaldatabases among Federal agencies. Identifying information gaps and data inconsistencies. Addressing concerns regarding collection, access, anddissemination of data.More InformationFor more information about Older Americans 2016 orother Forum activities, contactTraci CookStaff DirectorFederal Interagency Forum on Aging-Related Statistics3311 Toledo RoadHyattsville, MD 20782Phone: (301) 458-4082Fax: (301) 458-4021E-mail: agingforum@cdc.govWebsite: http://www.agingstats.govOlder Americans on the InternetAdditional material can be found at http://www.agingstats.gov. The website contains Data for all of the indicators in Excel spreadsheets(with standard errors, when available). Data source descriptions.PowerPoint slides of the charts.The Forum’s website also provides other Forumpublications, workshop documents, agency contacts,subject area contact lists for Federal statistics, andinformation about the Forum.Additional Online ResourcesAdministration for Community LivingA Profile of Older Americanshttp://www.aoa.acl.gov/Aging Statistics/Profile/index.aspxAging Integrated Databasehttp://www.agid.acl.gov/ACL Program Evaulations and Related Reportshttp://www.aoa.acl.gov/program results/programevaluation.aspxAgency for Healthcare Research and QualityInvestigating questions of data quality.Research Tools and ging cross-national research and data collectionon the aging population.Bureau of Labor StatisticsBureau of Labor Statistics Datahttp://www.bls.gov/datavii
U.S. Census BureauAge d-sex.htmlStatistical Abstract of the United ime-series/statistical abstracts.htmlLongitudinal Employer-Household Dynamicshttp://lehd.did.census.gov/led/Centers for Medicare & Medicaid ServicesCMS Research, Statistics, Data, and htmlDepartment of Housing and Urban DevelopmentPolicy Development and Research Information Serviceshttp://www.huduser.govDepartment of Veterans AffairsVeteran Data and Informationhttp://www1.va.gov/vetdataEmployee Benefits Security AdministrationEBSA’s rch.htmlEnvironmental Protection AgencyInformation ndsustainability-listserveNational Center for Health StatisticsLongitudinal Studies of Aginghttp://www.cdc.gov/nchs/lsoa.htmHealth, United Stateshttp://www.cdc.gov/nchs/hus.htmviiiHealth Indicators Warehousehttp://www.healthindicators.gov/National Institute on AgingNIA Centers on the Demography of Aginghttp://www.agingcenters.org/National Archive of Computerized Data on Aginghttp://www.icpsr.umich.edu/NACDAPublicly Available Datasets for Aging-Related ndary-analyses-behavioraland-socialOffice of the Assistant Secretary for Planning andEvaluation, HHSOffice of Disability, Aging, and Long-Term Care Policyhttp://www.aspe.hhs.gov/ /office specific/daltcp.cfmOffice of Management and BudgetFederal Committee on Statistical Methodologyhttps://fcsm.sites.usa.govSocial Security AdministrationSocial Security Administration Statistical Informationhttp://www.ssa.gov/policySubstance Abuse and Mental Health ServicesAdministrationCenter for Behavioral Health Statistics and Qualityhttp://www.samhsa.gov/dataCenter for Mental Health officescenters/cmhsOther v
Table of ContentsForeword . iiiAcknowledgements.ivAbout This Report.vList of Tables .xiHighlights .xviiPOPULATIONIndicator 1: Number of Older Americans . 2Indicator 2: Racial and Ethnic Composition . 4Indicator 3: Marital Status . 5Indicator 4: Educational Attainment . 6Indicator 5: Living Arrangements . 8Indicator 6: Older Veterans . 9ECONOMICSIndicator 7: Poverty . 12Indicator 8: Income . 13Indicator 9: Sources of Income . 14Indicator 10: Social Security Beneficiaries . 16Indicator 11: Net Worth . 18Indicator 12: Participation in Labor Force . 20Indicator 13: Housing Problems . 22Indicator 14: Total Expenditures . 24HEALTH STATUSIndicator 15: Life Expectancy . 26Indicator 16: Mortality . 27Indicator 17: Chronic Health Conditions . 28Indicator 18: Oral Health . 29Indicator 19: Respondent-Assessed Health Status . 30Indicator 20: Dementia. 31Indicator 21: Depressive Symptoms . 32Indicator 22: Functional Limitations . 34HEALTH RISKS AND BEHAVIORSIndicator 23: Vaccinations . 38Indicator 24: Cancer Screenings. 39Indicator 25: Diet Quality . 40Indicator 26: Physical Activity . 41Indicator 27: Obesity . 42Indicator 28: Cigarette Smoking . 43ix
HEALTH CAREIndicator 29: Use of Health Care Services . 46Indicator 30: Health Care Expenditures . 48Indicator 31: Prescription Drugs . 50Indicator 32: Sources of Health Insurance. 52Indicator 33: Out-of-Pocket Health Care Expenditures . 53Indicator 34: Sources of Payment for Health Care Services . 54Indicator 35: Veterans’ Health Care . 55Indicator 36: Residential Services . 56Indicator 37: Personal Assistance and Equipment . 58Indicator 38: Long-Term Care Providers . 60ENVIRONMENTIndicator 39: Use of Time . 64Indicator 40: Air Quality . 66Indicator 41: Transportation .
transportation access for older Americans. Indicators have also been added to describe dementia rates (including Alzheimer's disease rates, among the non-nursing home population) as well as to examine the number of older Americans receiving long-term care by different types of providers. Finally, the Supplemental Poverty Measure