Transcription
Health ofOlder Adultsin New York CityHealth of Older Adults in New York City1
2Health of Older Adults in New York City
Letter from theCommissionerDear New Yorker,We are pleased to present “Health of Older Adults in New York City,” the NewYork City Health Department’s comprehensive summary of the health of ourcity’s older adults.Older New Yorkers — those ages 65 and older — currently make up about 13% ofour city’s residents. New Yorkers are living longer than ever, with an impressivelife expectancy of 81.2 years, 2.5 years longer than the national average. Thenumber of older New Yorkers is projected to grow by over 41%, from 1,002,000 in2010 to 1,410,000 by 2040.All New Yorkers deserve a fair chance to live not only a long life but also ahealthy and vibrant one. Unfortunately, not all New Yorkers reach old age, andfor those who do, opportunities to live the healthiest life possible are frequentlylacking. This results in deeply rooted health inequities, or avoidable and unjustdifferences in health outcomes. Additionally, many older New Yorkers live inenvironments that harm rather than protect their safety, and promote socialisolation rather than social connection.The Health Department, together with many partners and City agencies,is committed to making New York a city that supports healthy aging for allindividuals in all communities. We hope the data in this report support workacross the city to fill unmet needs, reduce disparities and create a healthier cityfor older adults.Oxiris Barbot, MDHealth of Older Adults in New York City3
What is healthy aging?Heathy aging is more than growing older without having chronic health problems or diseases. For olderadults, healthy aging includes being able to meet basic needs, to learn, to be mobile, to build and maintainrelationships, and to contribute to society.1 For most people, this means being able to remain independentand choose where and how they age. Every New Yorker deserves a healthy aging experience.This report defines older adults as New Yorkers ages 65 and older; this marks the time when many workingadults retire and become eligible for benefits such as Medicare. Although this threshold is used throughoutthe report, it is important to remember that health outcomes reported reflect cumulative circumstances andexperiences throughout a person’s life. Racism, discrimination, gender oppression, ageism and other injusticescan negatively affect health and lead to early death or poor quality of life. Understanding what promotes andharms health before age 65 is especially important for communities who have been marginalized, includingcommunities of color, LGBTQ communities, people who have been incarcerated or justice-involved, peoplewho have experienced homelessness, people living with HIV, and people with disabilities. Individuals fromthese groups often experience serious health challenges at ages younger than 65.For people who live to older ages, the cumulative effects of oppression result in differences in health byrace and ethnicity. In New York City (NYC), a long history of residential segregation and disinvestment inneighborhoods of color has left many older New Yorkers of color without the supports needed for a healthyaging experience, including economic security, affordable housing, social support, safety, accessible publictransportation and health care. Similarly, adults born outside the United States are more likely to live inneighborhoods with high poverty, and less likely to have access to medical care. However, some age-relatedchallenges impact all older adults, including higher risk of social isolation, limitations in routine dailyactivities and economic challenges.2Older New Yorkers are a vibrant part of the city, contributing wisdom, experience and civic engagement thatstrengthen our communities. Given the specific contributions and needs of older adults, it is importantto understand the unique health characteristics of this population. This report shares data on the healthand well-being of older New Yorkers and supports efforts to make NYC a place where everyone has theopportunity to age with health and dignity.4Health of Older Adults in New York City
Table of Contents3Letter from theCommissioner4What is Healthy Aging?6Older Adults inNew York City9Social Environmentand Support13Housing andNeighborhoods1520Communicable Diseases22Sexual Health23Chronic Disease26Brain Healthand Cognition27Mental Health28Health Care and Access29Health Behaviorsand RisksAnalyses17AcknowledgmentsGeneral Health andFunctional Abilities19Dental Health2930ReferencesAbout this reportUnless otherwise noted, all data in thisreport describe New Yorkers ages 65 andolder. Indicators presented were chosento reflect well-being or factors that affectwell-being, the burden of short- andlong-term health conditions, and accessto health care among older adults. Thisreport also identifies disparities withinthe older adult population by presentingdata by race and ethnicity, country of birth(U.S.-born vs. born outside the U.S.), agegroup, sex and household poverty level.For select indicators, we also examinedifferences by household type, boroughor neighborhood poverty level. In thetext, we prioritize differences by race andethnicity and country of birth giventhe magnitude of these inequities.Note: For the purpose of this publication,Latino includes people of Hispanic,Latino or Spanish origin regardless ofreported race. White, Black and Asian/Pacific Islander exclude those whoidentify as Latino. Not all indicatorsin this report present all of the data byeach of the different strata (e.g., raceand ethnicity, country of birth). Thetext highlights statistically significantfindings (p 0.05), but does not includeall results. Appendix tables containadditional data that are not included inthe main report. See appendix tableswith technical notes for data sourcedescriptions and report limitations.Data in this report may differ fromother published sources.AppendixHealth of Older Adults in New York City5
Older Adults inNew York CityThere are 1.1 million older adults in NYC, making up 13% of the population.NYC residents by age group (years)87% ( 65)7% (65-74)4% (75-84)2% (85 )Country of birth (percent of adults 65 and older)Nearly half of older New Yorkers were bornoutside the U.S. These individuals come from 130different countries and speak over 90 languages.Among older adults born outside the U.S., the mostcommon countries of birth are China (12%) and theDominican Republic (11%).51%U.S.-bornRace and ethnicityForty-four percent of older New Yorkers identifyas White, 22% as Black, 21% as Latino and 12% asAsian/Pacific Islander. Two percent identify asmixed race or another race or ethnicity, which isreferred to as Other.12%Asian/PI22%Black21%Latino44%White49%Born outsidethe U.S.Highest level of education achievedHigher education levels are linked to better healthoutcomes. Almost 30% of older adults in NYC havecompleted high school or earned a general equivalencydiploma (GED) as the highest level of educationalattainment. One-quarter of older New Yorkers havecompleted bachelor’s or advanced degrees.32%Less than high school28%High school diploma or equivalent15%Some college or associate’s degree25%College graduate or higher2% OtherNote: Percentages may not sum to 100% due to rounding. For the purpose of thispublication, Latino includes people of Hispanic, Latino or Spanish origin regardlessof reported race. White, Black and Asian/Pacific Islander (PI) exclude those who identifyas Latino.Integrated Public Use Microdata Series, U.S. Census American Community Survey, 2012-20166Health of Older Adults in New York City
Gender identityForty percent of older New Yorkers identify as menand 60% as women. Less than 1%* of older NewYorkers identify as transgender men or women,an estimated 1,000 older adults.Sexual orientation3%of older adults inNYC identify as gay,lesbian or bisexual.60%40%WomenMenEnglish proficiency and language spoken at home (percent of adults 65 and older)Two-thirds of older adults speak English very well. Fifty-four percent of older adults in NYC speakEnglish at home, 20% speak Spanish and 6% speak Chinese.English proficiency among older adultsLanguage spoken at home among older adults66%Speaks Englishonly or very Speaks Englishless than verywell or not at all20%SpanishAdditional data on the demographics of older adults in New York City canbe found in the NYC Department for the Aging (DFTA) Profile of Older NewYorkers (note: the definition of older adults is 60 and older in the DFTAreport), New York Academy of Medicine IMAGE: NYC Interactive Map ofAging and NYC Department of City Planning’s data portal.*Interpret estimate with caution due to small number of events.Note: Percentages may not sum to 100% due to rounding.NYC DOHMH Community Health Survey, 2017 (Gender identity; Sexual orientation) Integrated Public Use Microdata Series, U.S. Census American Community Survey, 2012-2016(English proficiency; Language spoken at home)Health of Older Adults in New York City7
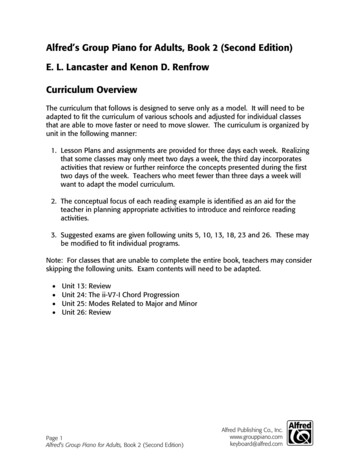
Older adults by neighborhood†BronxTotal number of NYC residentswho are 65 years and olderManhattan 5,0005,000-10,000 10,000QueensNon-residentialBrooklynStaten Island†Neighborhood tabulation areas are aggregations of census tracts that represent a minimum population of 15,000 residents and were created to project populations at a smallarea level for PlaNYC. For more information, visit nyc.gov/planning and search “neighborhood tabulation areas.”NYC Department of City Planning, American Community Survey, 2012- 20168Health of Older Adults in New York City
Social Environmentand SupportOlder adults live in different settings, including in their own residence, withfamily or in independent living communities, nursing homes or assisted livingfacilities. For older adults, their living situation, including the makeup of theirhousehold and their financial burdens, can affect their well-being and physical,mental and cognitive health.3,4Economic stressStructural barriers such as lack of access to education, good jobsand the ability to build wealth create income inequality and affectthe economic security of some older adults. As a result, some olderadults struggle to pay for basic needs such as food, transportationand medicine. Increasing reliance on income from work andgovernment assistance programs (e.g., social security) instead ofon retirement savings also contributes to economic insecurity.5One in five older New Yorkers lives below the poverty level. Olderadults who identify as Latino (27%) or Asian/Pacific Islander(26%) are more likely to live below the poverty level comparedwith those who identify as Black (19%) or White (17%).Older adults who live belowthe federal poverty level(percent of adults 65 and older)65 overall21%By race and ethnicityAsian/PI26%Black19%Latino27%White17%By country of birth25%17%Born outside U.S.-bornthe U.S.Living aloneLiving alone can increase the likelihood of social isolation, which has been associated with increased riskof mortality and cognitive decline.6 About one in three older adults in NYC lives alone. The likelihood ofliving alone increases with age. Asian/Pacific Islander older adults (14%) are the least likely to live alonecompared with Latino (30%), Black (34%) and White older adults (38%). Black and Latino older adults areless likely than White older adults to live alone. Older adults born outside the U.S. (24%) are less likely tolive alone than those born in the U.S. (41%).Older adults who live alone (percent of adults 65 and older)By country of birth65 overallBy sexBy household poverty32%Note: Household poverty is defined as income as a percentageof the federal poverty level.By race and %Born outside U.S.-bornthe U.S.53%38%40%24%WomenMen 100%(highpoverty)100% 200%27%200% 400%20%21%400% 500% 500%(lowpoverty)Living in a nursing homeThree percent of older adults in NYC live in a nursing home.American Community Survey as augmented by NYC Opportunity, 2016 (Economic stress) Integrated Public Use Microdata Series, U.S. Census American Community Survey, 20122016 (Living alone); U.S. Census Summary File 1, 2010 (Living in nursing home)Health of Older Adults in New York City9
Living in a multigenerational householdA multigenerational household has two or more generations, such as an adult child or grandchild, livingtogether. One in three older adults in NYC lives in a multigenerational household. Asian/Pacific Islander(50%), Black (44%) and Latino older adults (43%) are more likely to live in multigenerational householdsthan White older adults (19%).Older adults who live in a household with two or more generations (percent of adults 65 and older)65 overallBy country of birth33%43%Black50%44%Latino43%White19%35%25%By race and ethnicityAsian/PIBy sexBorn outside U.S.-bornthe U.S.WomenBy household poverty31%Men23% 100%(highpoverty)41%45%200% 400%400% 500%33%29%100% 200% 500%(lowpoverty)Note: Household poverty is defined as income as a percentageof the federal poverty level.Responsibility for grandchildren under 18 yearsThe increase in life expectancy of older adults has allowed for more interaction with younger generations.7Twenty percent of older New Yorkers who have grandchildren living in the same home report beingresponsible for most of the basic needs of those under the age of 18. Black (23%) and Latino older adults (22%)are more likely to be responsible for grandchildren than White older adults (16%). Older adults born in the U.S.(25%) are more likely than those who are born outside the U.S. to be responsible for grandchildren (18%).Older adults whotake care of theirgrandchild’sbasic needs(percent of adults 65and older who live witha grandchild)65 overall20%By age group (years)By country of birth65-7422%Born outside the U.S.18%75-8415%U.S.-born25%85 11%By household povertyBy race and ethnicity 100% (high poverty)27%Asian/PI15%100%- 200%24%Black23%200%- 400%17%Latino22%400%- 500%10%White16% 500% (low poverty)17%Note: Household poverty is defined as income as a percentageof the federal poverty level.CaregivingCaregiving is the act of providing assistance to those who need help with daily activities,such as meal preparation, bathing, dressing and keeping track of medications. In manycases, long-term caregiving can be stressful and affect the health and well-being of thecaregiver.8 Seventeen percent of older adults in NYC report that they provided regularcare or assistance in the past month to a friend or family member who has a healthproblem, long-term illness or disability. In a 2017 survey, the NYC Department for theAging (DFTA) reported that caregivers of older adults served by DFTA and AARP weremostly White or Black women, ages 55 or older.817%of olderadults in NYCreport beinga caregiver.Integrated Public Use Microdata Series, U.S. Census American Community Survey, 2012-2016 (Living in a multigenerational household; Responsibility for grandchildren under18 years); New York State Department of Health, Behavioral Risk Factor Surveillance System, 2014-2016 (Caregiving)10Health of Older Adults in New York City
Social supportHaving emotional support andclose social ties are associatedwith better overall healthamong older adults.9 Over half(54%) of older adults reportgetting together with at leastone friend or family memberin the past week.Over half of older adults report gettingtogether with at least one friend orfamily member in the past week.History of incarceration or community supervisionBeing incarcerated is associated with early aging.10 Adults with a history of incarceration experiencechronic diseases and disability at earlier ages and at higher rates than adults without a history ofincarceration. Eight percent of NYC adults 50 and older have ever spent time in a correctionalfacility, jail, prison or detention center, or have ever been under probation or parole supervision. BlackNew Yorkers experience disproportionately high rates of policing (i.e., are more often investigated,questioned or arrested by police) compared with White New Yorkers.11 In NYC, Black adults ages 50 andolder (13%) are more likely to have ever been involved in the criminal justice system than White adultsages 50 and older (6%). Adults ages 50 and older who were born in the U.S. (11%) are more likely to haveever been involved in the criminal justice system than those born outside the U.S. (4%). Men ages 50 andolder (14%) are more likely to have a history of criminal justice involvement than women (3%).Adults ages 50 and older with criminal justice involvement (percent of adults 50 and older)50 overallBy race and ethnicity8%Asian/PIBlackBy country of birthBy sex3%*13%Latino8%White6%*Interpret estimate with caution due tosmall sample size.4%Born outsidethe U.S.14%11%3%U.S.-bornWomenMenOlder adults among the incarcerated populationIn NYC in 2018, adults ages 50 years and older represented 17% of the average daily jail incarcerated population.NYC DOHMH Social Determinants of Health Survey, 2017 (Social support); NYC DOHMH Community Health Survey, 2017 (History of incarceration or community supervision)NYC Department of Corrections, 2018 (Older adults among incarcerated population)Health of Older Adults in New York City11
Food securityNinety-three percent of older New Yorkers report having enough food to eat.White older adults (97%) are more likely than Black (94%) and Latino olderadults (82%) to report having enough food to eat. Older adults born in the U.S.(95%) are more likely than older adults born outside the U.S. (90%) to reporthaving enough food to eat.Older adults who report having enough food (percent of adults 65 and older)65 overall93%By race and ethnicityBy country of n outside U.S.-bornthe U.S.By household povertyBy sex91%95%86%93%93%98%*99%*WomenMen 100%(highpoverty)100% 200%200% 400%400% 600% 600%(lowpoverty)*Interpret estimate with caution due to small sample size.Note: Household poverty is defined as income as a percentageof the federal poverty level.Elder abuseAbuse of older adults can take many forms, including physical, sexual,emotional or financial abuse and neglect. In all forms, a person in atrusted relationship with the older adult — including a partner, familymember or caregiver — intends to harm an older adult through bothaction and inaction.12 Abuse often goes unreported; data from a recentsurvey conducted with older New Yorkers statewide found that in NYC,92.2 per 1,000 surveyed adults ages 60 and older experienced elder abusein the past year.13NYC DOHMH Community Health Survey, 2017 (Food security)12Health of Older Adults in New York City
Housing andNeighborhoodsWhere we live affects our ability to lead healthy lives. All New Yorkers,including older adults, should have the opportunity to live in environmentsthat support health through physical activity and participation in communityactivities. In addition, communities can support the health of older adults byproviding safe, stable housing and pedestrian-friendly streets.4,14Home ownershipFewer than half of older New Yorkers live in homesowned by someone in the household. Latino (26%),Black (45%) and Asian/Pacific Islander older adults(52%) are less likely to live in a residence that isowned compared with White older adults (60%).An estimated 110,000 older New Yorkers live inpublic housing.15Older adults who live in a residence ownedby someone in the household(percent of adults 65 and older)65 overallBy household poverty48% 100% (high poverty)19%100%- 200%33%200%- 400%54%400%- 500%65% 500% (low poverty)72%Note: Household poverty is defined as income as a percentage of the federal poverty level.Households without functioning ACExtreme heat kills an average of more than 100New Yorkers each year.16 Most heat-related deathsoccur when people are inside homes without airconditioning (AC). AC use is the most effective wayto prevent heat illness. However, not all older adultshave a functioning AC. Almost one quarter of publichousing households with older New Yorkers donot have AC, compared with 9% of privately ownedhouseholds with older adults.Households using supplemental heatNew Yorkers whose building heating systems do notprovide enough heat may use other heat sources tostay warm. Using additional heat sources such askitchen stoves, charcoal grills or portable heatersincreases the risk of fire and carbon monoxidepoisoning.17,18 More than a quarter of public housinghouseholds with older New Yorkers (28%) reportthat they need to use other heat sources to stay warmcompared with privately owned households witholder adults (12%).Households with older adult residents withouta functioning AC (percent of households with a resident 65and older)65 overall10%By housing type21%Public9%PrivateBy ten IslandHouseholds with older adult residents whouse supplemental heat (percent of households with aresident 65 and older)65 overall13%By housing type28%12%PublicPrivateBy taten IslandIntegrated Public Use Microdata Series, U.S. Census American Community Survey, 2012-2016 (Home ownership); NYC Housing and Vacancy Survey, 2017 (Households withoutfunctioning AC; Households using supplemental heat)Health of Older Adults in New York City13
Fall-related injuries and deathsFalls are a major threat to older adults’ healthand independence.19 In NYC in 2016, fallsamong older adults led to 289 deaths, 30,492emergency department visits and 16,661 hospitalstays. Older women are more likely than oldermen to visit the emergency department or behospitalized due to a fall. However, men aremore likely than women to die because of a fall.Fall-related emergency department visitsamong older adults(rate per 100,000 adults ages 65 and older)65 overallBy sex2,639.82,989.6Pedestrian injuries are those sustained from a crashwith a motorized vehicle. Older adults are morelikely to die from pedestrian injuries than any otherage group in NYC.20 In 2016, older men (55.3 per100,000 population) were more likely to visit theemergency department due to a pedestrian injurythan older women (43.8 per 100,000 population).Older men and women were equally likely to behospitalized due to a pedestrian injury (20.7 per100,000 population).Pedestrian injury emergency departmentvisits among older adults(rate per 100,000 adults ages 65 and older)2,134.0per 100,000Pedestrian injuries and deaths65 overallBy sex48.543.8per 100,000WomenMenFall-related hospitalizations among olderadults (rate per 100,000 adults ages 65 and older)65 overallBy sex1,442.41,577.7Women1,246.9Men65 overallBy sex20.720.720.7WomenMenper 100,000Fall-related deaths among older adults(rate per 100,000 adults ages 65 and older)65 overallPedestrian deaths among older adults25.0(rate per 100,000 adults ages 65 and older)per 100,00032.220.1Women65 overallBy race and ethnicityBy sexMenPedestrian injury hospitalizations amongolder adults (rate per 100,000 adults ages 65 and older)per te28.9Men4.6per 100,000By race and ethnicityBy 4.3New York State Department of Health, Statewide Planning and Research Cooperative System, 2016 (Fall-related emergency department visits; Fall-related hospitalizations;Pedestrian emergency department visits; Pedestrian hospitalizations); NYC DOHMH Bureau of Vital Statistics, 2016 (Fall-related deaths; Pedestrian deaths)14Health of Older Adults in New York City
Health Behaviorsand RisksAs people age, they may need support to maintain a consistently healthylifestyle. The City of New York, in partnership with New York Academy ofMedicine and City Council, started the Age-Friendly NYC initiative to promotehealthy lifestyles, including safe and accessible public spaces, transportationoptions and health and supportive services.Physical activityAdults are encouraged to engage in at least150 minutes of moderate exercise per weekor at least 75 minutes of vigorous exercise perweek or some combination of these. Exercisemay include aerobic activities, musclestrengthening exercise, balance training or acombination thereof. The benefits are many,including reduced risk of injury from falls andthe preservation of bone, joint and musclehealth.21 Two in five older adults report theyget the recommended 150 minutes of physicalactivity per week and almost half get at least90 minutes of moderate physical activity perweek, which has been shown to be beneficial forpeople with high blood pressure. Frequency ofphysical activity decreases with age.Older adults reporting 150 minutesor more of moderate exercise per week(percent of adults 65 and older)By age group (years)65 overall39%65-7444%75-8436%85 28%**Interpret estimate with caution due to small sample size.Older adults reporting 90 minutesor more of moderate exercise per week(percent of adults 65 and older)65 overall47%By age group (years)65-7452%75-8444%85 33%**Interpret estimate with caution due to small sample size.Two in five older adultsreport they get therecommended 150 minutesof physical activity per week.NYC DOHMH Community Health Survey, 2017Health of Older Adults in New York City15
Alcohol useOlder adults who use alcohol are at increased risk for falls, car crashes,worsening of chronic conditions or medication interactions.22 Binge drinking isdefined as five or more drinks on one occasion for men and four or more drinkson one occasion for women. Heavy drinking is defined as consuming an averageof more than two drinks per day for men and more than one drink per day forwomen. Among older adults in NYC, Black older adults (2%*) are less likely tobinge drink compared with White older adults (4%). Five percent of older adultseither binge drink or drink heavily.Older adults who binge drink (percent of adults 65 and older)65 overall3%By race and ethnicityBlack2%*Latino6%White4%By sex2%Women5%Men*Interpret estimate with caution due tosmall sample size.SmokingQuitting smoking at any age can improve health and lower the risk of cancerand heart and lung diseases. About four in 10 older adults have ever smokedcigarettes in their life, with older men (57%) being more likely to have ever smokedthan older women (35%). While 8% of older adults currently smoke, it is stillimportant to support quit attempts and to refer adults who are eligible for lungcancer screening.23Older adults whohave ever smoked(percent of adults 65 and older)65 overall44%By sex57%35%WomenOlder adults whocurrently smoke(percent of adults 65 and older)NYC DOHMH Community Health Survey, 201716Health of Older Adults in New York City65 overall8%MenBy sex7%9%WomenMen
General Health andFunctional AbilitiesSelf-reported general health questions measure how people rate their ownphysical and mental health. Low self-reported health and limited functionalabilities are associated with poor health outcomes, lower quality of life andearly death.24,25 Functional abilities, or the ability to perform daily activitiessuch as bathing, dressing and moving around in and outside of the homewithout assistance, are important indicators of whether a person can safelylive independently and participate in the community.Self-reported healthMore than half of older New Yorkers rate their own health as “excellent,” “verygood” or “good.” One-third of Latino and Asian/Pacific Islander older adultsrate their health as “good” to “excellent.” About two-thirds of White and Blackolder adults rate their health as “good” to “excellent.”Older adults who report general health as “excellent,” “very good” or “good”(percent of adults 65 and older)65 overallBy race and ethnicity57%Asian/PI35%Black64%Latino34%White69%By country of birth67%46%Born outside U.S.-bornthe U.S.By household poverty 100% (high poverty)31%100%- 200%60%200%- 400%61%400%- 600%72% 600% (low poverty)82%Note: Household poverty is defined as income as a percentageof the federal poverty level.NYC DOHMH Community Health Survey, 2017Health of Older Adults in New York City17
Activities of daily livingNearly threequarters of olderNew Yorkersare able to walkand climb stairswithout a struggle.Almost nine in 10 older adult New Yorkers are able to bathe and dress themselveswithout difficulty. Only six in 10 adults ages 85 and older can bathe and dressthemselves without difficulty. Nearly three-quarters of older New Yorkers are ableto walk and climb stairs without a struggle. Ability decreases with increasing age— adults ages 85 and older are half as likely as those ages 65 to 74 to be able to walkand climb stairs.Older adults whobathe and dressthemselves withoutdifficulty (percent of65 overall86%By age group (years)93%84%61%adults by age group)65-74Older adults whowalk and climb stairswithout a struggle65 overall71%75-8485 By age group (years)81%66%(percent of adults by age group)41%65-7475-8485 Vision and hearingNine in 10 older adults, including those who wear glasses, are able to see withoutserious difficulty. Similarly, nine in 10 older adults are able to hear withoutdifficulty. The ability to see or hear without difficulty decreases with age.Older adults whocan see withoutdifficulty (percent of65 overall92%By age group (years)94%91%81%adults by age group)65-74Older adults whocan hear withoutdifficulty (percent of65 overall89%75-84By age group (years)95%88%71%adults by age group)65-74Integrated Public Use Microdata Series, U.S. Census American Community Survey, 2012-2016 (Activities of Daily Living; Vision; Hearing)18Health of Older Adults in New York City85 75-8485
Dental HealthOlder adults are at increased risk for caries (tooth decay) and periodontal(gum) disease because of decreased saliva production and other age-relatedchanges in the teeth and gums.26 In turn, unhealthy teeth an
less likely than White older adults to live alone. Older adults born outside the U.S. (24%) are less likely to live alone than those born in the U.S. (41%). Older adults who live alone (percent of adults 65 and older) 65 overall By sex By household poverty By race and ethnicity By country of birth &l